| Param | Original file | Final file |
|---|---|---|
| Filename | modeM0/AS1A13_034T03_9000005926_43999cztM0_level2.fits | modeM0/AS1A13_034T03_9000005926_43999cztM0_level2_quad_clean.evt |
| Size (bytes) | 590,279,040 | 124,917,120 |
| Size | 562.9 MB | 119.1 MB |
| Events in quadrant A | 7,509,016 | 761,721 |
| Events in quadrant B | 3,948,158 | 873,699 |
| Events in quadrant C | 3,980,249 | 844,157 |
| Events in quadrant D | 5,784,215 | 740,380 |
| Mode M9 | |||
|---|---|---|---|
| Quadrant | BADHDUFLAG | Total packets | Discarded packets |
| A | 0 | 11 | 0 |
| B | 0 | 11 | 0 |
| C | 0 | 11 | 0 |
| D | 0 | 11 | 0 |
| Mode SS | |||
|---|---|---|---|
| Quadrant | BADHDUFLAG | Total packets | Discarded packets |
| A | 0 | 168 | 0 |
| B | 0 | 168 | 0 |
| C | 0 | 168 | 0 |
| D | 0 | 168 | 0 |
| Mode M0 | |||
|---|---|---|---|
| Quadrant | BADHDUFLAG | Total packets | Discarded packets |
| A | 0 | 28587 | 2 |
| B | 0 | 17270 | 2 |
| C | 0 | 17558 | 2 |
| D | 0 | 22699 | 2 |
| Quadrant | Total seconds | Saturated seconds | Saturation percentage |
|---|---|---|---|
| A | 8090 | 1226 | 15.154512% |
| B | 8090 | 428 | 5.290482% |
| C | 8090 | 344 | 4.252163% |
| D | 8090 | 672 | 8.306551% |
Noise dominated data is calculated using 1-second bins in cleaned event files. If a bin has >2000 counts, and if more than 50% of those come from <1% of pixels, then it is considered to be noise-dominated and hence unusable.
| Quadrant | # 1 sec bins | Bins with >0 counts | Bins with >2000 counts | High rate bins dominated by noise | Noise dominated (total time) | Noise dominated (detector-on time) | Marked lightcurve |
|---|---|---|---|---|---|---|---|
| A | 9190 | 8093 | 587 | 587 | 6.39% | 7.25% | 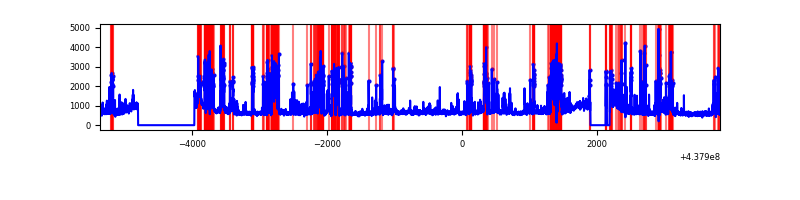 |
| B | 9190 | 8093 | 1 | 1 | 0.01% | 0.01% | 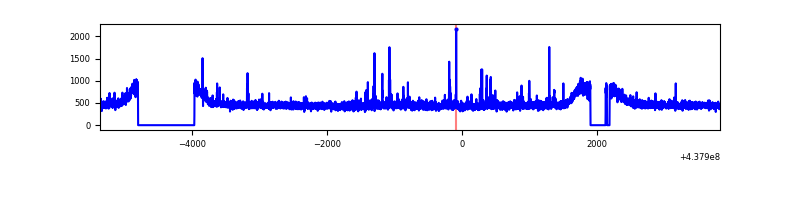 |
| C | 9190 | 8093 | 11 | 11 | 0.12% | 0.14% | 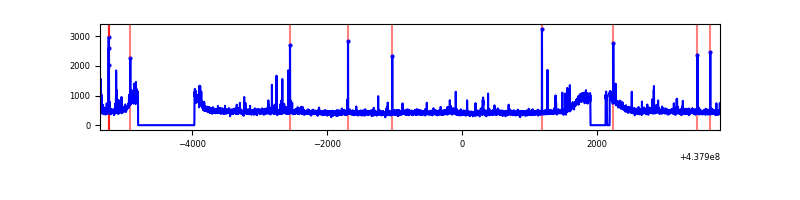 |
| D | 9190 | 8093 | 317 | 317 | 3.45% | 3.92% | 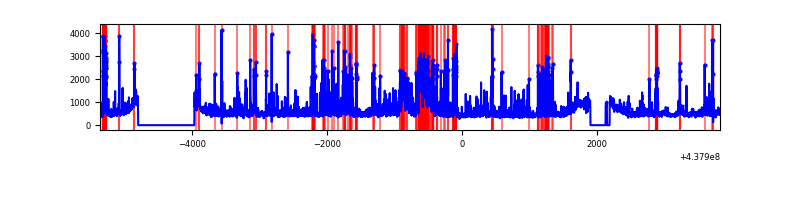 |
Top three noisy pixels from each quadrant. If the there are fewer than three noisy pixels in the level2.evt file, extra rows are filled as -1
| Pixel properties | Quadrant properties | ||||||
|---|---|---|---|---|---|---|---|
| Quadrant | DetID | PixID | Counts | Sigma | Mean | Median | Sigma |
| A | 14 | 238 | 2258962 | 11866.53 | 907 | 884 | 190.3 |
| A | 10 | 83 | 1236794 | 6494.89 | 907 | 884 | 190.3 |
| A | 15 | 223 | 466306 | 2445.86 | 907 | 884 | 190.3 |
| B | 4 | 171 | 43669 | 220.33 | 962 | 929 | 194.0 |
| B | 4 | 173 | 26826 | 133.5 | 962 | 929 | 194.0 |
| B | 12 | 111 | 24991 | 124.04 | 962 | 929 | 194.0 |
| C | 14 | 254 | 126992 | 557.1 | 959 | 962 | 226.2 |
| C | 3 | 233 | 101944 | 446.38 | 959 | 962 | 226.2 |
| C | 2 | 14 | 8652 | 33.99 | 959 | 962 | 226.2 |
| D | 1 | 52 | 1323374 | 5580.57 | 942 | 910 | 237.0 |
| D | 13 | 249 | 203081 | 853.13 | 942 | 910 | 237.0 |
| D | 13 | 171 | 195899 | 822.82 | 942 | 910 | 237.0 |
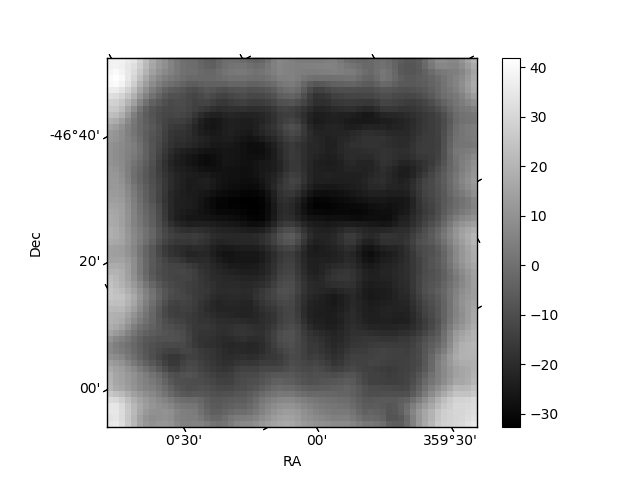
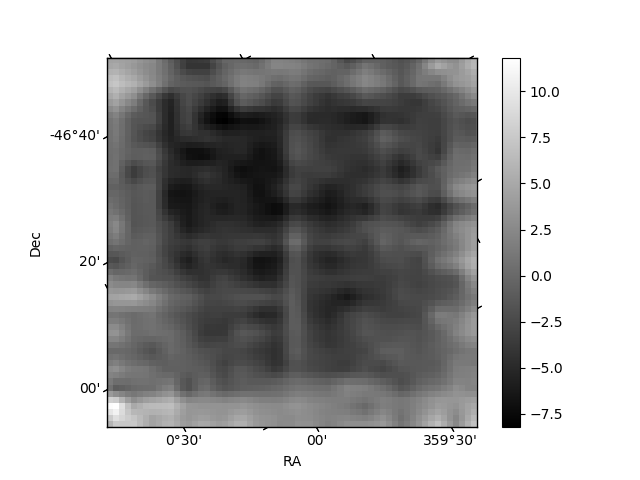
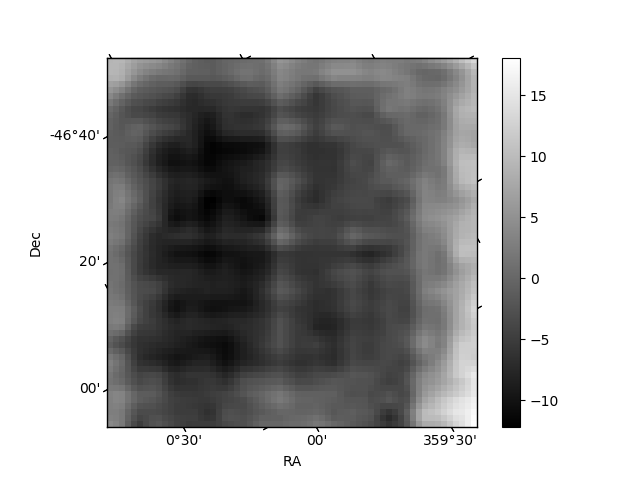
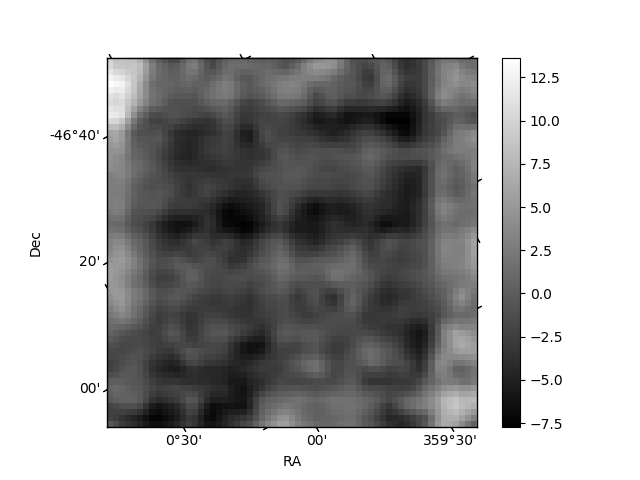
Histogram calculated using DETX and DETY for each event in the final _common_clean file
| Quadrant A | 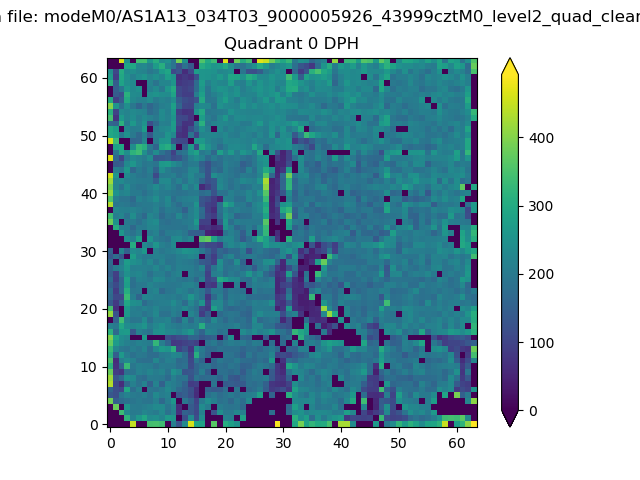 |
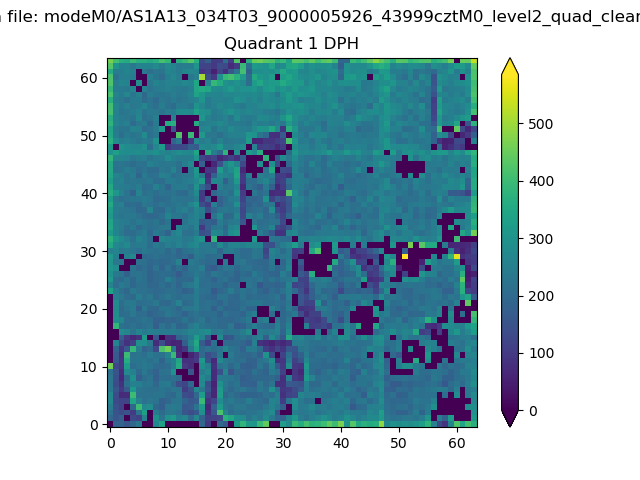 |
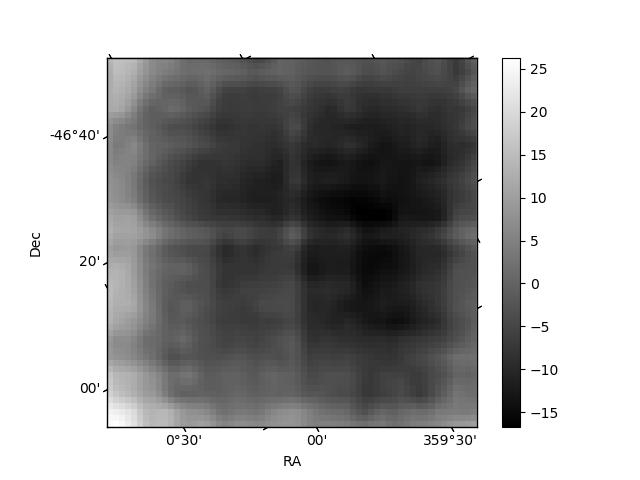
Quadrant B |
|---|---|---|---|
| Quadrant D | 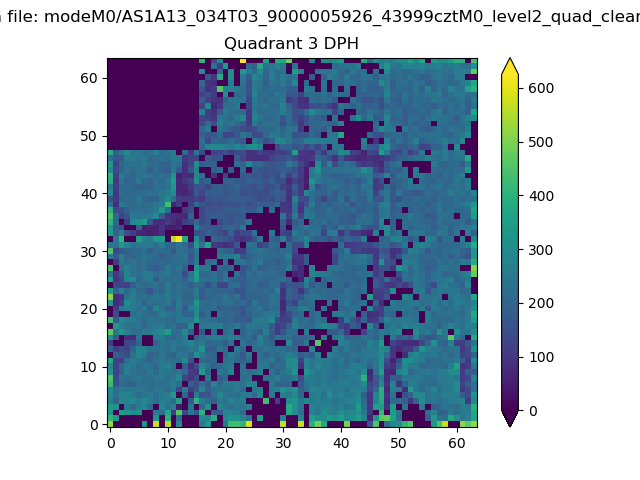 |
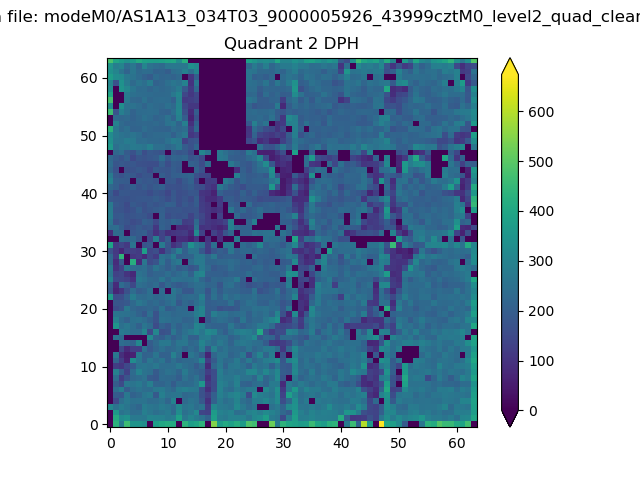 |
Quadrant C |
| Plot type | Count rate plots | Images |
|---|---|---|
| Comparison with Poisson distribution Blue bars denote a histogram of data divided into 1 sec bins. Red curve is a Poisson curve with rate = median count rate of data. |
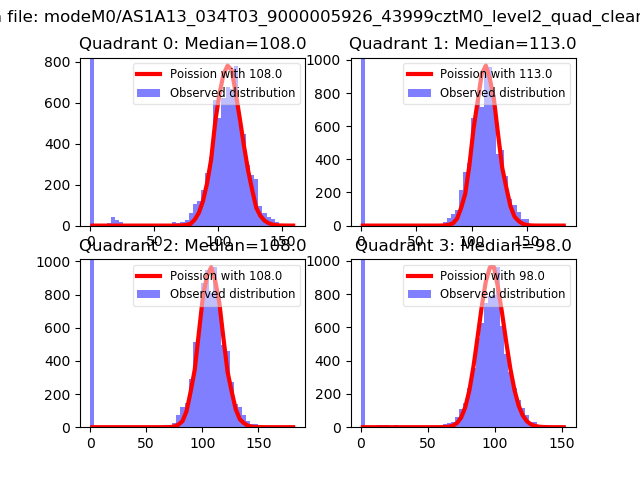 |
 |
| Quadrant-wise count rates Data is divided into 100 sec bins |
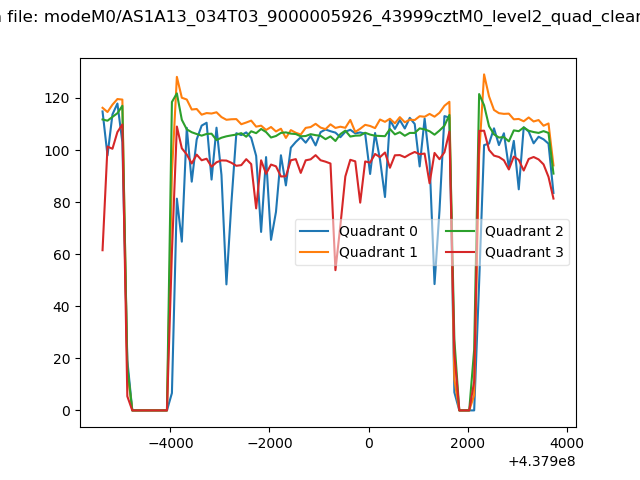 |
|
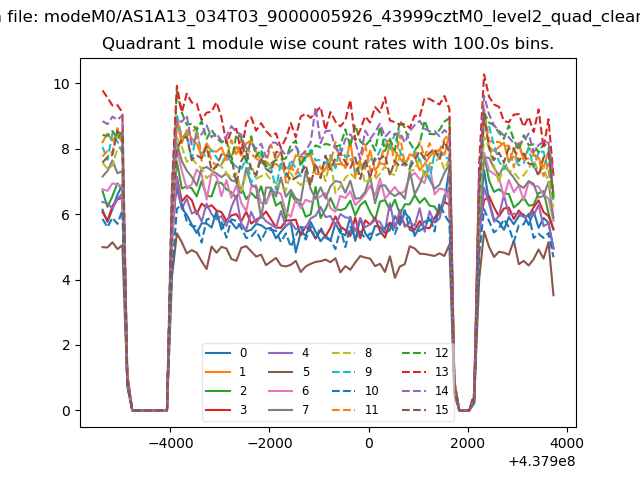
| Module-wise count rates for Quadrant A Data is divided into 100 sec bins |
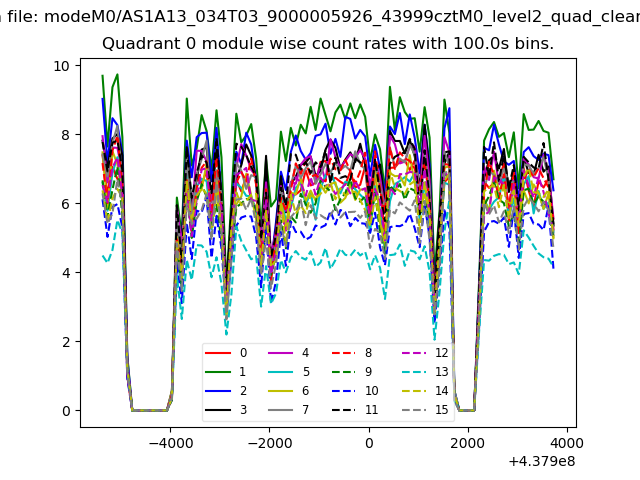 |
 |
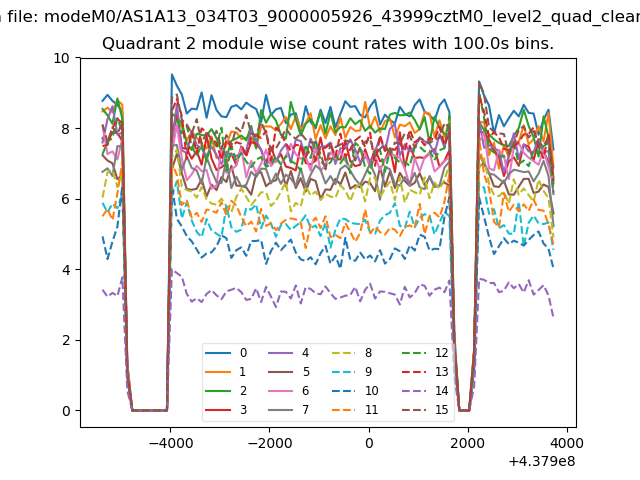
| Module-wise count rates for Quadrant B Data is divided into 100 sec bins |
 |
 |
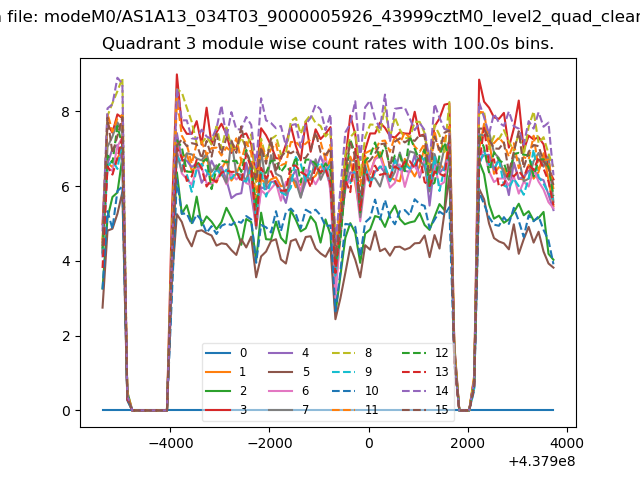
| Module-wise count rates for Quadrant C Data is divided into 100 sec bins |
 |
 |
| Module-wise count rates for Quadrant D Data is divided into 100 sec bins |
 |
 |
| Parameter | Plot |
|---|---|
| CZT HV Monitor | 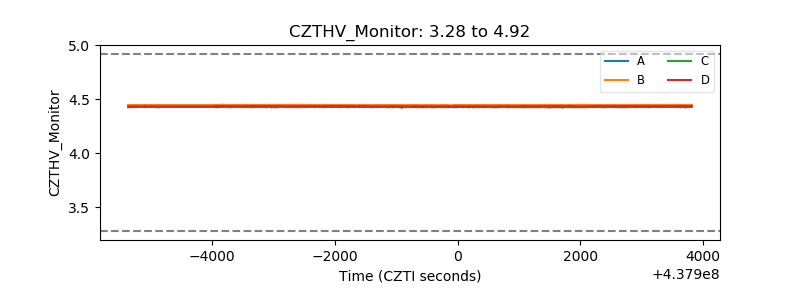 |
| D_VDD | 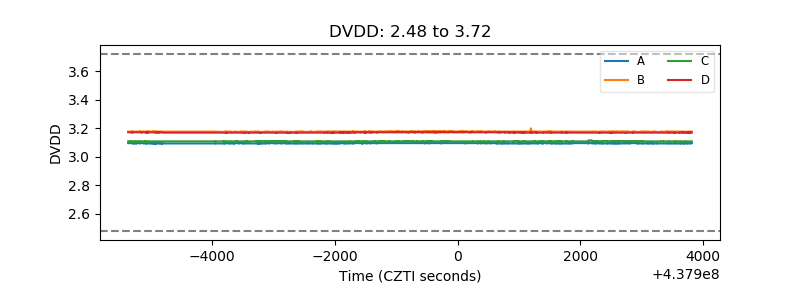 |
| Temperature 1 | 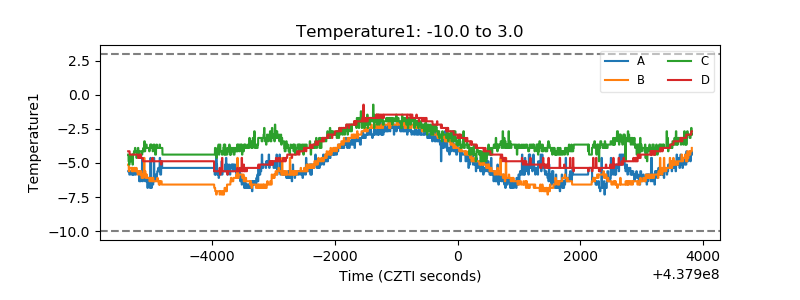 |
| Veto HV Monitor | 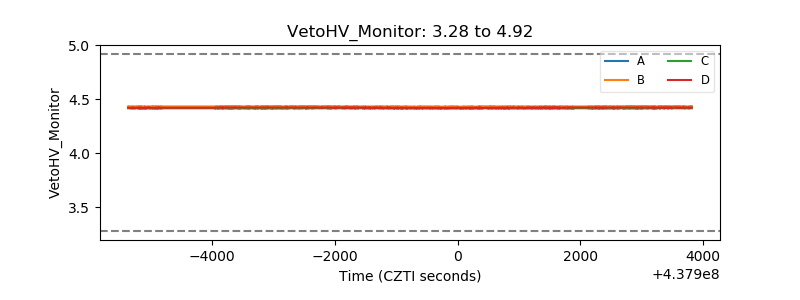 |
| Veto LLD | 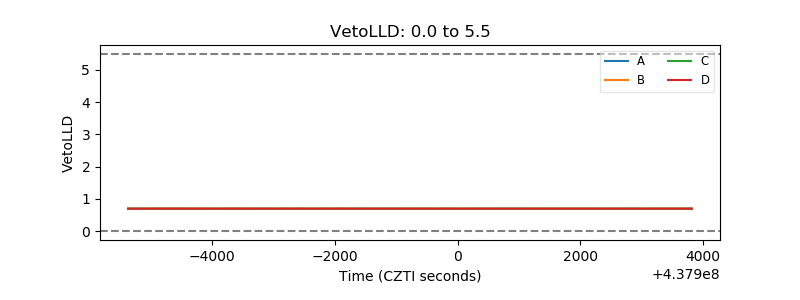 |
| Alpha Counter | 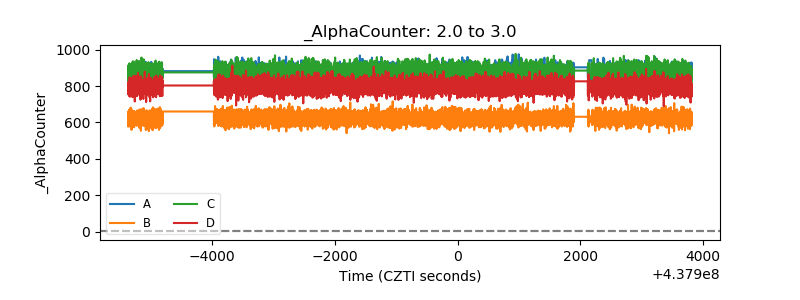 |
| _CPM_Rate | 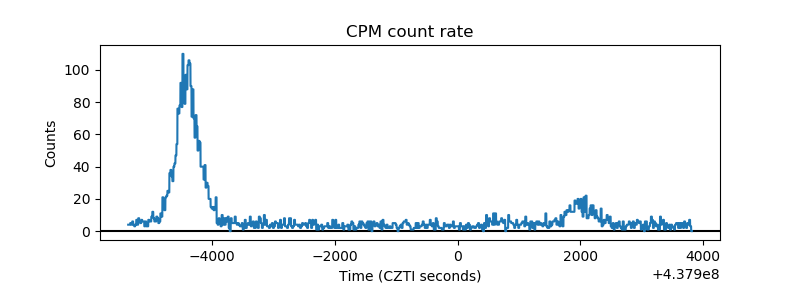 |
| CZT Counter | 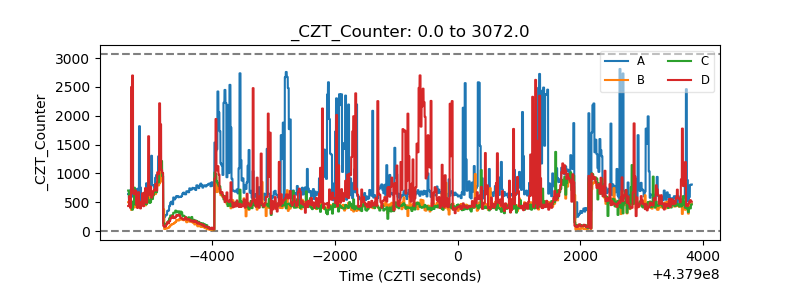 |
| +2.5 Volts monitor | 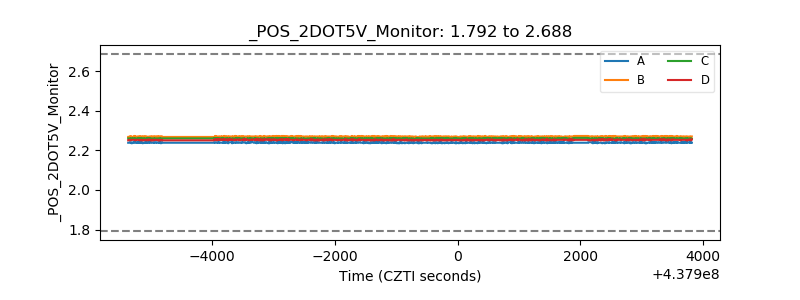 |
| +5 Volts monitor | 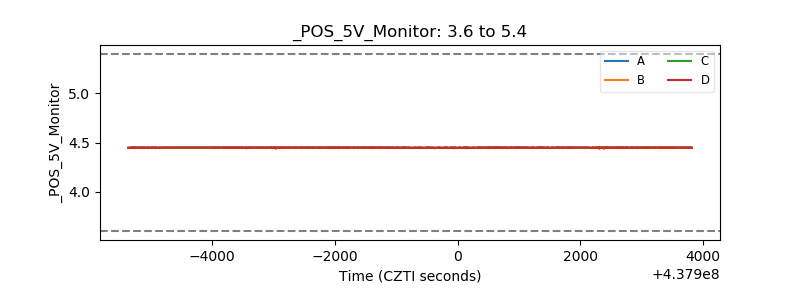 |
| _ROLL_ROT | 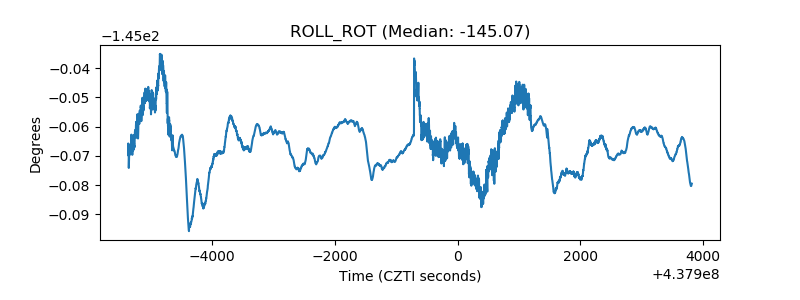 |
| _Roll_DEC | 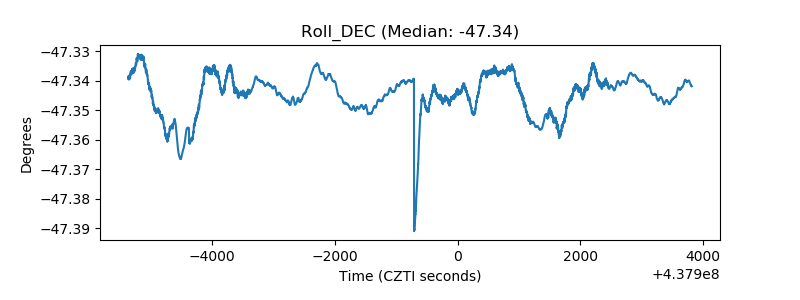 |
| _Roll_RA | 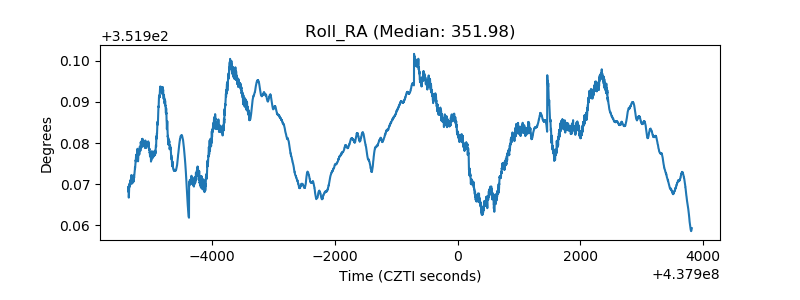 |
| Veto Counter | 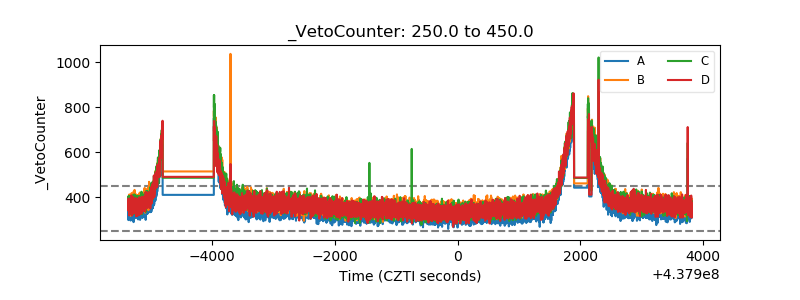 |