| Param | Original file | Final file |
|---|---|---|
| Filename | modeM0/AS1A13_034T03_9000005926_44000cztM0_level2.fits | modeM0/AS1A13_034T03_9000005926_44000cztM0_level2_quad_clean.evt |
| Size (bytes) | 233,775,360 | 44,190,720 |
| Size | 222.9 MB | 42.1 MB |
| Events in quadrant A | 3,356,900 | 233,741 |
| Events in quadrant B | 1,490,838 | 322,710 |
| Events in quadrant C | 1,561,926 | 306,013 |
| Events in quadrant D | 2,023,879 | 275,118 |
| Mode SS | |||
|---|---|---|---|
| Quadrant | BADHDUFLAG | Total packets | Discarded packets |
| A | 0 | 56 | 0 |
| B | 0 | 56 | 0 |
| C | 0 | 56 | 0 |
| D | 0 | 56 | 0 |
| Mode M0 | |||
|---|---|---|---|
| Quadrant | BADHDUFLAG | Total packets | Discarded packets |
| A | 0 | 12049 | 29 |
| B | 0 | 6254 | 0 |
| C | 0 | 6417 | 4 |
| D | 0 | 7879 | 5 |
| Quadrant | Total seconds | Saturated seconds | Saturation percentage |
|---|---|---|---|
| A | 2804 | 839 | 29.921541% |
| B | 2808 | 98 | 3.490028% |
| C | 2806 | 53 | 1.888810% |
| D | 2807 | 126 | 4.488778% |
Noise dominated data is calculated using 1-second bins in cleaned event files. If a bin has >2000 counts, and if more than 50% of those come from <1% of pixels, then it is considered to be noise-dominated and hence unusable.
| Quadrant | # 1 sec bins | Bins with >0 counts | Bins with >2000 counts | High rate bins dominated by noise | Noise dominated (total time) | Noise dominated (detector-on time) | Marked lightcurve |
|---|---|---|---|---|---|---|---|
| A | 2808 | 2807 | 457 | 457 | 16.27% | 16.28% | 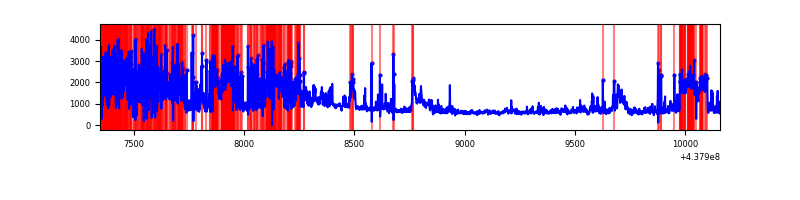 |
| B | 2808 | 2808 | 1 | 1 | 0.04% | 0.04% | 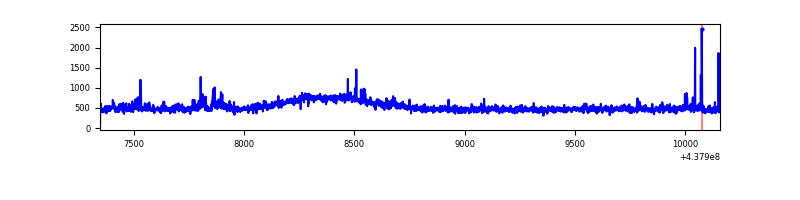 |
| C | 2809 | 2808 | 12 | 12 | 0.43% | 0.43% | 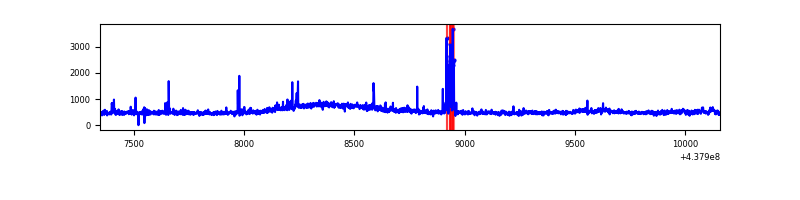 |
| D | 2808 | 2808 | 60 | 60 | 2.14% | 2.14% | 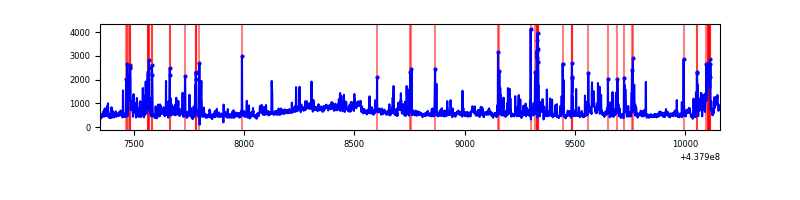 |
Top three noisy pixels from each quadrant. If the there are fewer than three noisy pixels in the level2.evt file, extra rows are filled as -1
| Pixel properties | Quadrant properties | ||||||
|---|---|---|---|---|---|---|---|
| Quadrant | DetID | PixID | Counts | Sigma | Mean | Median | Sigma |
| A | 15 | 223 | 1122571 | 16562.74 | 314 | 304 | 67.8 |
| A | 14 | 238 | 658079 | 9707.63 | 314 | 304 | 67.8 |
| A | 10 | 83 | 348593 | 5140.15 | 314 | 304 | 67.8 |
| B | 0 | 213 | 28070 | 378.7 | 354 | 341 | 73.2 |
| B | 4 | 171 | 22837 | 307.24 | 354 | 341 | 73.2 |
| B | 4 | 173 | 20861 | 280.25 | 354 | 341 | 73.2 |
| C | 3 | 233 | 100406 | 1170.6 | 352 | 352 | 85.5 |
| C | 14 | 254 | 81821 | 953.17 | 352 | 352 | 85.5 |
| C | 15 | 158 | 6406 | 70.83 | 352 | 352 | 85.5 |
| D | 1 | 52 | 302424 | 3410.6 | 350 | 338 | 88.6 |
| D | 5 | 235 | 138500 | 1559.87 | 350 | 338 | 88.6 |
| D | 13 | 249 | 97448 | 1096.39 | 350 | 338 | 88.6 |
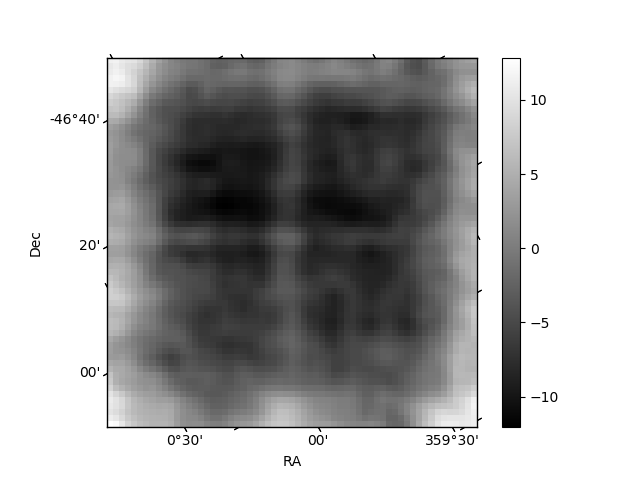
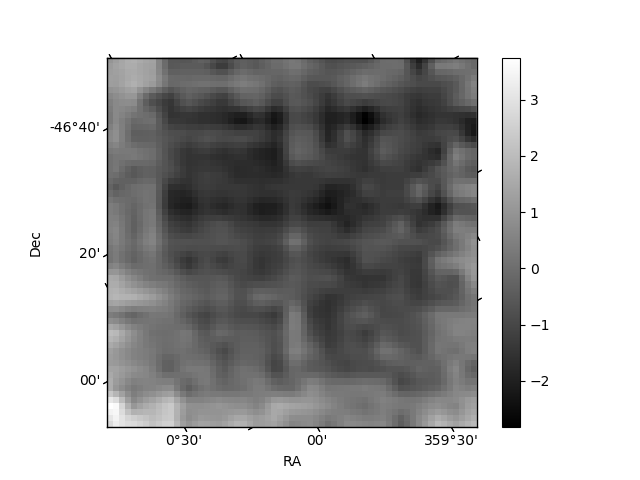
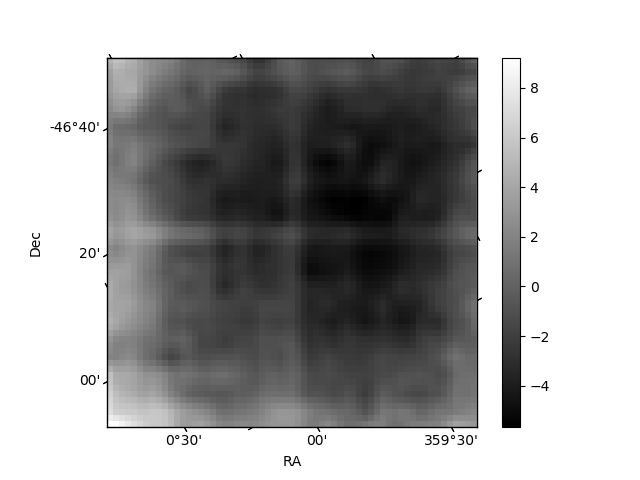
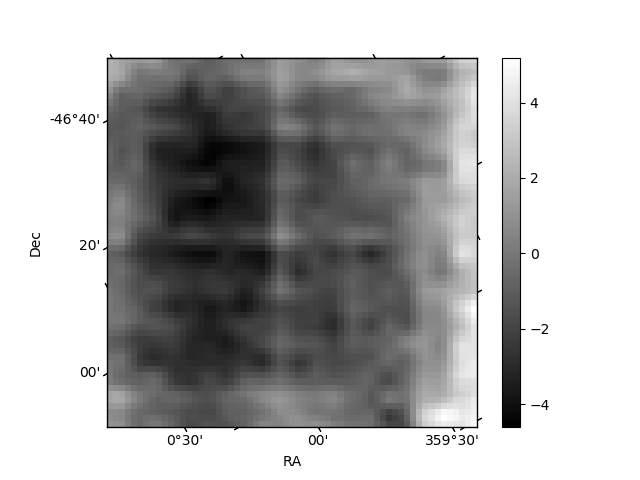
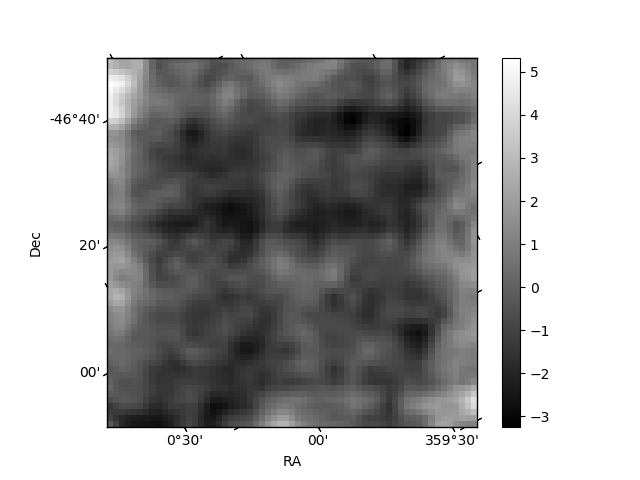
Histogram calculated using DETX and DETY for each event in the final _common_clean file
| Quadrant A | 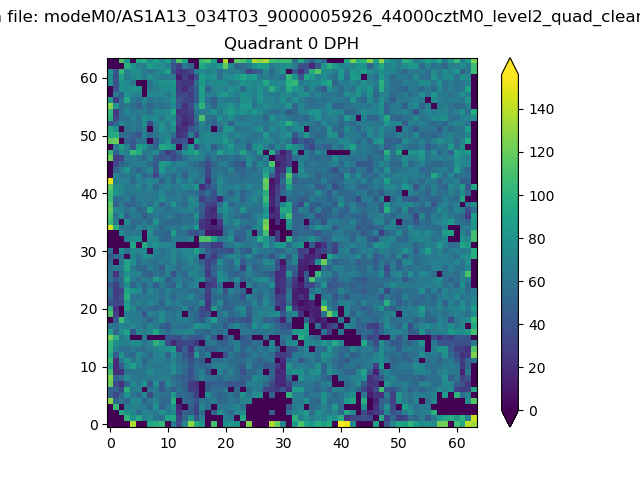 |
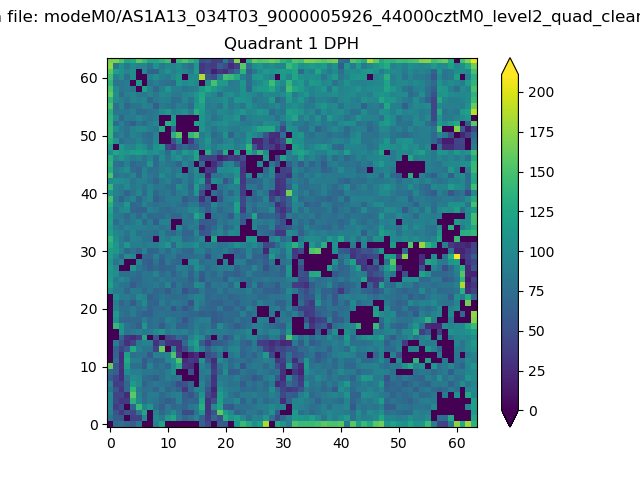 |
Quadrant B |
|---|---|---|---|
| Quadrant D | 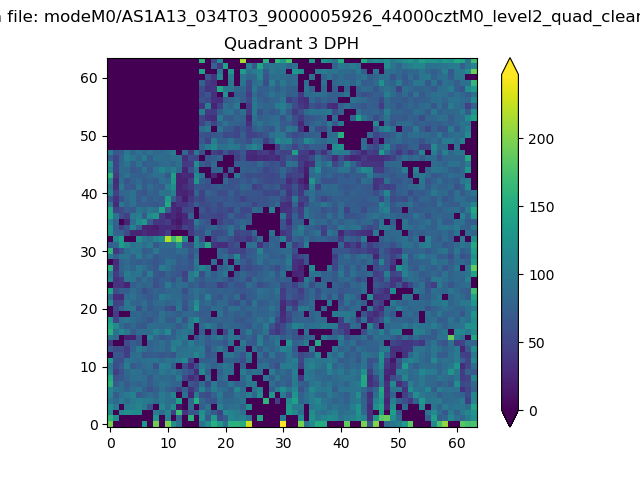 |
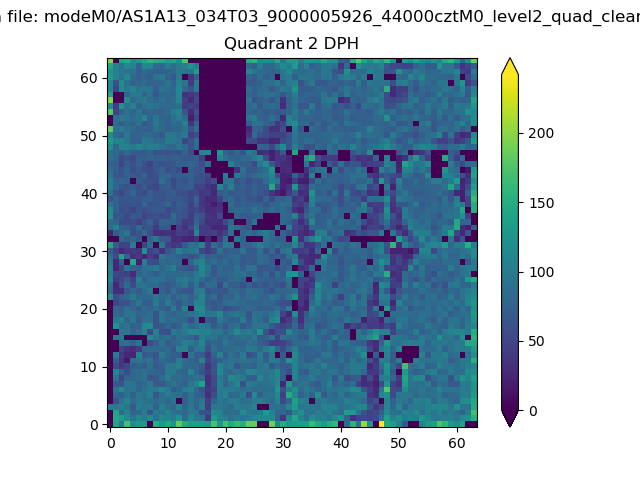 |
Quadrant C |
| Plot type | Count rate plots | Images |
|---|---|---|
| Comparison with Poisson distribution Blue bars denote a histogram of data divided into 1 sec bins. Red curve is a Poisson curve with rate = median count rate of data. |
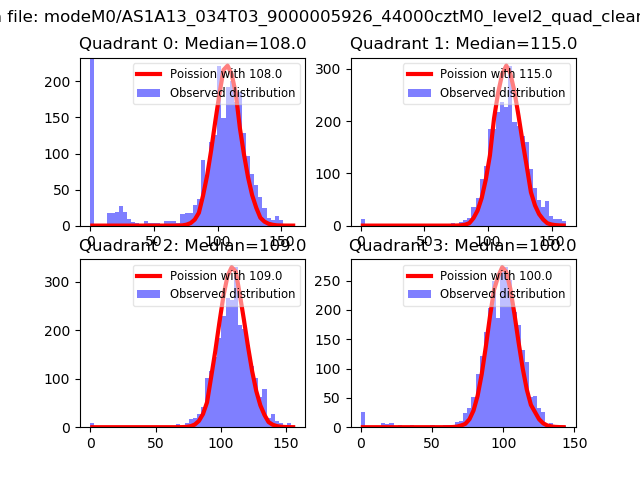 |
 |
| Quadrant-wise count rates Data is divided into 100 sec bins |
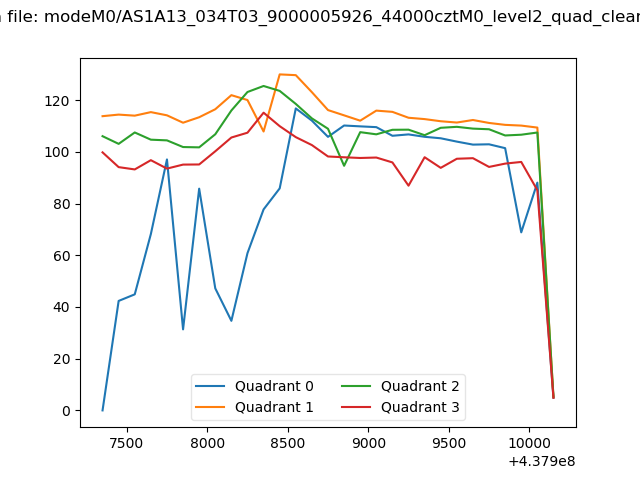 |
|
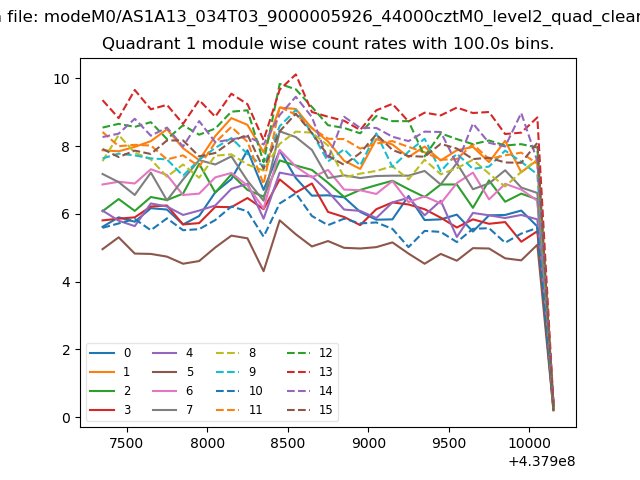
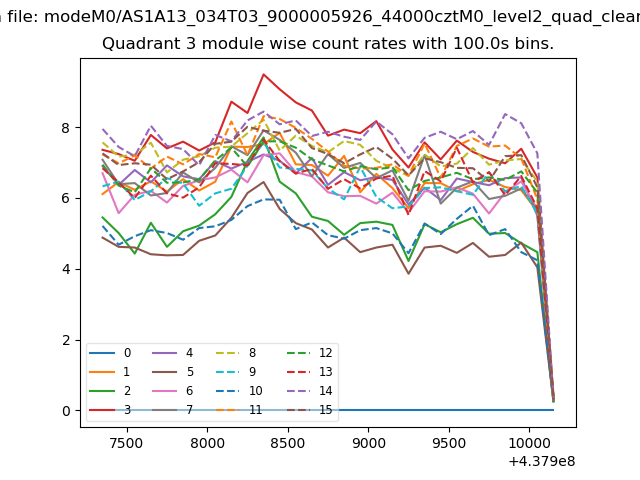
| Module-wise count rates for Quadrant A Data is divided into 100 sec bins |
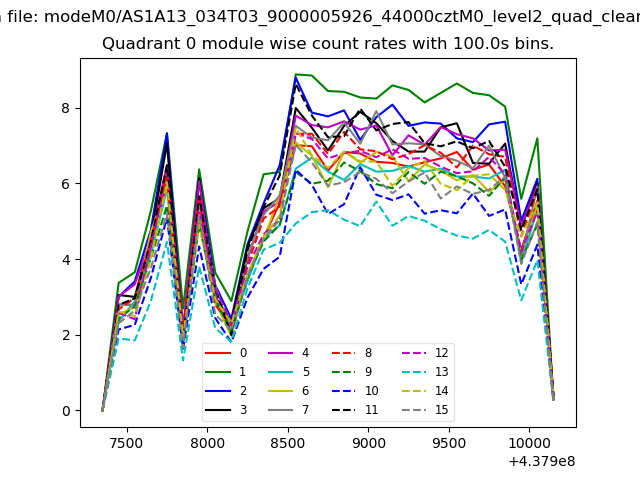 |
 |
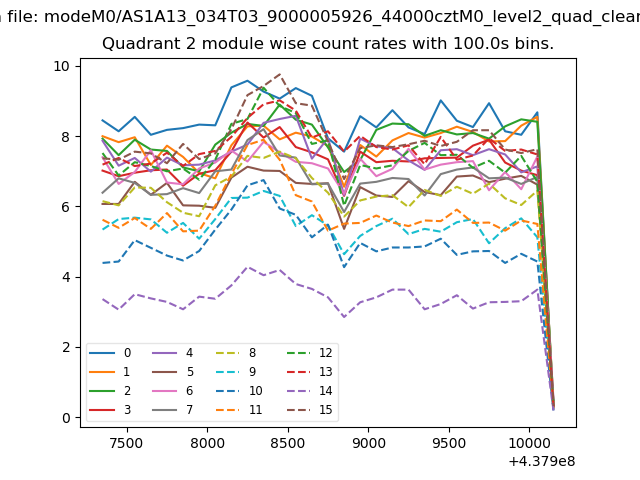
| Module-wise count rates for Quadrant B Data is divided into 100 sec bins |
 |
 |
| Module-wise count rates for Quadrant C Data is divided into 100 sec bins |
 |
 |
| Module-wise count rates for Quadrant D Data is divided into 100 sec bins |
 |
 |
| Parameter | Plot |
|---|---|
| CZT HV Monitor | 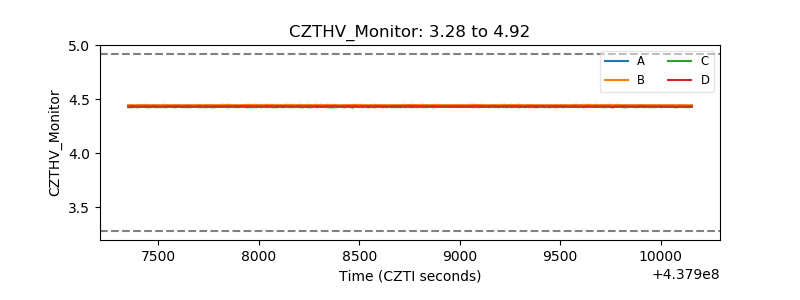 |
| D_VDD | 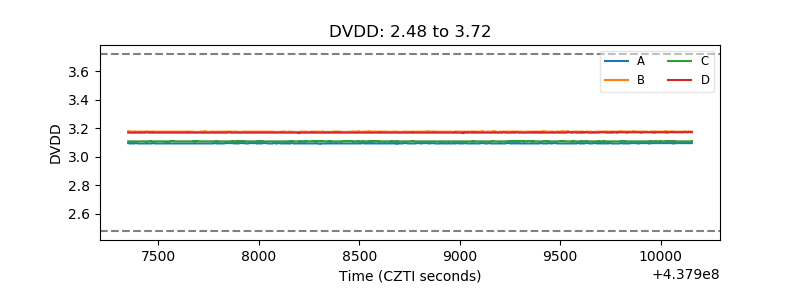 |
| Temperature 1 | 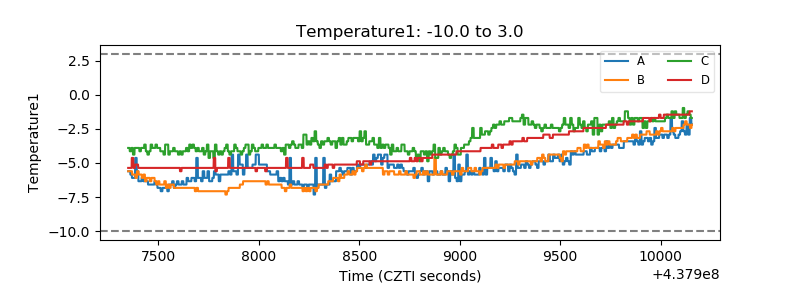 |
| Veto HV Monitor | 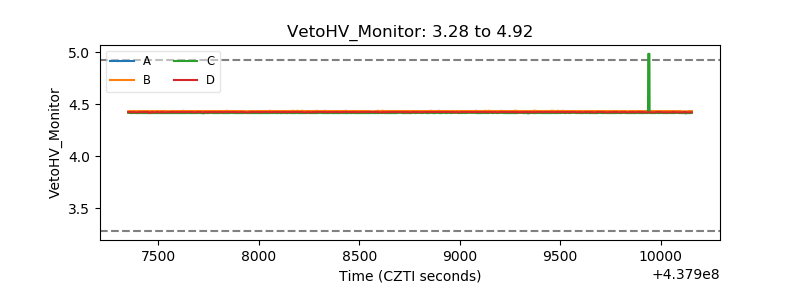 |
| Veto LLD | 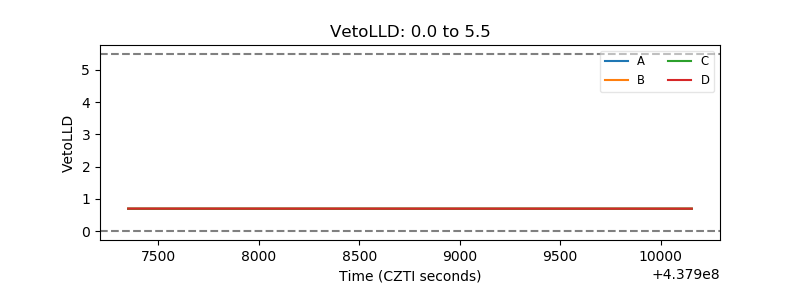 |
| Alpha Counter | 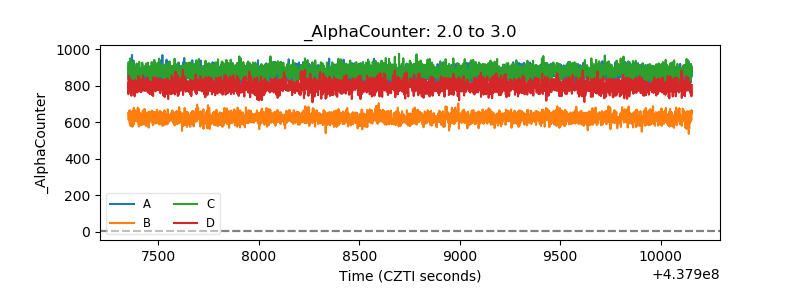 |
| _CPM_Rate |  |
| CZT Counter | 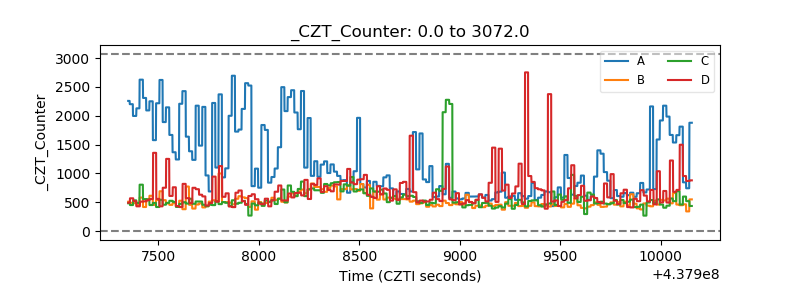 |
| +2.5 Volts monitor | 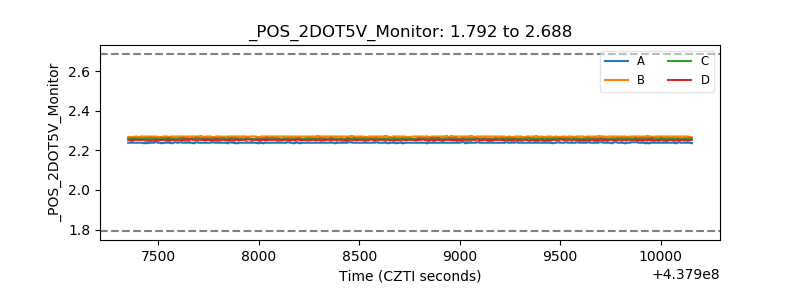 |
| +5 Volts monitor | 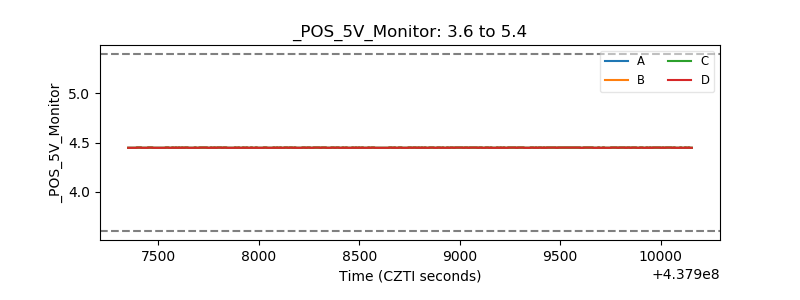 |
| _ROLL_ROT | 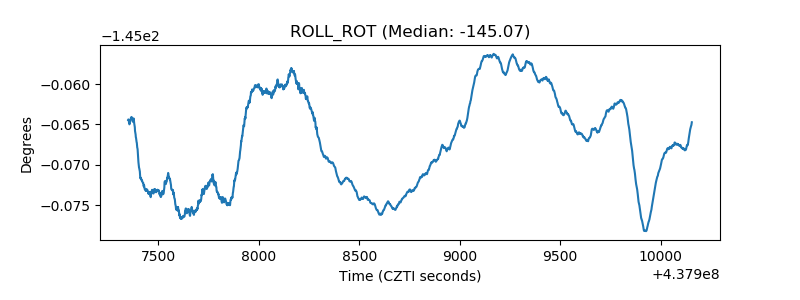 |
| _Roll_DEC | 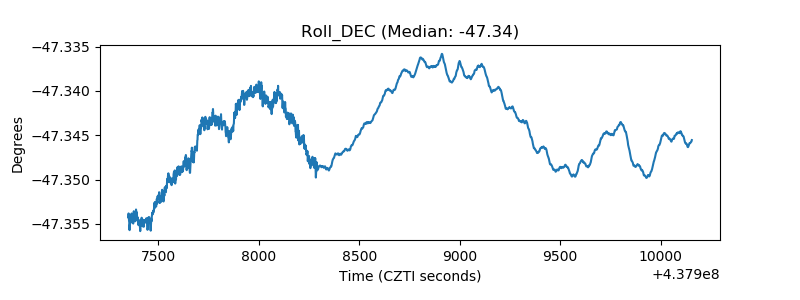 |
| _Roll_RA | 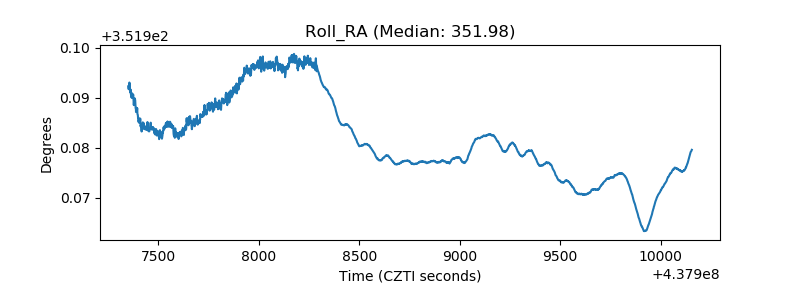 |
| Veto Counter | 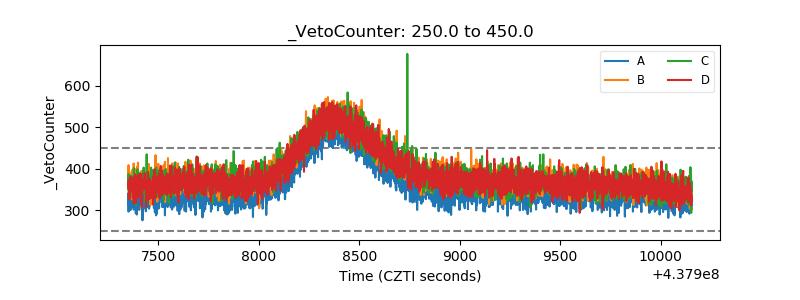 |