| Param | Original file | Final file |
|---|---|---|
| Filename | modeM0/AS1A13_034T03_9000005926_44001cztM0_level2.fits | modeM0/AS1A13_034T03_9000005926_44001cztM0_level2_quad_clean.evt |
| Size (bytes) | 618,333,120 | 125,472,960 |
| Size | 589.7 MB | 119.7 MB |
| Events in quadrant A | 7,349,959 | 782,969 |
| Events in quadrant B | 3,904,344 | 885,157 |
| Events in quadrant C | 4,600,317 | 848,121 |
| Events in quadrant D | 6,415,103 | 727,602 |
| Mode SS | |||
|---|---|---|---|
| Quadrant | BADHDUFLAG | Total packets | Discarded packets |
| A | 0 | 160 | 0 |
| B | 0 | 160 | 0 |
| C | 0 | 160 | 0 |
| D | 0 | 160 | 0 |
| Mode M0 | |||
|---|---|---|---|
| Quadrant | BADHDUFLAG | Total packets | Discarded packets |
| A | 0 | 27619 | 0 |
| B | 0 | 17033 | 0 |
| C | 0 | 18731 | 6 |
| D | 0 | 24451 | 0 |
| Quadrant | Total seconds | Saturated seconds | Saturation percentage |
|---|---|---|---|
| A | 7983 | 881 | 11.035951% |
| B | 7983 | 135 | 1.691094% |
| C | 7982 | 87 | 1.089952% |
| D | 7984 | 602 | 7.540080% |
Noise dominated data is calculated using 1-second bins in cleaned event files. If a bin has >2000 counts, and if more than 50% of those come from <1% of pixels, then it is considered to be noise-dominated and hence unusable.
| Quadrant | # 1 sec bins | Bins with >0 counts | Bins with >2000 counts | High rate bins dominated by noise | Noise dominated (total time) | Noise dominated (detector-on time) | Marked lightcurve |
|---|---|---|---|---|---|---|---|
| A | 7983 | 7983 | 548 | 548 | 6.86% | 6.86% | 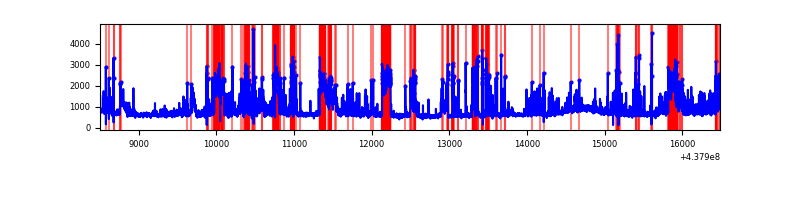 |
| B | 7983 | 7983 | 16 | 16 | 0.20% | 0.20% | 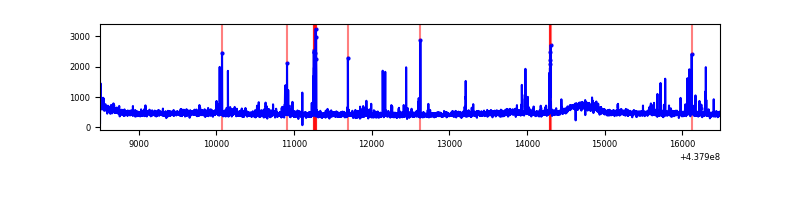 |
| C | 7984 | 7983 | 34 | 34 | 0.43% | 0.43% | 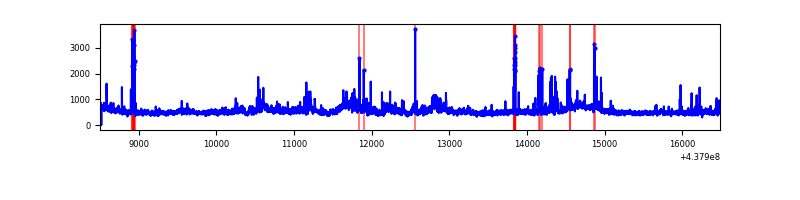 |
| D | 7984 | 7984 | 460 | 460 | 5.76% | 5.76% | 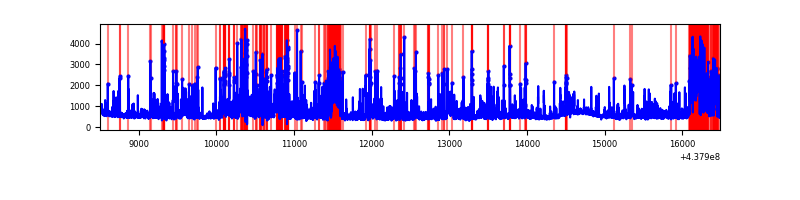 |
Top three noisy pixels from each quadrant. If the there are fewer than three noisy pixels in the level2.evt file, extra rows are filled as -1
| Pixel properties | Quadrant properties | ||||||
|---|---|---|---|---|---|---|---|
| Quadrant | DetID | PixID | Counts | Sigma | Mean | Median | Sigma |
| A | 14 | 238 | 1592503 | 8639.56 | 881 | 860 | 184.2 |
| A | 10 | 83 | 1169825 | 6345.23 | 881 | 860 | 184.2 |
| A | 15 | 223 | 1167044 | 6330.13 | 881 | 860 | 184.2 |
| B | 0 | 213 | 69085 | 378.36 | 913 | 884 | 180.3 |
| B | 4 | 171 | 58425 | 319.22 | 913 | 884 | 180.3 |
| B | 15 | 36 | 43760 | 237.86 | 913 | 884 | 180.3 |
| C | 3 | 233 | 782988 | 3689.18 | 896 | 900 | 212.0 |
| C | 14 | 254 | 179875 | 844.24 | 896 | 900 | 212.0 |
| C | 15 | 157 | 79247 | 369.57 | 896 | 900 | 212.0 |
| D | 1 | 52 | 1007924 | 4586.77 | 875 | 848 | 219.6 |
| D | 5 | 235 | 946037 | 4304.91 | 875 | 848 | 219.6 |
| D | 4 | 221 | 190849 | 865.37 | 875 | 848 | 219.6 |
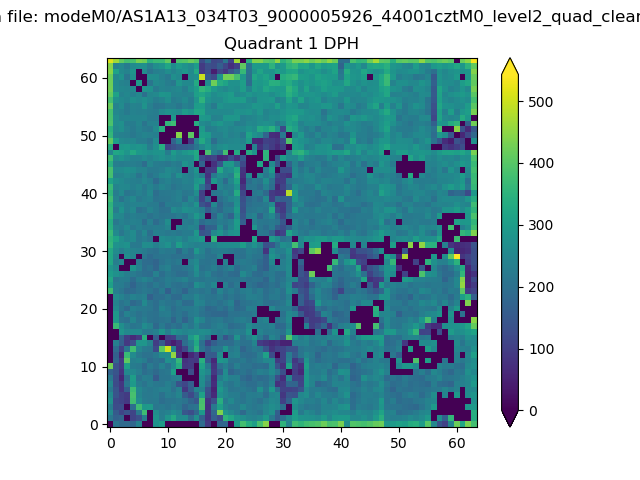
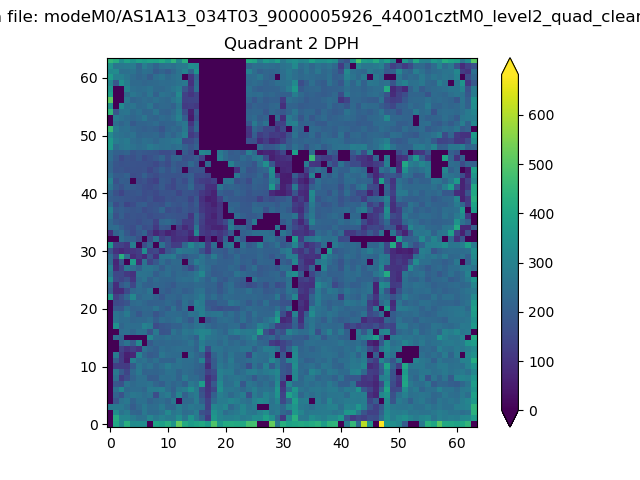
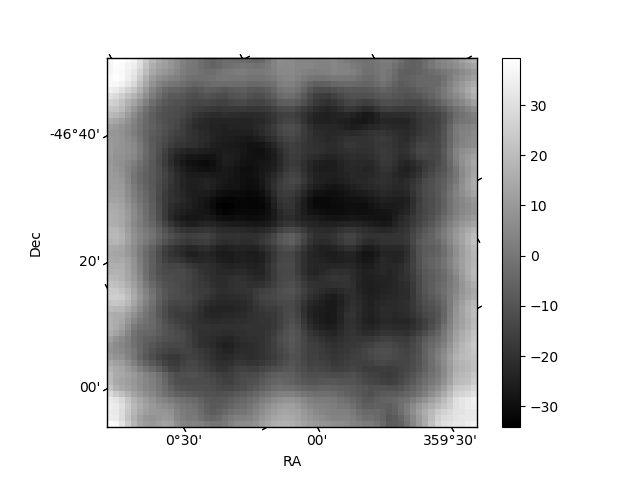
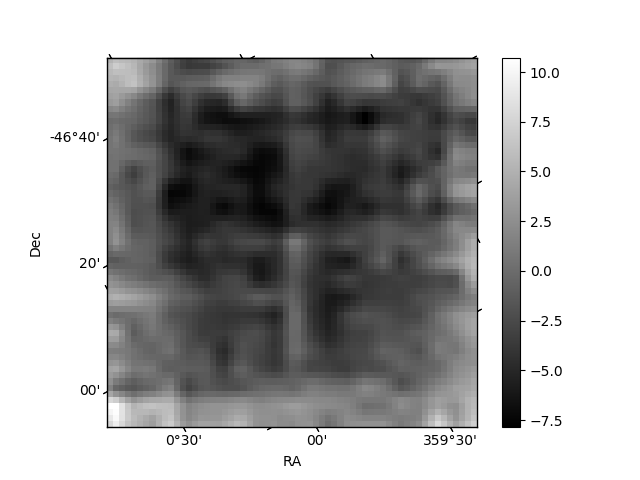
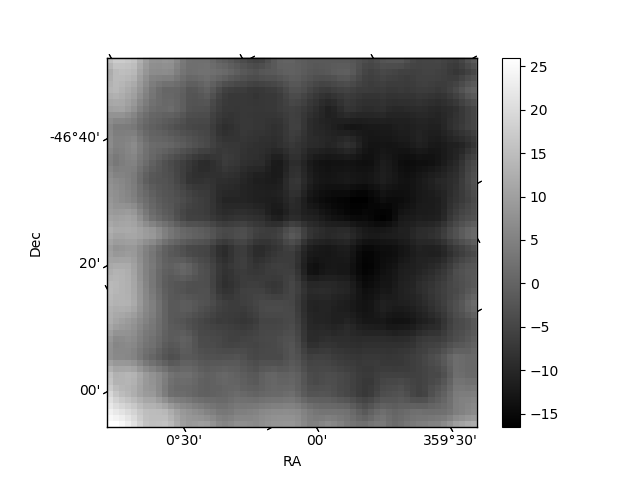
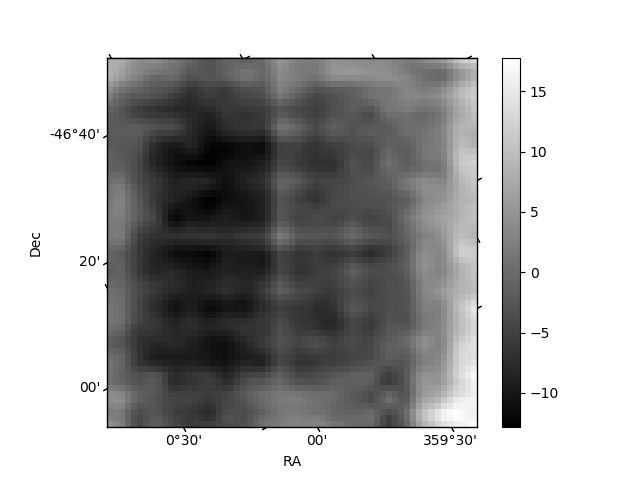
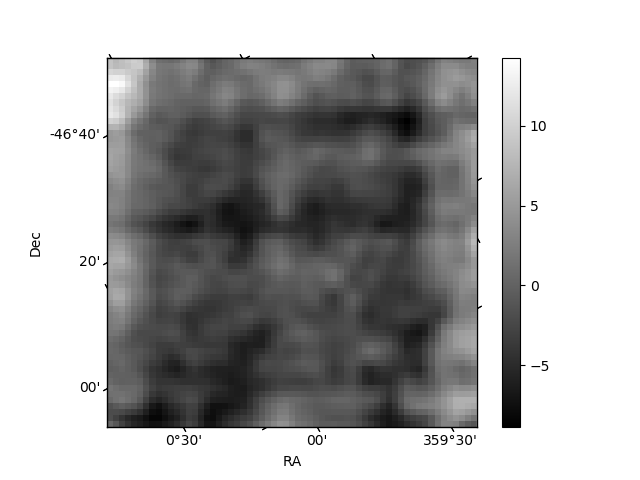
Histogram calculated using DETX and DETY for each event in the final _common_clean file
| Quadrant A | 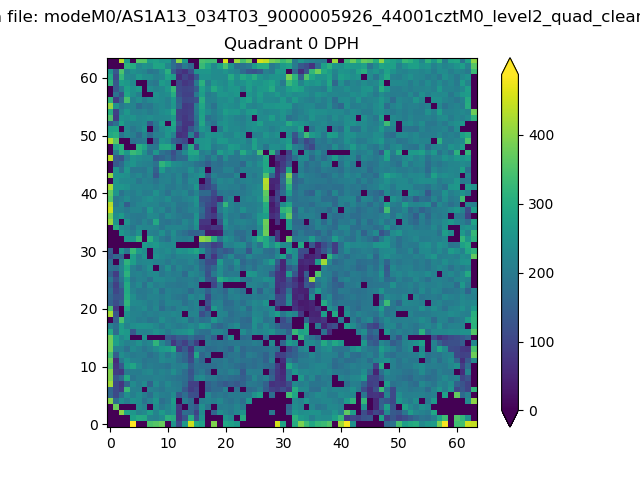 |
 |
Quadrant B |
|---|---|---|---|
| Quadrant D | 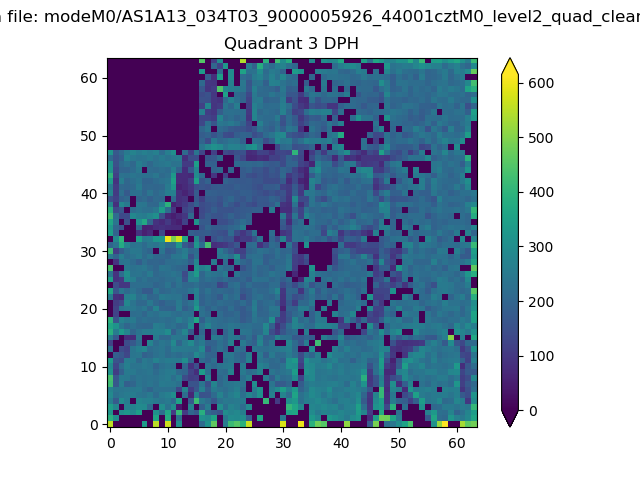 |
 |
Quadrant C |
| Plot type | Count rate plots | Images |
|---|---|---|
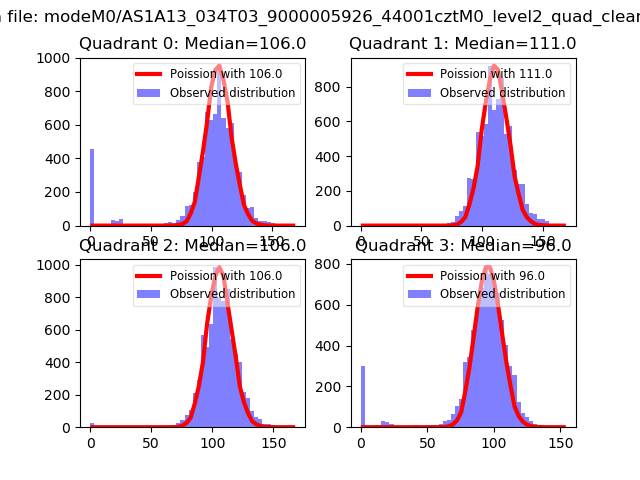
| Comparison with Poisson distribution Blue bars denote a histogram of data divided into 1 sec bins. Red curve is a Poisson curve with rate = median count rate of data. |
 |
 |
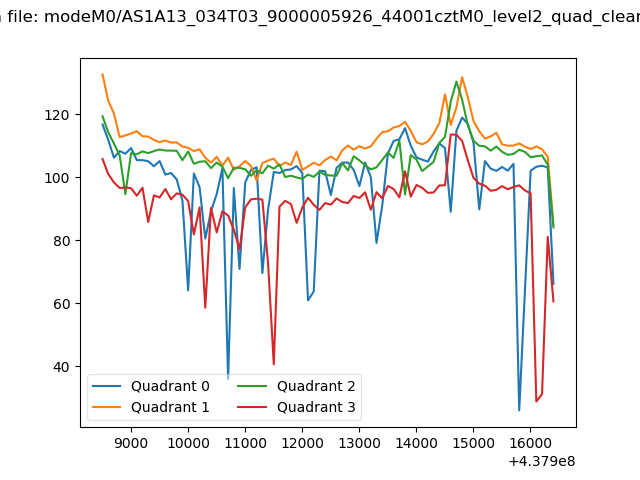
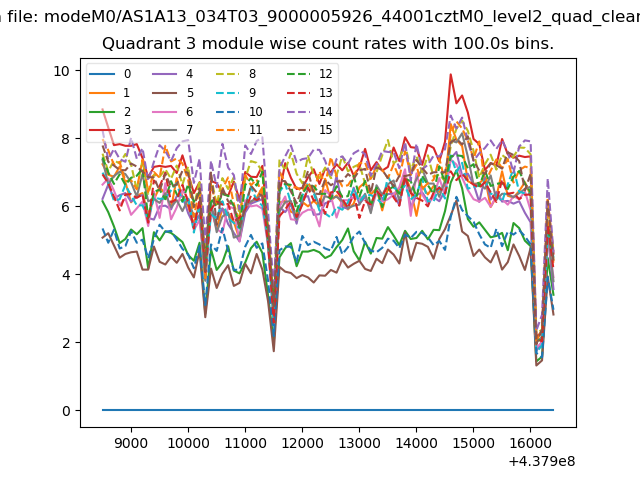
| Quadrant-wise count rates Data is divided into 100 sec bins |
 |
|
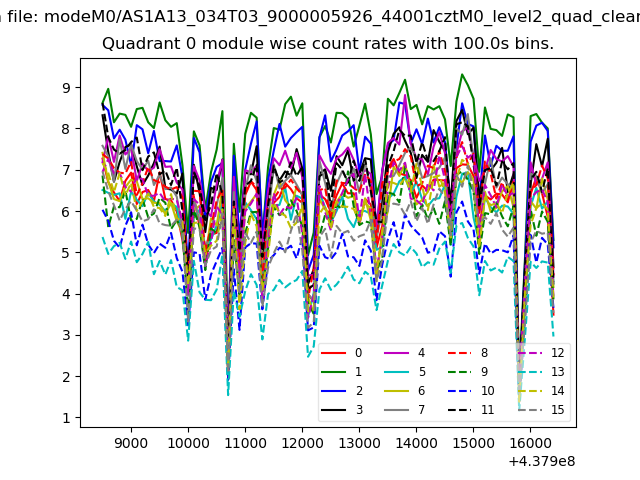
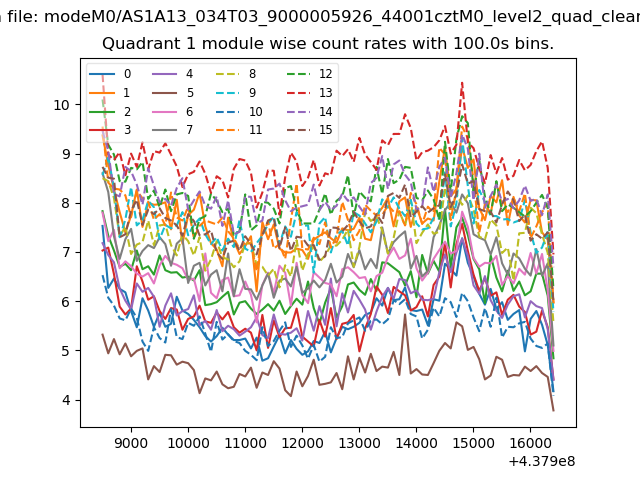
| Module-wise count rates for Quadrant A Data is divided into 100 sec bins |
 |
 |
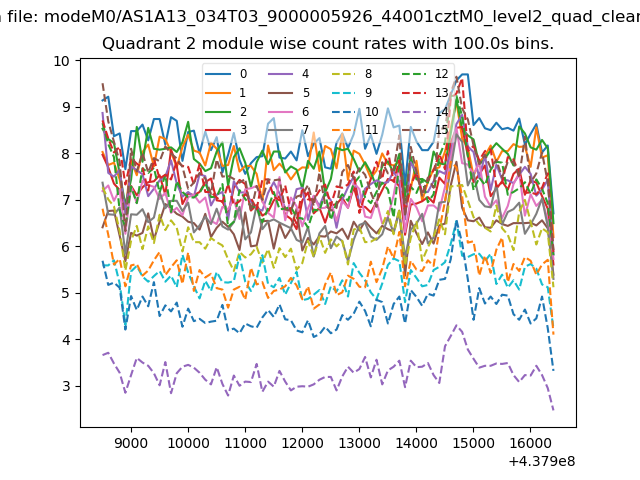
| Module-wise count rates for Quadrant B Data is divided into 100 sec bins |
 |
 |
| Module-wise count rates for Quadrant C Data is divided into 100 sec bins |
 |
 |
| Module-wise count rates for Quadrant D Data is divided into 100 sec bins |
 |
 |
| Parameter | Plot |
|---|---|
| CZT HV Monitor | 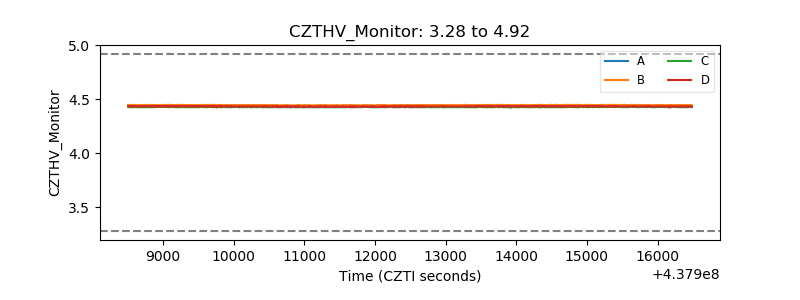 |
| D_VDD | 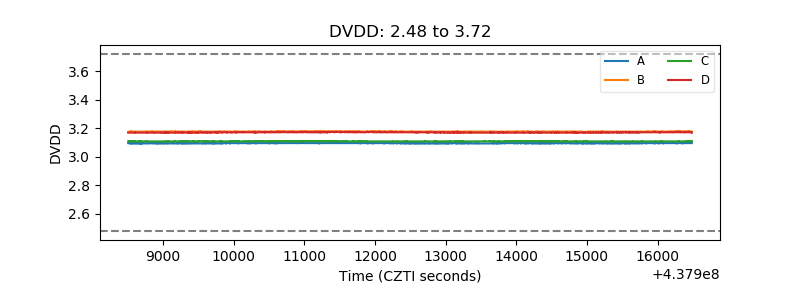 |
| Temperature 1 | 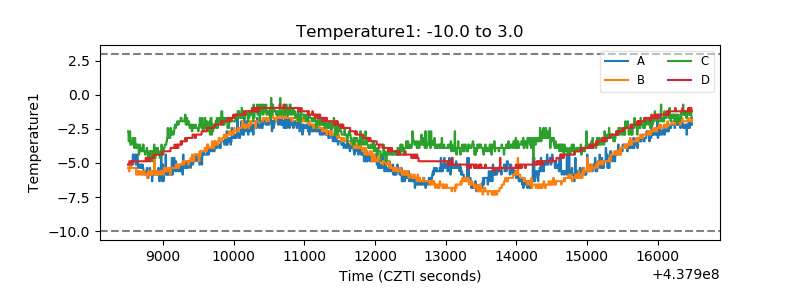 |
| Veto HV Monitor | 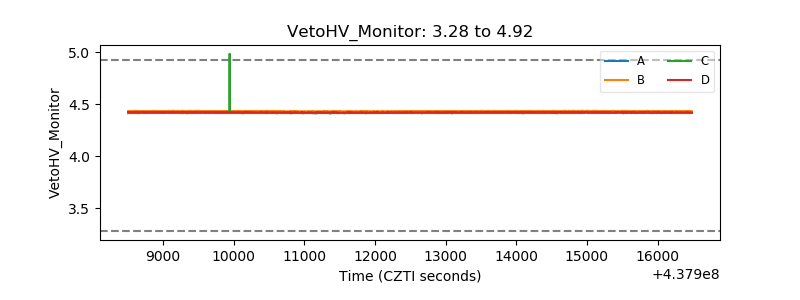 |
| Veto LLD | 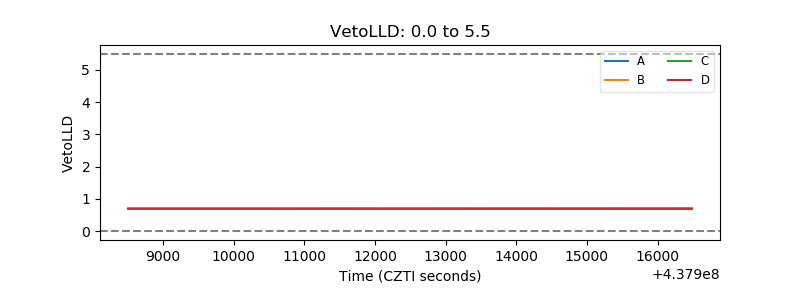 |
| Alpha Counter | 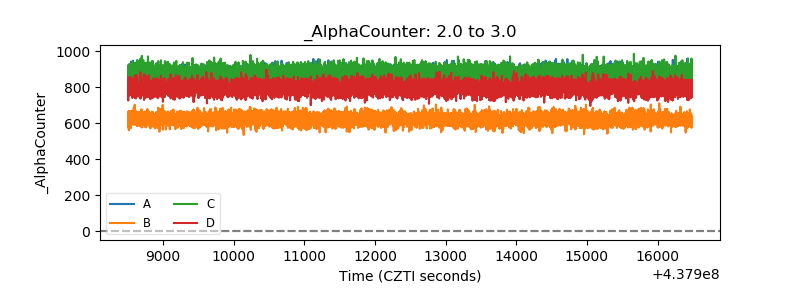 |
| _CPM_Rate | 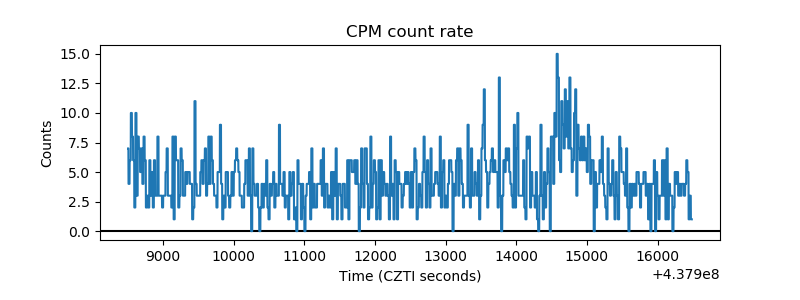 |
| CZT Counter | 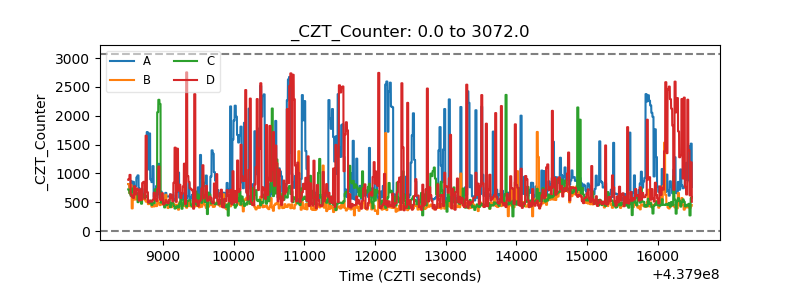 |
| +2.5 Volts monitor | 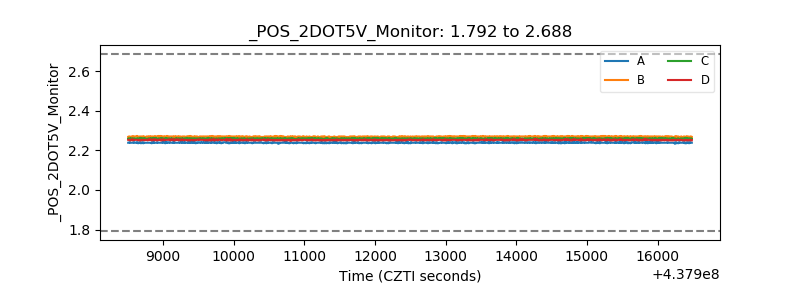 |
| +5 Volts monitor | 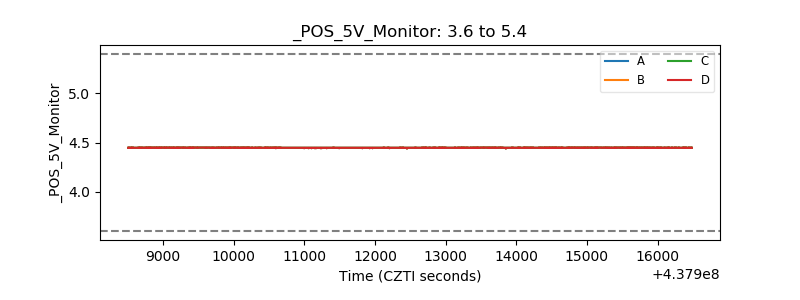 |
| _ROLL_ROT | 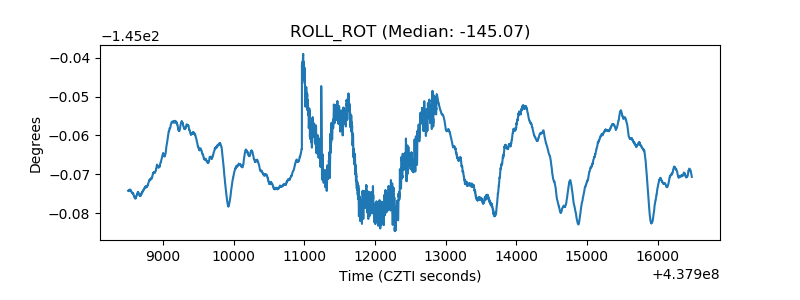 |
| _Roll_DEC | 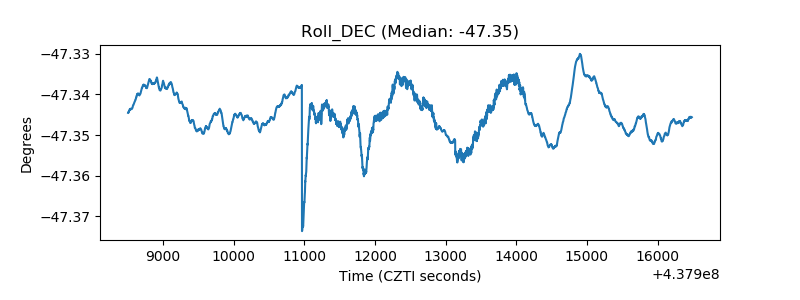 |
| _Roll_RA | 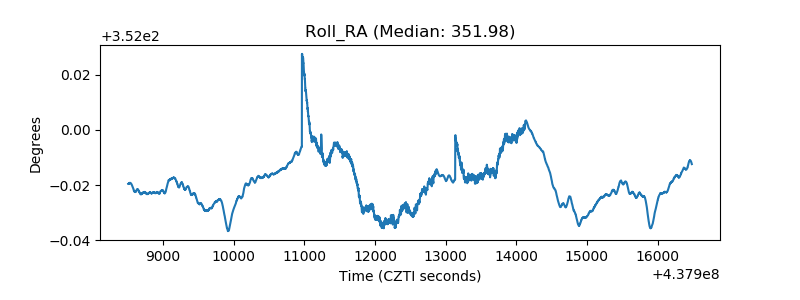 |
| Veto Counter | 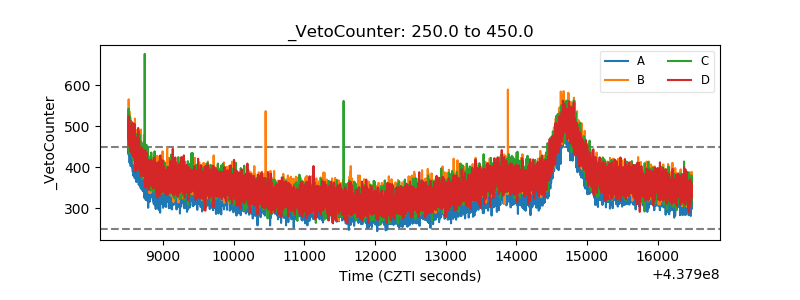 |