| Param | Original file | Final file |
|---|---|---|
| Filename | modeM0/AS1A13_034T05_9000005928_44004cztM0_level2.fits | modeM0/AS1A13_034T05_9000005928_44004cztM0_level2_quad_clean.evt |
| Size (bytes) | 996,422,400 | 238,055,040 |
| Size | 950.3 MB | 227.0 MB |
| Events in quadrant A | 10,489,461 | 1,553,689 |
| Events in quadrant B | 7,392,491 | 1,640,804 |
| Events in quadrant C | 8,228,547 | 1,568,478 |
| Events in quadrant D | 9,596,404 | 1,395,109 |
| Mode M9 | |||
|---|---|---|---|
| Quadrant | BADHDUFLAG | Total packets | Discarded packets |
| A | 0 | 12 | 0 |
| B | 0 | 12 | 0 |
| C | 0 | 12 | 0 |
| D | 0 | 12 | 0 |
| Mode M0 | |||
|---|---|---|---|
| Quadrant | BADHDUFLAG | Total packets | Discarded packets |
| A | 0 | 41875 | 3 |
| B | 0 | 32376 | 3 |
| C | 0 | 34945 | 3 |
| D | 0 | 39045 | 3 |
| Mode SS | |||
|---|---|---|---|
| Quadrant | BADHDUFLAG | Total packets | Discarded packets |
| A | 0 | 312 | 0 |
| B | 0 | 312 | 0 |
| C | 0 | 312 | 0 |
| D | 0 | 312 | 0 |
| Quadrant | Total seconds | Saturated seconds | Saturation percentage |
|---|---|---|---|
| A | 15200 | 779 | 5.125000% |
| B | 15200 | 435 | 2.861842% |
| C | 15200 | 338 | 2.223684% |
| D | 15199 | 796 | 5.237187% |
Noise dominated data is calculated using 1-second bins in cleaned event files. If a bin has >2000 counts, and if more than 50% of those come from <1% of pixels, then it is considered to be noise-dominated and hence unusable.
| Quadrant | # 1 sec bins | Bins with >0 counts | Bins with >2000 counts | High rate bins dominated by noise | Noise dominated (total time) | Noise dominated (detector-on time) | Marked lightcurve |
|---|---|---|---|---|---|---|---|
| A | 16495 | 15203 | 175 | 175 | 1.06% | 1.15% | 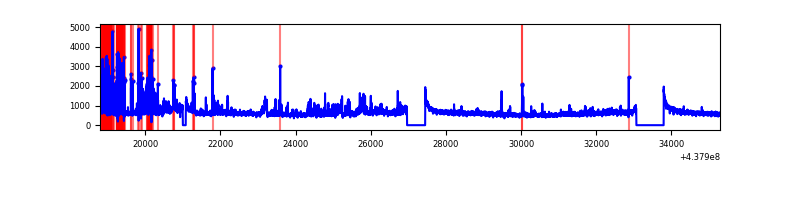 |
| B | 16495 | 15203 | 7 | 7 | 0.04% | 0.05% | 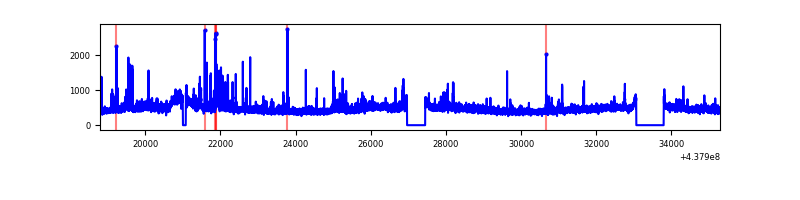 |
| C | 16495 | 15203 | 43 | 43 | 0.26% | 0.28% | 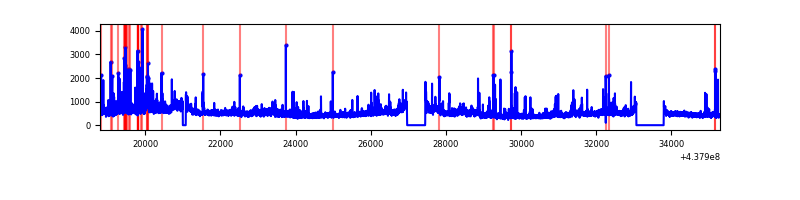 |
| D | 16494 | 15202 | 433 | 433 | 2.63% | 2.85% | 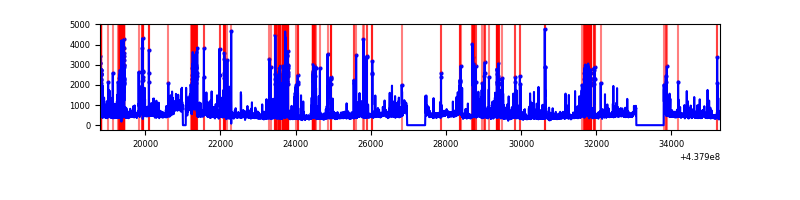 |
Top three noisy pixels from each quadrant. If the there are fewer than three noisy pixels in the level2.evt file, extra rows are filled as -1
| Pixel properties | Quadrant properties | ||||||
|---|---|---|---|---|---|---|---|
| Quadrant | DetID | PixID | Counts | Sigma | Mean | Median | Sigma |
| A | 10 | 83 | 2413960 | 6725.39 | 1726 | 1689 | 358.7 |
| A | 15 | 223 | 613105 | 1704.62 | 1726 | 1689 | 358.7 |
| A | 14 | 238 | 406350 | 1128.19 | 1726 | 1689 | 358.7 |
| B | 0 | 213 | 385738 | 1121.33 | 1737 | 1683 | 342.5 |
| B | 4 | 171 | 46078 | 129.62 | 1737 | 1683 | 342.5 |
| B | 12 | 111 | 45226 | 127.13 | 1737 | 1683 | 342.5 |
| C | 3 | 233 | 1025632 | 2530.37 | 1710 | 1714 | 404.7 |
| C | 14 | 254 | 368919 | 907.46 | 1710 | 1714 | 404.7 |
| C | 15 | 158 | 95952 | 232.89 | 1710 | 1714 | 404.7 |
| D | 1 | 52 | 1332466 | 3139.23 | 1691 | 1636 | 423.9 |
| D | 5 | 222 | 413562 | 971.67 | 1691 | 1636 | 423.9 |
| D | 13 | 249 | 341700 | 802.16 | 1691 | 1636 | 423.9 |
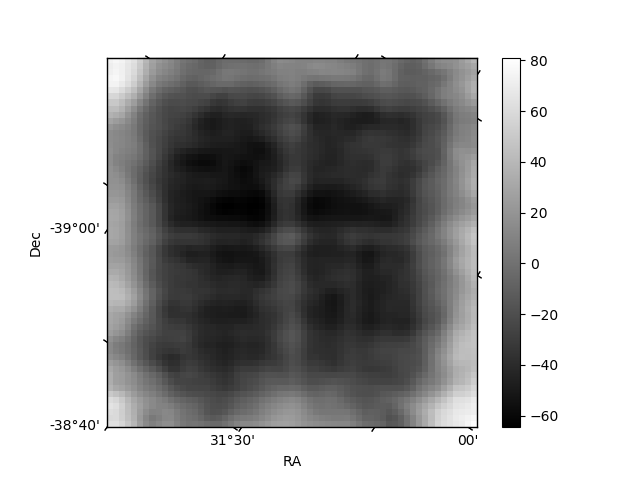
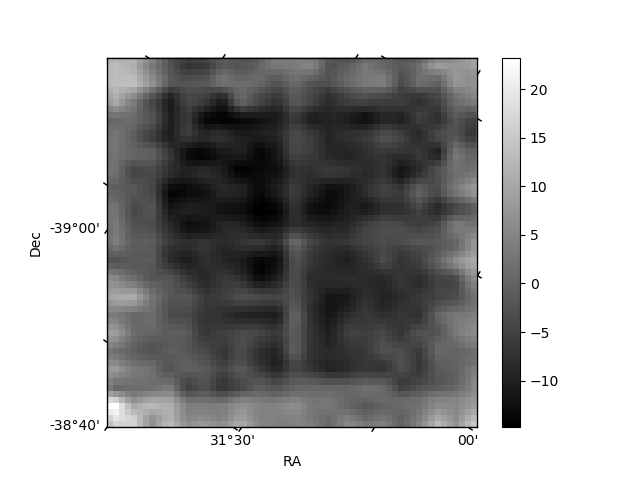
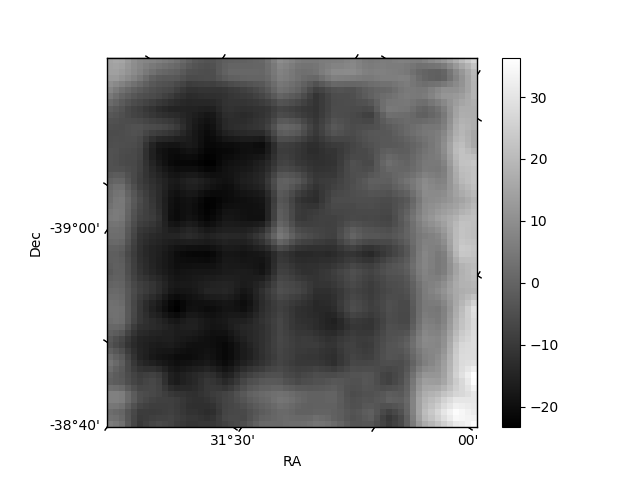
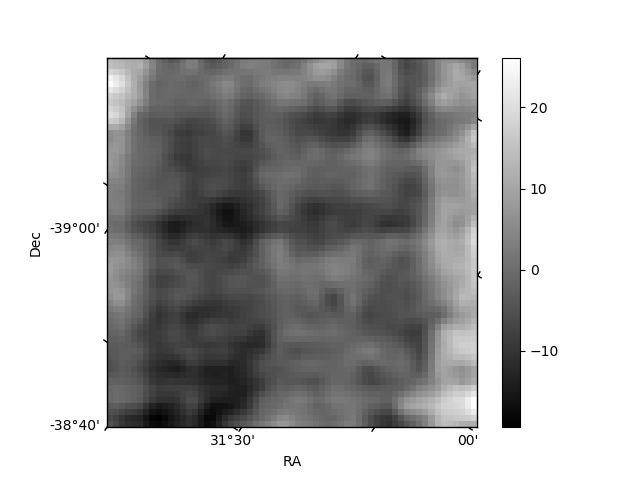
Histogram calculated using DETX and DETY for each event in the final _common_clean file
| Quadrant A | 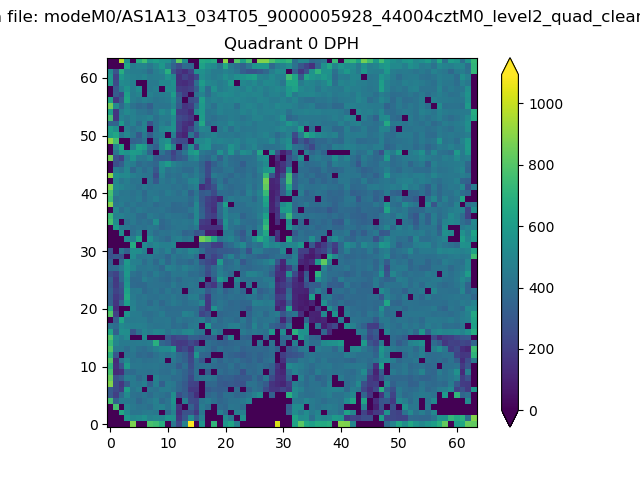 |
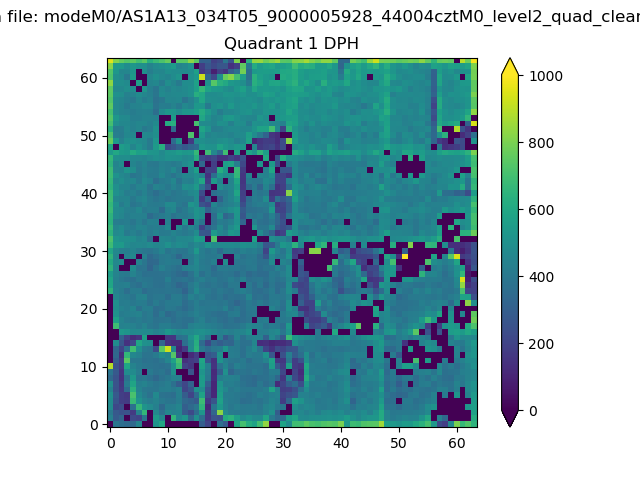 |
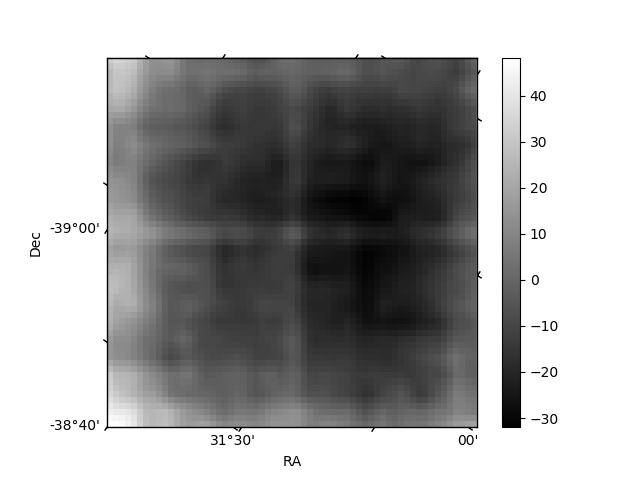
Quadrant B |
|---|---|---|---|
| Quadrant D | 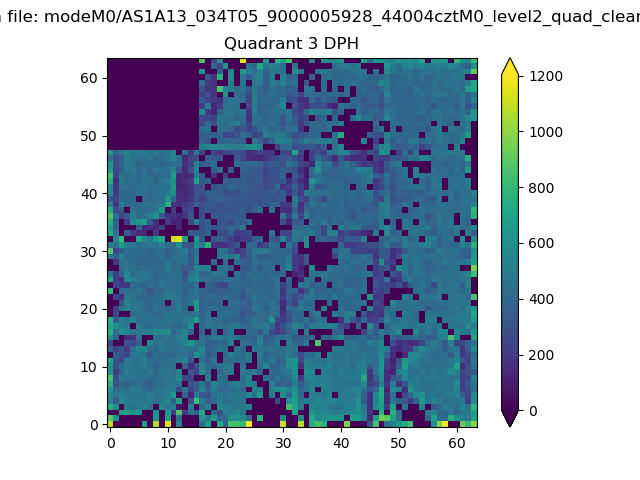 |
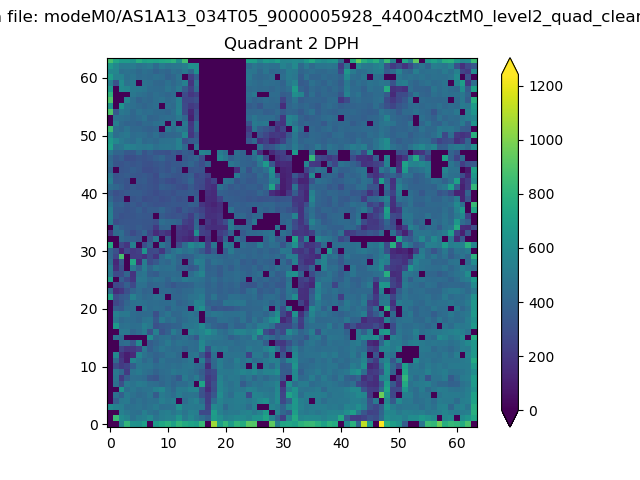 |
Quadrant C |
| Plot type | Count rate plots | Images |
|---|---|---|
| Comparison with Poisson distribution Blue bars denote a histogram of data divided into 1 sec bins. Red curve is a Poisson curve with rate = median count rate of data. |
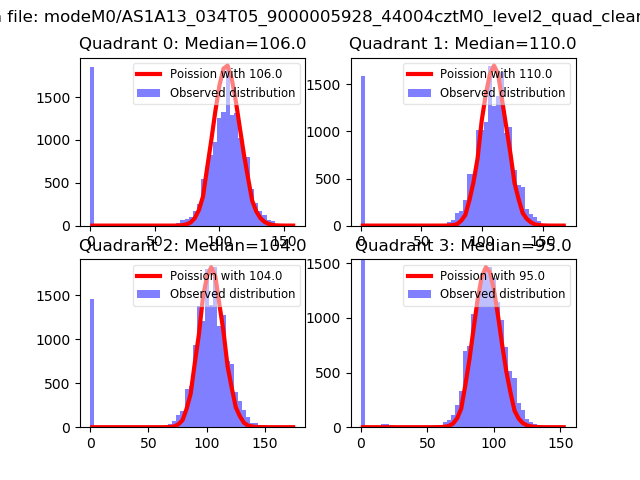 |
 |
| Quadrant-wise count rates Data is divided into 100 sec bins |
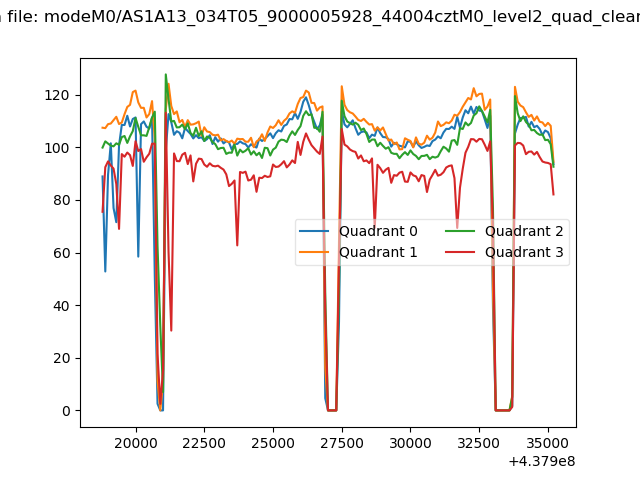 |
|
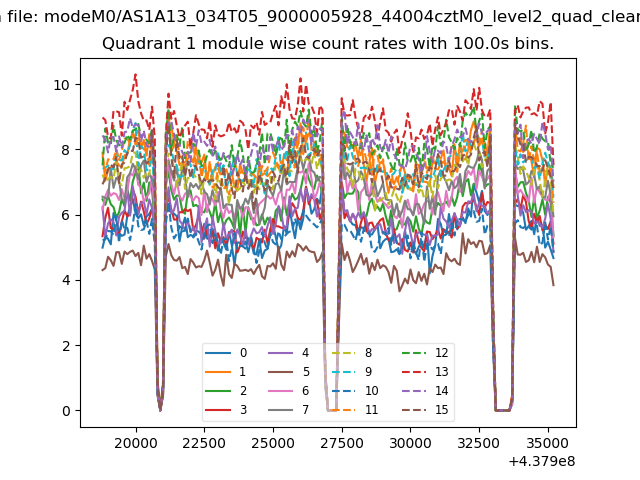
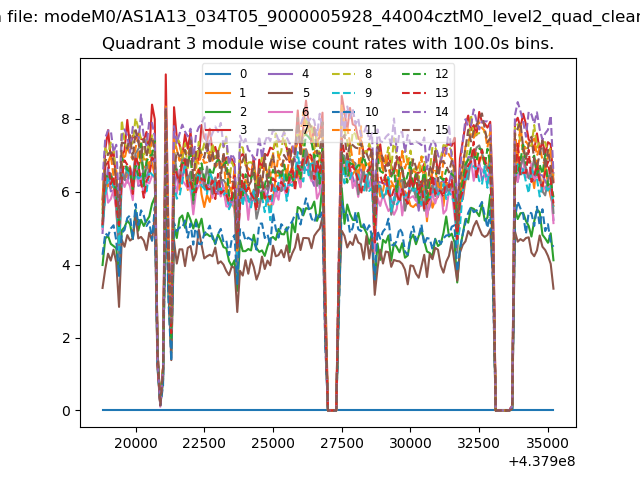
| Module-wise count rates for Quadrant A Data is divided into 100 sec bins |
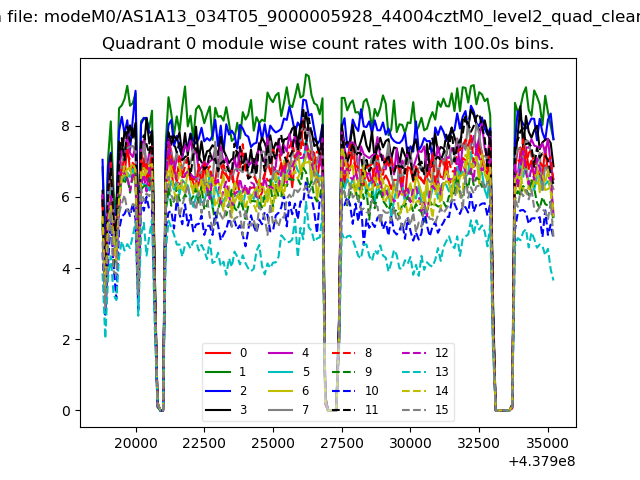 |
 |
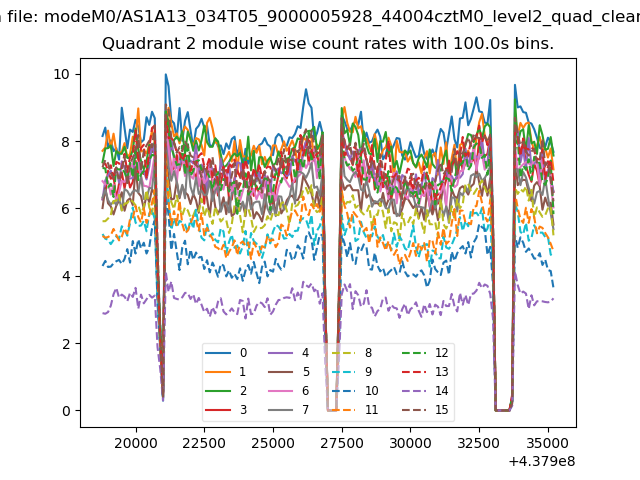
| Module-wise count rates for Quadrant B Data is divided into 100 sec bins |
 |
 |
| Module-wise count rates for Quadrant C Data is divided into 100 sec bins |
 |
 |
| Module-wise count rates for Quadrant D Data is divided into 100 sec bins |
 |
 |
| Parameter | Plot |
|---|---|
| CZT HV Monitor | 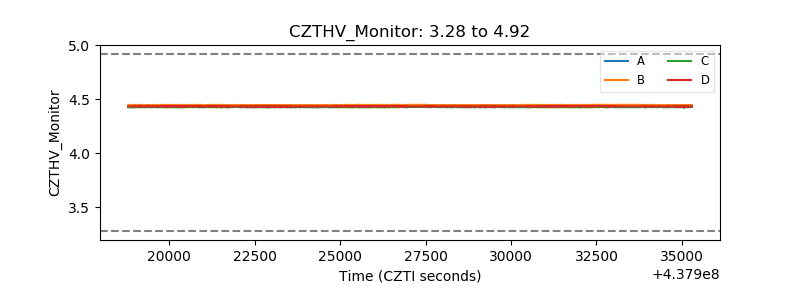 |
| D_VDD | 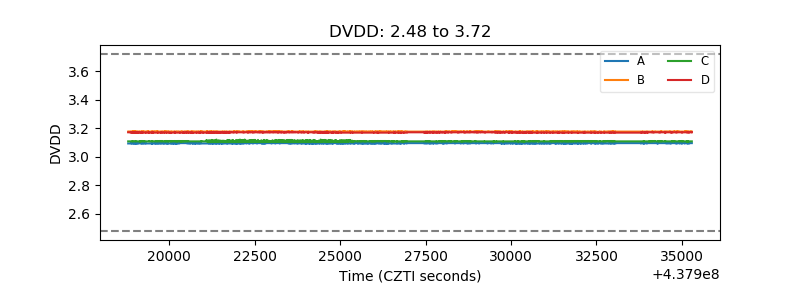 |
| Temperature 1 | 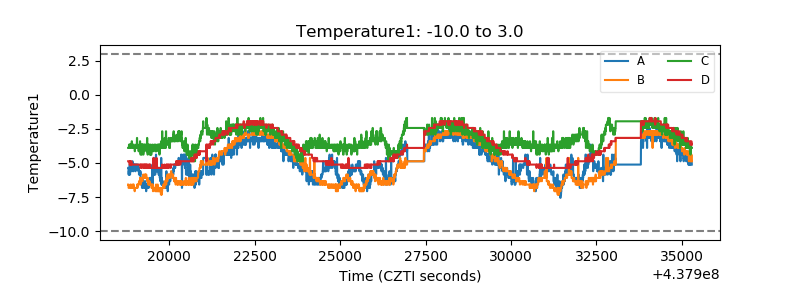 |
| Veto HV Monitor |  |
| Veto LLD | 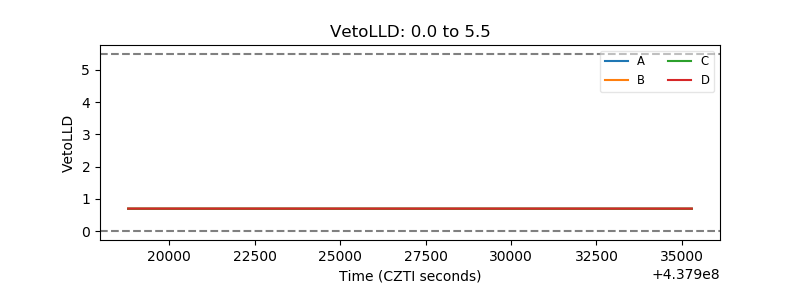 |
| Alpha Counter | 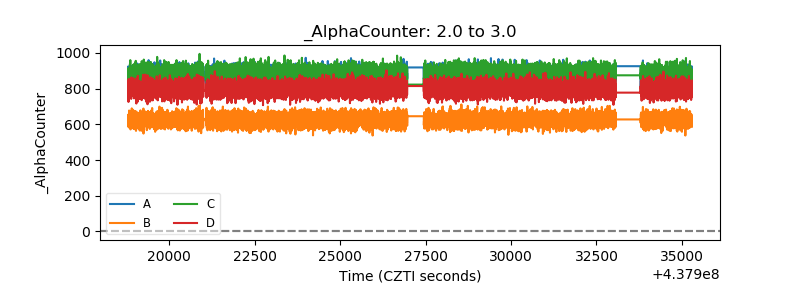 |
| _CPM_Rate | 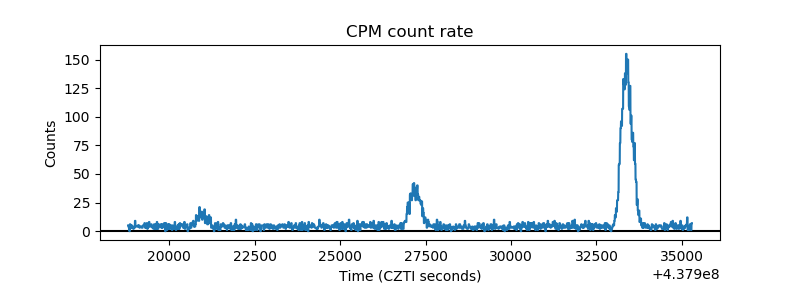 |
| CZT Counter | 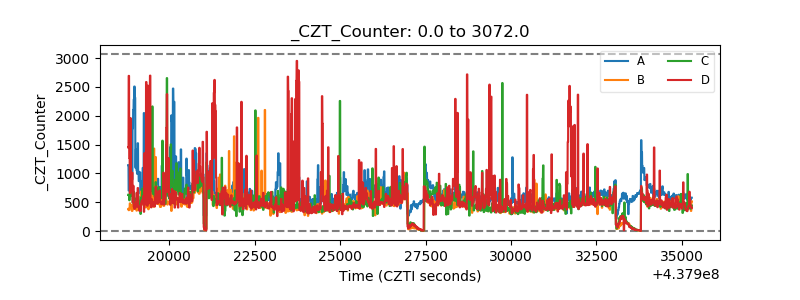 |
| +2.5 Volts monitor | 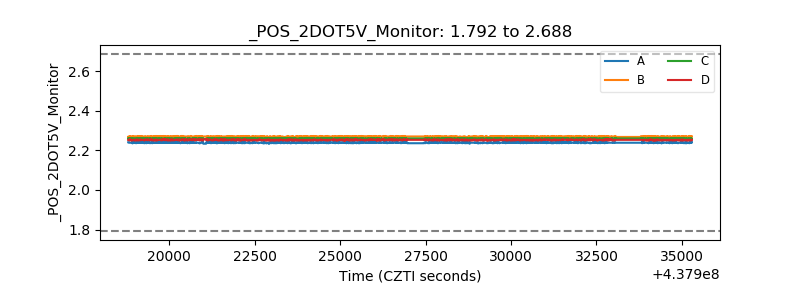 |
| +5 Volts monitor | 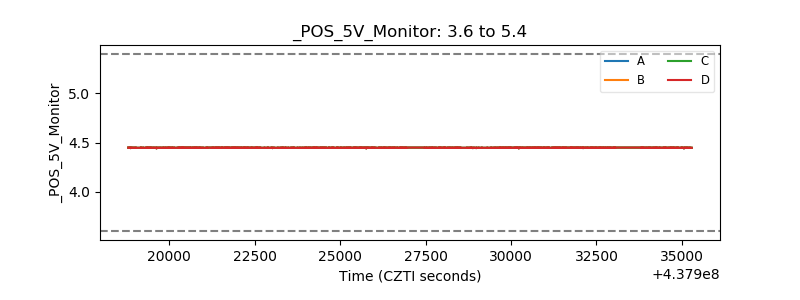 |
| _ROLL_ROT | 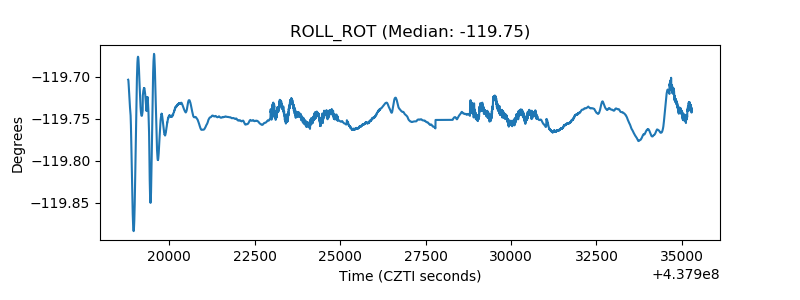 |
| _Roll_DEC | 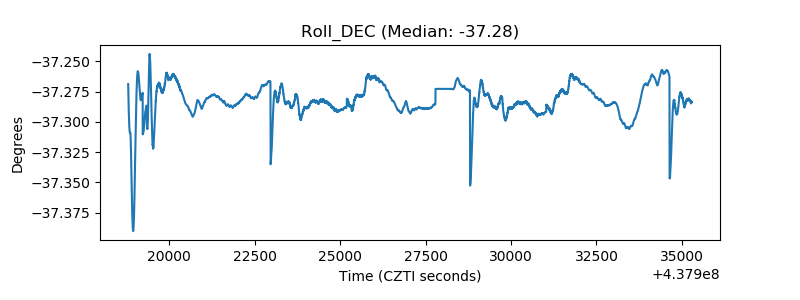 |
| _Roll_RA | 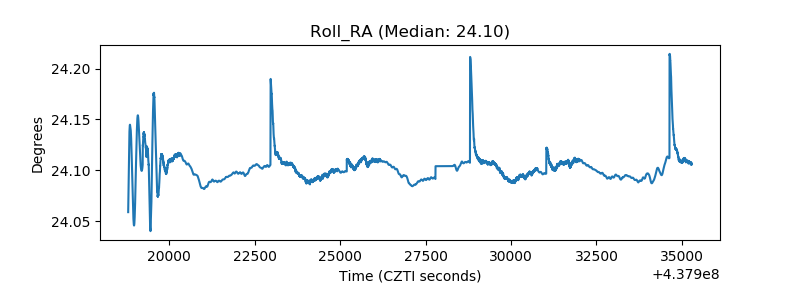 |
| Veto Counter | 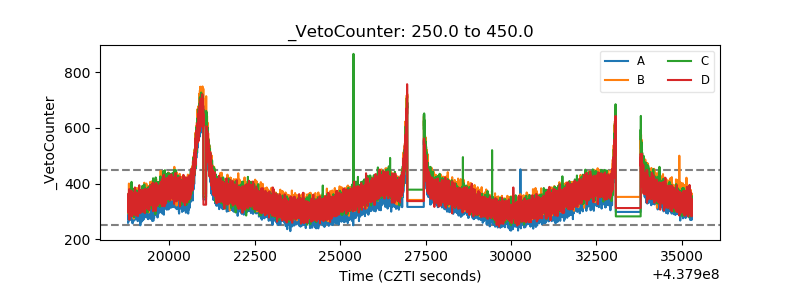 |