| Param | Original file | Final file |
|---|---|---|
| Filename | modeM0/AS1A13_034T05_9000005928_44007cztM0_level2.fits | modeM0/AS1A13_034T05_9000005928_44007cztM0_level2_quad_clean.evt |
| Size (bytes) | 391,236,480 | 97,873,920 |
| Size | 373.1 MB | 93.3 MB |
| Events in quadrant A | 3,832,836 | 659,284 |
| Events in quadrant B | 2,838,098 | 679,794 |
| Events in quadrant C | 2,981,748 | 642,032 |
| Events in quadrant D | 4,353,111 | 554,412 |
| Mode M9 | |||
|---|---|---|---|
| Quadrant | BADHDUFLAG | Total packets | Discarded packets |
| A | 0 | 9 | 0 |
| B | 0 | 9 | 0 |
| C | 0 | 9 | 0 |
| D | 0 | 9 | 0 |
| Mode M0 | |||
|---|---|---|---|
| Quadrant | BADHDUFLAG | Total packets | Discarded packets |
| A | 0 | 15608 | 1 |
| B | 0 | 12637 | 1 |
| C | 0 | 13173 | 1 |
| D | 0 | 17264 | 1 |
| Mode SS | |||
|---|---|---|---|
| Quadrant | BADHDUFLAG | Total packets | Discarded packets |
| A | 0 | 126 | 0 |
| B | 0 | 126 | 0 |
| C | 0 | 126 | 0 |
| D | 0 | 126 | 0 |
| Quadrant | Total seconds | Saturated seconds | Saturation percentage |
|---|---|---|---|
| A | 6124 | 75 | 1.224690% |
| B | 6124 | 40 | 0.653168% |
| C | 6124 | 29 | 0.473547% |
| D | 6125 | 449 | 7.330612% |
Noise dominated data is calculated using 1-second bins in cleaned event files. If a bin has >2000 counts, and if more than 50% of those come from <1% of pixels, then it is considered to be noise-dominated and hence unusable.
| Quadrant | # 1 sec bins | Bins with >0 counts | Bins with >2000 counts | High rate bins dominated by noise | Noise dominated (total time) | Noise dominated (detector-on time) | Marked lightcurve |
|---|---|---|---|---|---|---|---|
| A | 7029 | 6125 | 5 | 5 | 0.07% | 0.08% | 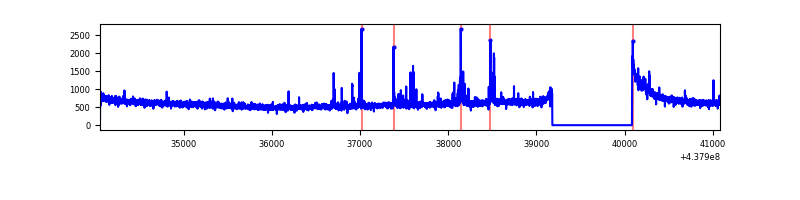 |
| B | 7029 | 6125 | 3 | 3 | 0.04% | 0.05% | 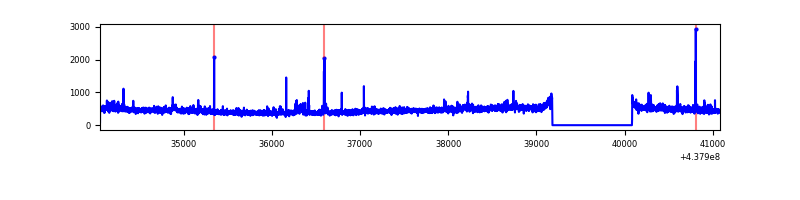 |
| C | 7029 | 6125 | 16 | 16 | 0.23% | 0.26% | 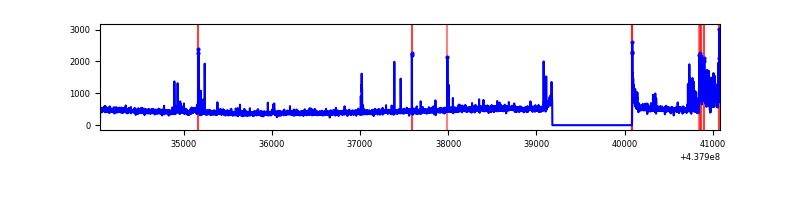 |
| D | 7030 | 6126 | 383 | 383 | 5.45% | 6.25% | 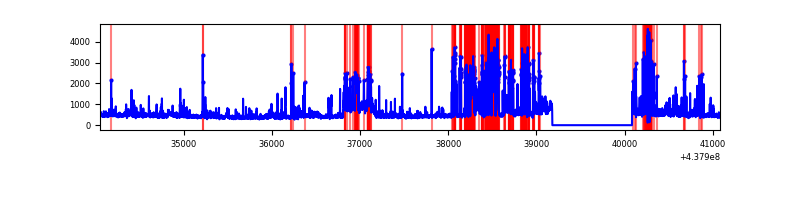 |
Top three noisy pixels from each quadrant. If the there are fewer than three noisy pixels in the level2.evt file, extra rows are filled as -1
| Pixel properties | Quadrant properties | ||||||
|---|---|---|---|---|---|---|---|
| Quadrant | DetID | PixID | Counts | Sigma | Mean | Median | Sigma |
| A | 10 | 83 | 1060342 | 7370.53 | 686 | 671 | 143.8 |
| A | 14 | 238 | 63281 | 435.48 | 686 | 671 | 143.8 |
| A | 15 | 222 | 30343 | 206.38 | 686 | 671 | 143.8 |
| B | 4 | 171 | 49713 | 358.95 | 685 | 665 | 136.6 |
| B | 0 | 213 | 47990 | 346.34 | 685 | 665 | 136.6 |
| B | 12 | 111 | 17757 | 125.08 | 685 | 665 | 136.6 |
| C | 14 | 254 | 229359 | 1438.57 | 665 | 668 | 159.0 |
| C | 3 | 233 | 128203 | 802.25 | 665 | 668 | 159.0 |
| C | 15 | 1 | 28175 | 173.03 | 665 | 668 | 159.0 |
| D | 1 | 52 | 1277450 | 7861.97 | 642 | 621 | 162.4 |
| D | 5 | 222 | 330881 | 2033.55 | 642 | 621 | 162.4 |
| D | 12 | 233 | 74576 | 455.37 | 642 | 621 | 162.4 |
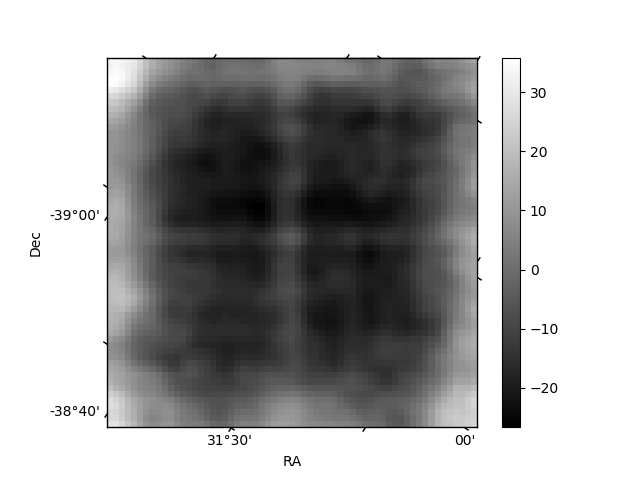
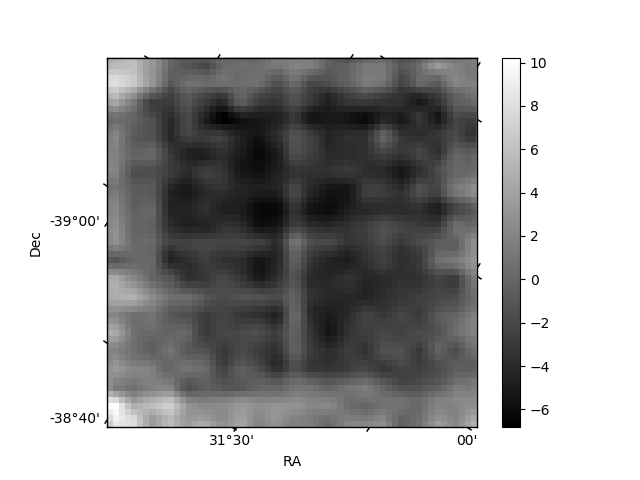
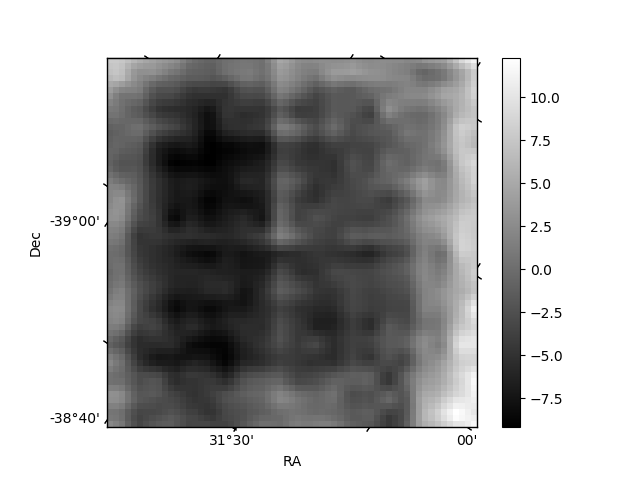
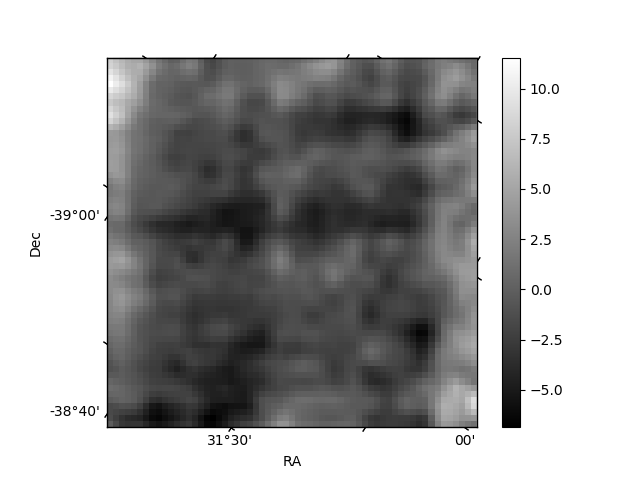
Histogram calculated using DETX and DETY for each event in the final _common_clean file
| Quadrant A | 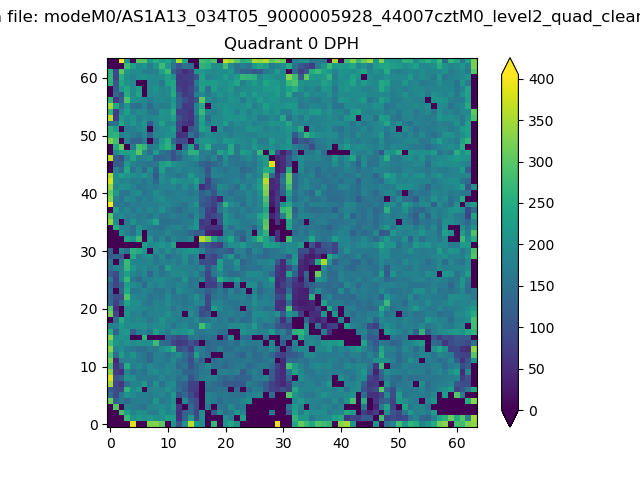 |
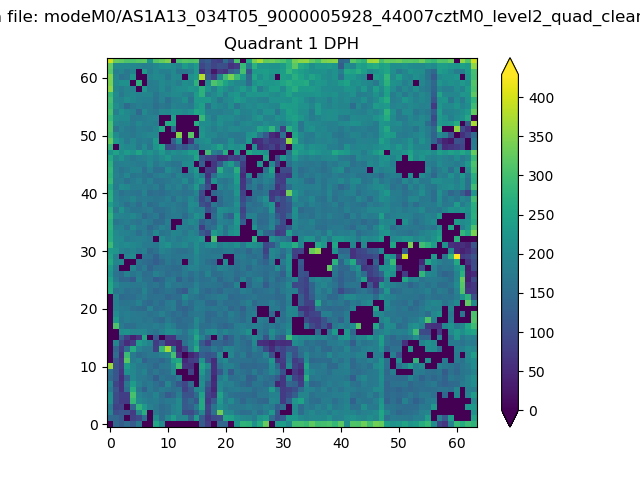 |
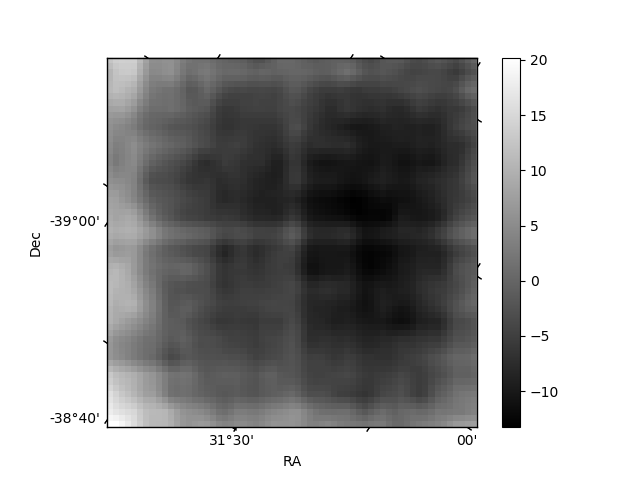
Quadrant B |
|---|---|---|---|
| Quadrant D | 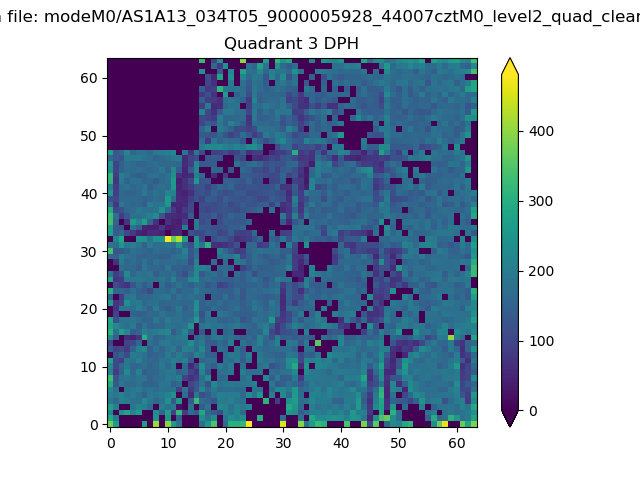 |
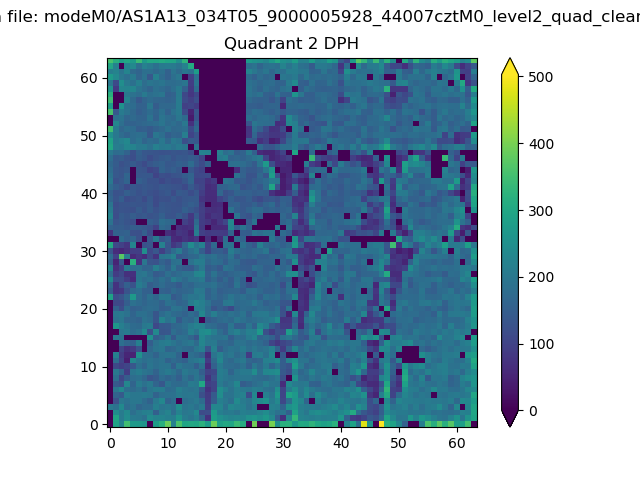 |
Quadrant C |
| Plot type | Count rate plots | Images |
|---|---|---|
| Comparison with Poisson distribution Blue bars denote a histogram of data divided into 1 sec bins. Red curve is a Poisson curve with rate = median count rate of data. |
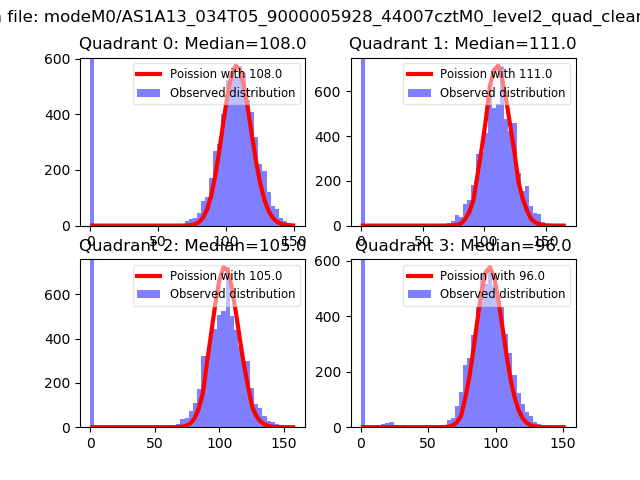 |
 |
| Quadrant-wise count rates Data is divided into 100 sec bins |
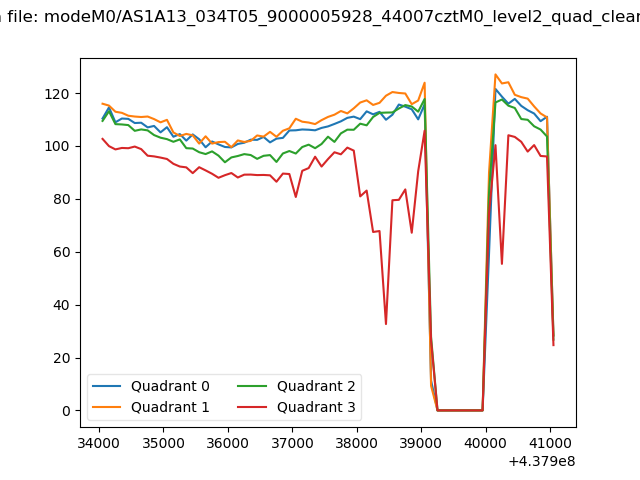 |
|
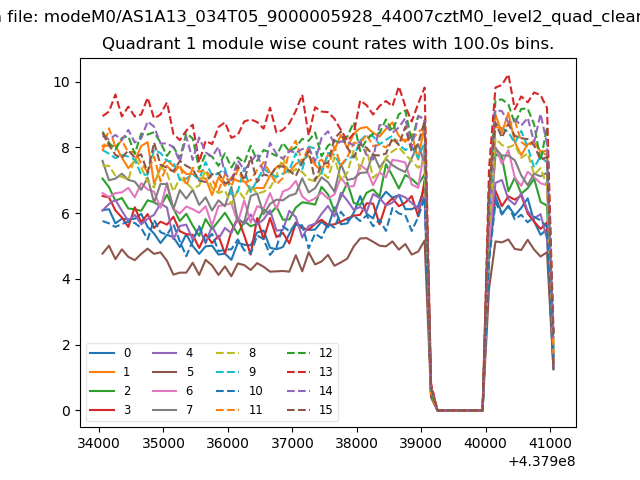
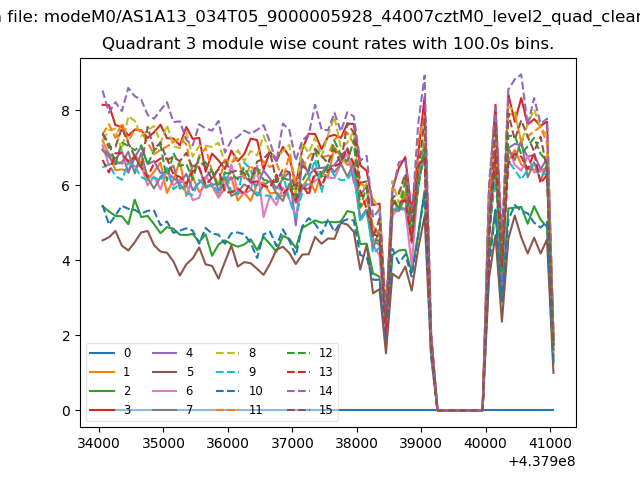
| Module-wise count rates for Quadrant A Data is divided into 100 sec bins |
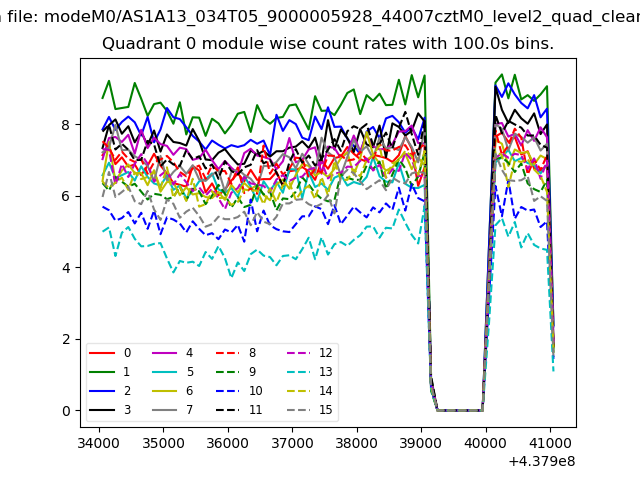 |
 |
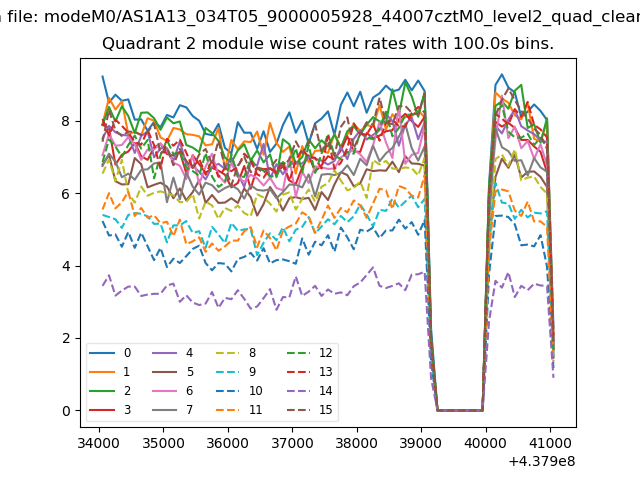
| Module-wise count rates for Quadrant B Data is divided into 100 sec bins |
 |
 |
| Module-wise count rates for Quadrant C Data is divided into 100 sec bins |
 |
 |
| Module-wise count rates for Quadrant D Data is divided into 100 sec bins |
 |
 |
| Parameter | Plot |
|---|---|
| CZT HV Monitor | 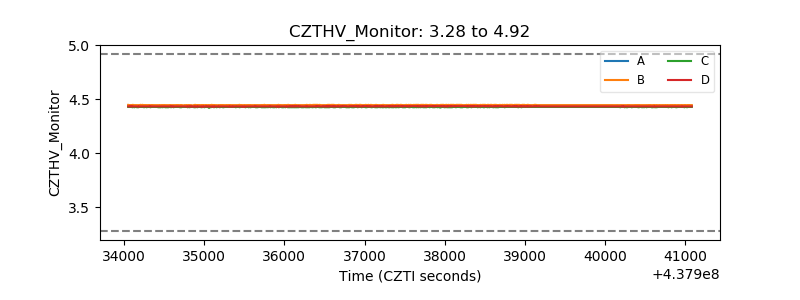 |
| D_VDD | 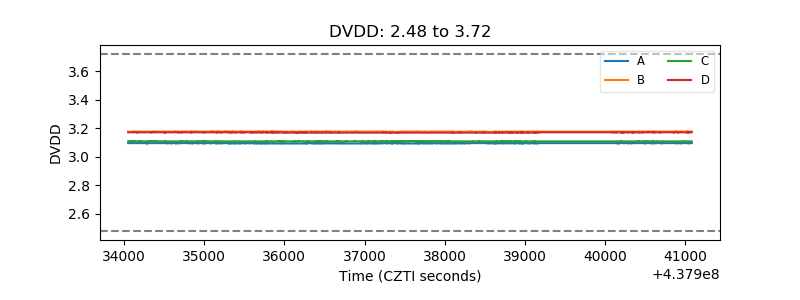 |
| Temperature 1 | 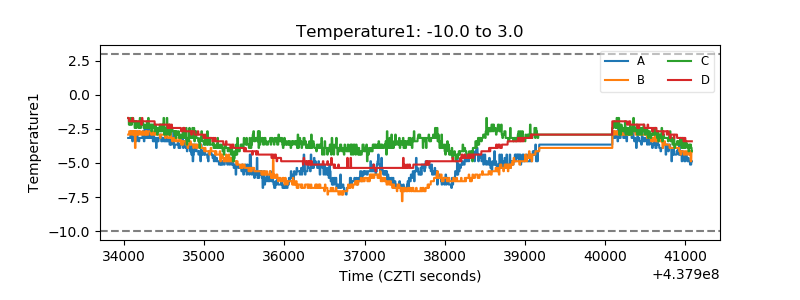 |
| Veto HV Monitor | 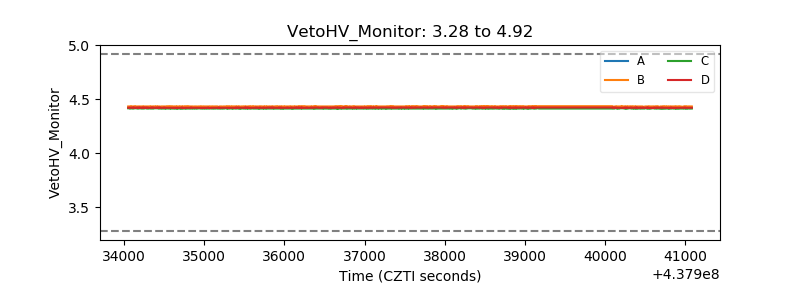 |
| Veto LLD | 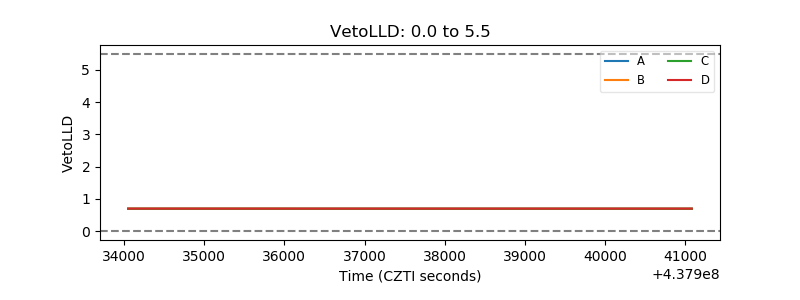 |
| Alpha Counter | 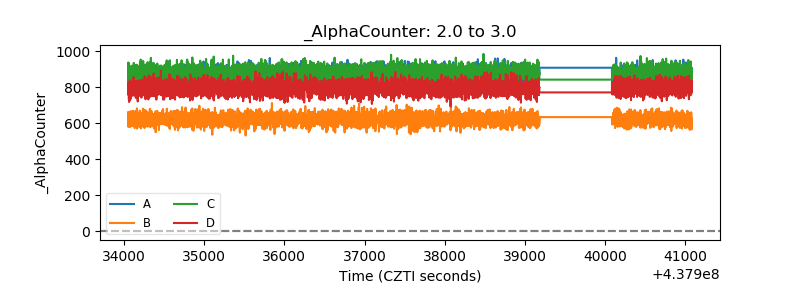 |
| _CPM_Rate | 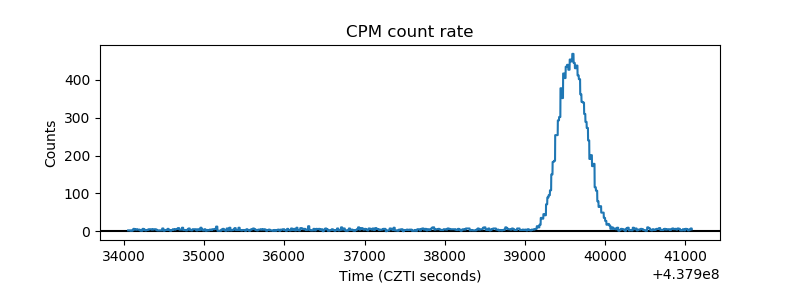 |
| CZT Counter |  |
| +2.5 Volts monitor | 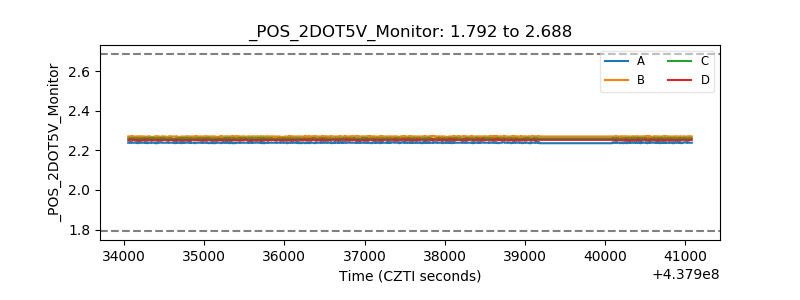 |
| +5 Volts monitor | 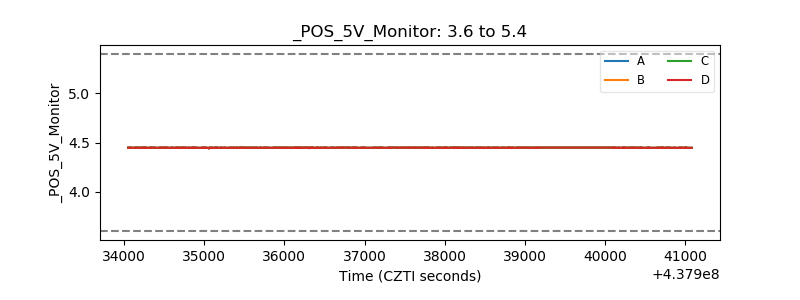 |
| _ROLL_ROT | 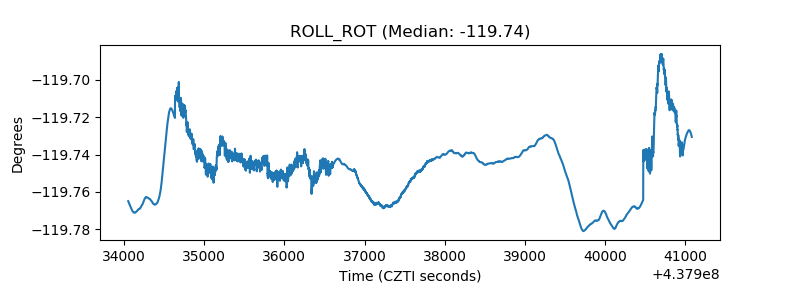 |
| _Roll_DEC | 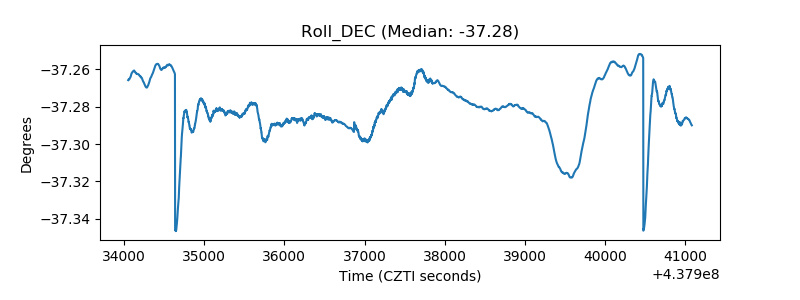 |
| _Roll_RA | 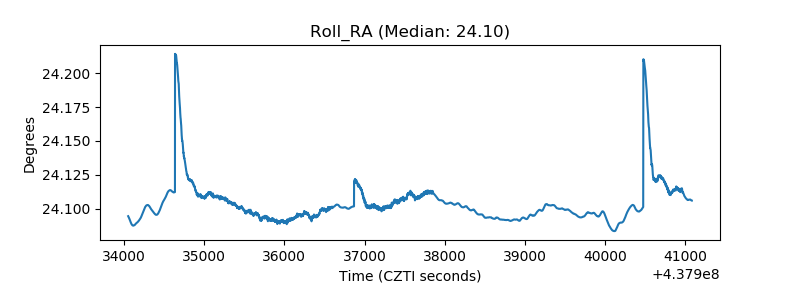 |
| Veto Counter | 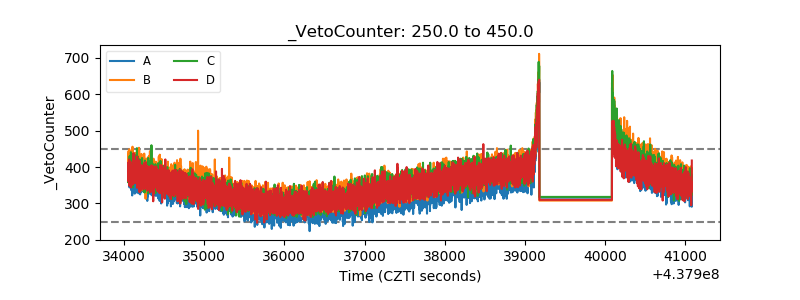 |