| Param | Original file | Final file |
|---|---|---|
| Filename | modeM0/AS1A13_037T01_9000005930_44008cztM0_level2.fits | modeM0/AS1A13_037T01_9000005930_44008cztM0_level2_quad_clean.evt |
| Size (bytes) | 422,778,240 | 109,644,480 |
| Size | 403.2 MB | 104.6 MB |
| Events in quadrant A | 4,552,662 | 719,058 |
| Events in quadrant B | 3,239,045 | 765,003 |
| Events in quadrant C | 3,277,892 | 730,528 |
| Events in quadrant D | 4,075,549 | 652,566 |
| Mode SS | |||
|---|---|---|---|
| Quadrant | BADHDUFLAG | Total packets | Discarded packets |
| A | 0 | 132 | 0 |
| B | 0 | 132 | 0 |
| C | 0 | 132 | 0 |
| D | 0 | 132 | 0 |
| Mode M0 | |||
|---|---|---|---|
| Quadrant | BADHDUFLAG | Total packets | Discarded packets |
| A | 0 | 17852 | 2 |
| B | 0 | 13924 | 2 |
| C | 0 | 14224 | 2 |
| D | 0 | 16512 | 2 |
| Mode M9 | |||
|---|---|---|---|
| Quadrant | BADHDUFLAG | Total packets | Discarded packets |
| A | 0 | 12 | 0 |
| B | 0 | 13 | 0 |
| C | 0 | 13 | 0 |
| D | 0 | 13 | 0 |
| Quadrant | Total seconds | Saturated seconds | Saturation percentage |
|---|---|---|---|
| A | 6492 | 188 | 2.895872% |
| B | 6492 | 39 | 0.600739% |
| C | 6492 | 34 | 0.523722% |
| D | 6491 | 120 | 1.848714% |
Noise dominated data is calculated using 1-second bins in cleaned event files. If a bin has >2000 counts, and if more than 50% of those come from <1% of pixels, then it is considered to be noise-dominated and hence unusable.
| Quadrant | # 1 sec bins | Bins with >0 counts | Bins with >2000 counts | High rate bins dominated by noise | Noise dominated (total time) | Noise dominated (detector-on time) | Marked lightcurve |
|---|---|---|---|---|---|---|---|
| A | 7627 | 6493 | 77 | 77 | 1.01% | 1.19% | 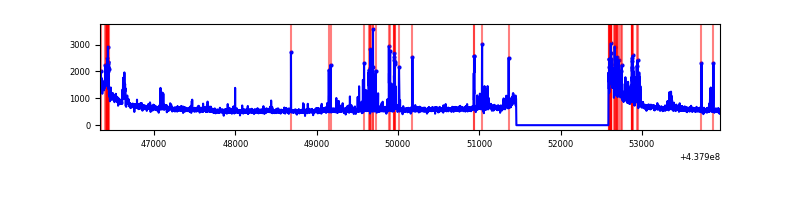 |
| B | 7627 | 6493 | 6 | 6 | 0.08% | 0.09% | 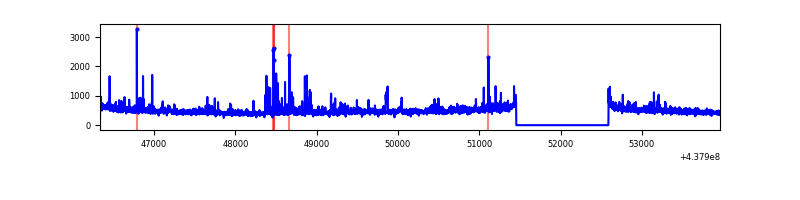 |
| C | 7627 | 6493 | 9 | 9 | 0.12% | 0.14% | 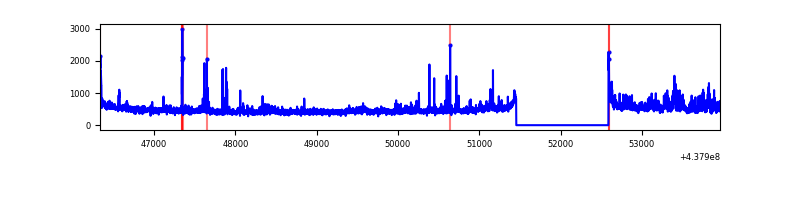 |
| D | 7626 | 6492 | 92 | 92 | 1.21% | 1.42% | 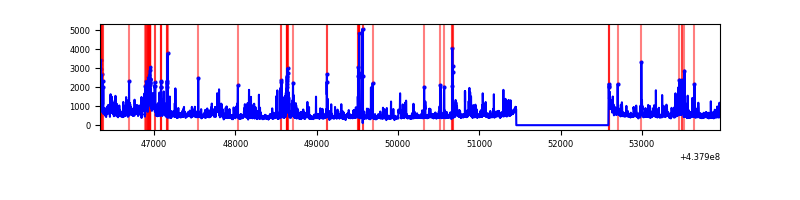 |
Top three noisy pixels from each quadrant. If the there are fewer than three noisy pixels in the level2.evt file, extra rows are filled as -1
| Pixel properties | Quadrant properties | ||||||
|---|---|---|---|---|---|---|---|
| Quadrant | DetID | PixID | Counts | Sigma | Mean | Median | Sigma |
| A | 10 | 83 | 1245250 | 8273.16 | 728 | 713 | 150.4 |
| A | 14 | 238 | 324575 | 2152.9 | 728 | 713 | 150.4 |
| A | 7 | 3 | 125801 | 831.53 | 728 | 713 | 150.4 |
| B | 0 | 213 | 141522 | 963.52 | 740 | 717 | 146.1 |
| B | 4 | 171 | 64942 | 439.49 | 740 | 717 | 146.1 |
| B | 4 | 173 | 27950 | 186.35 | 740 | 717 | 146.1 |
| C | 3 | 233 | 298832 | 1726.38 | 731 | 735 | 172.7 |
| C | 15 | 1 | 43732 | 249.01 | 731 | 735 | 172.7 |
| C | 2 | 14 | 32903 | 186.3 | 731 | 735 | 172.7 |
| D | 1 | 52 | 408938 | 2212.89 | 721 | 698 | 184.5 |
| D | 5 | 222 | 313183 | 1693.85 | 721 | 698 | 184.5 |
| D | 2 | 120 | 135773 | 732.18 | 721 | 698 | 184.5 |
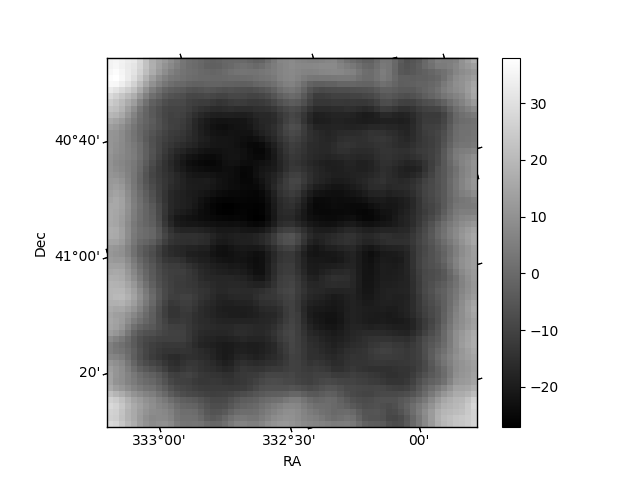
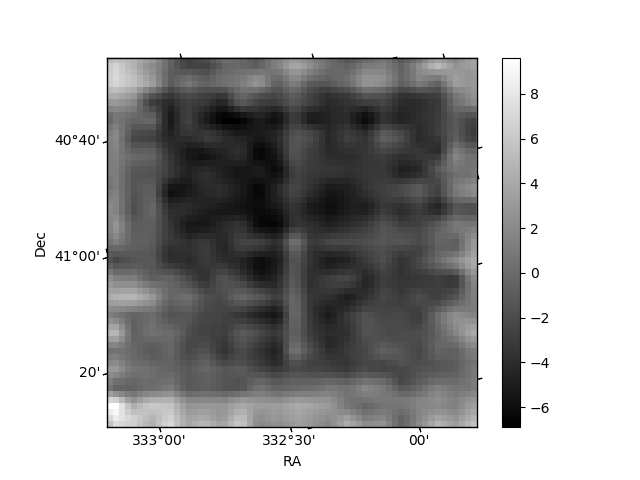
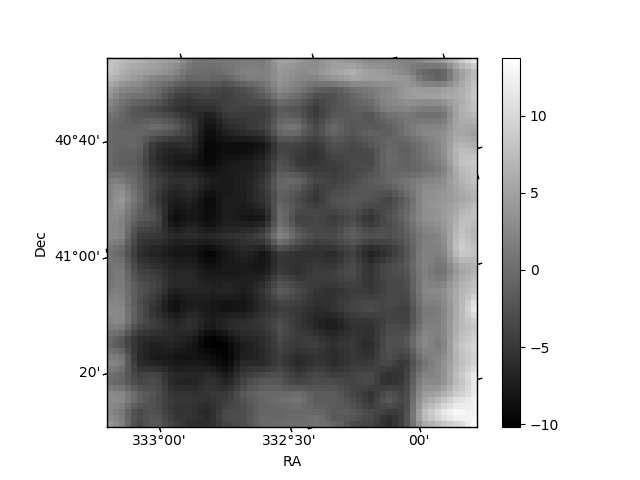
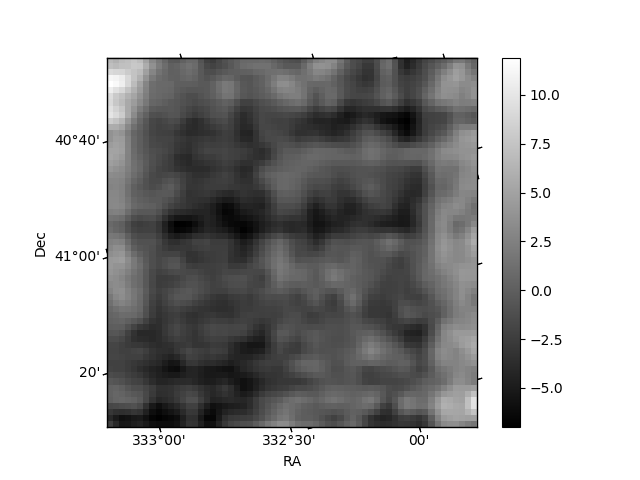
Histogram calculated using DETX and DETY for each event in the final _common_clean file
| Quadrant A | 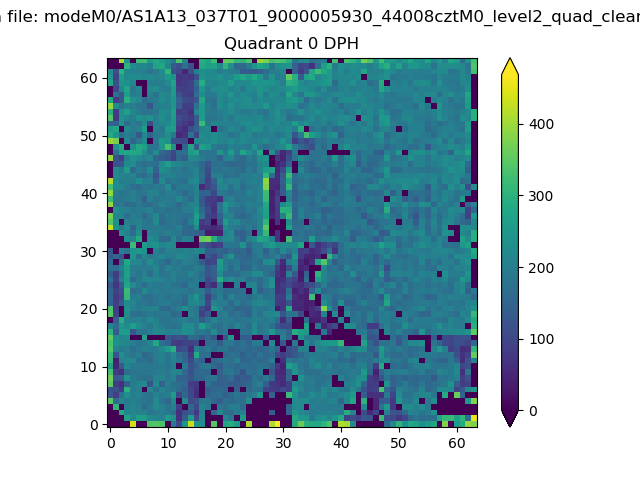 |
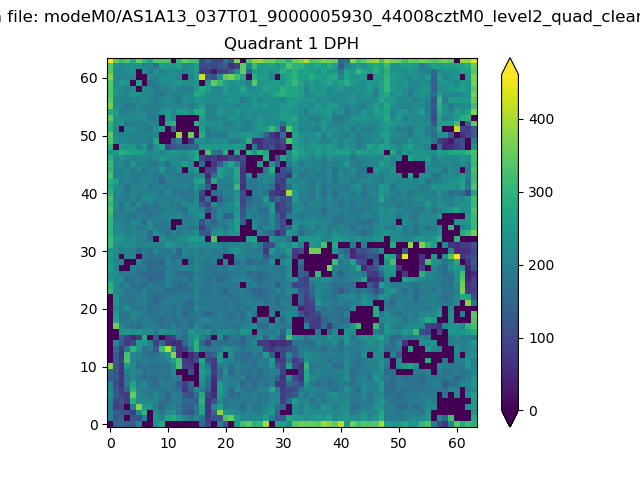 |
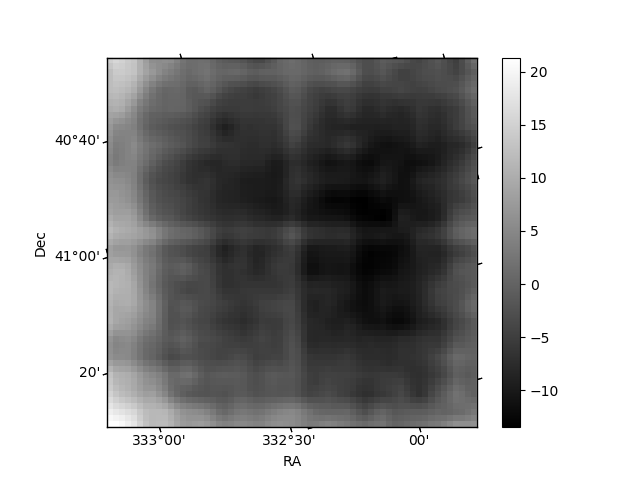
Quadrant B |
|---|---|---|---|
| Quadrant D | 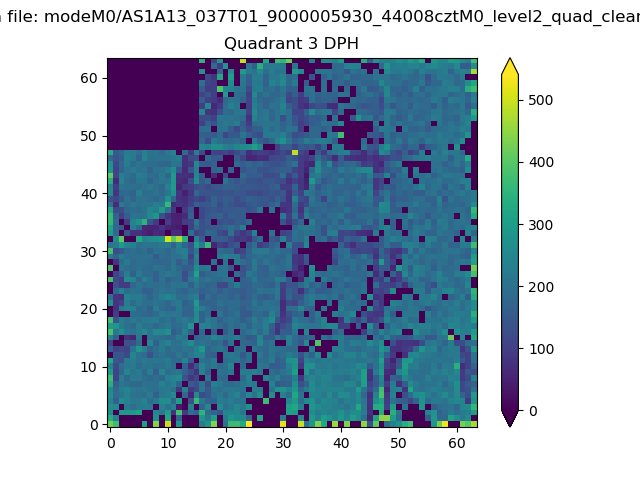 |
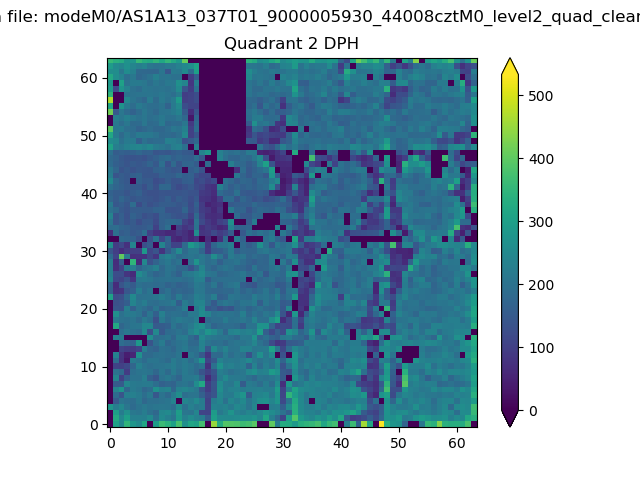 |
Quadrant C |
| Plot type | Count rate plots | Images |
|---|---|---|
| Comparison with Poisson distribution Blue bars denote a histogram of data divided into 1 sec bins. Red curve is a Poisson curve with rate = median count rate of data. |
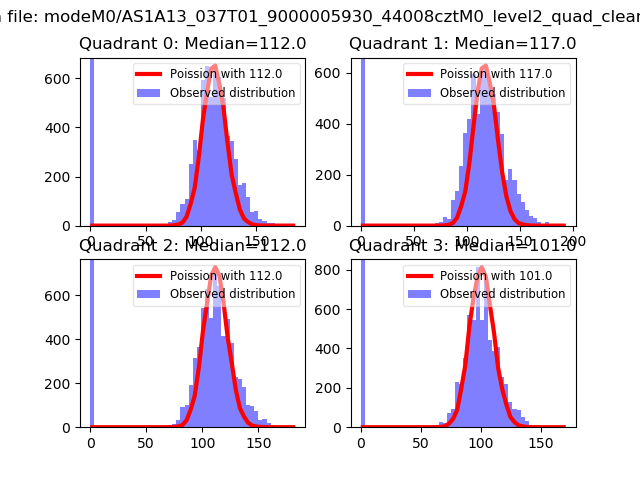 |
 |
| Quadrant-wise count rates Data is divided into 100 sec bins |
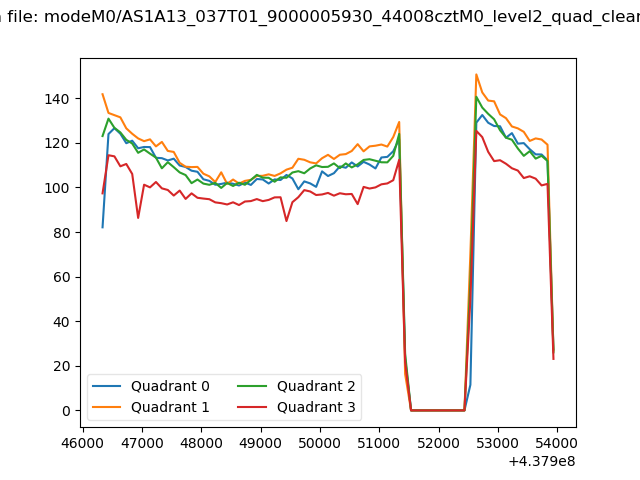 |
|
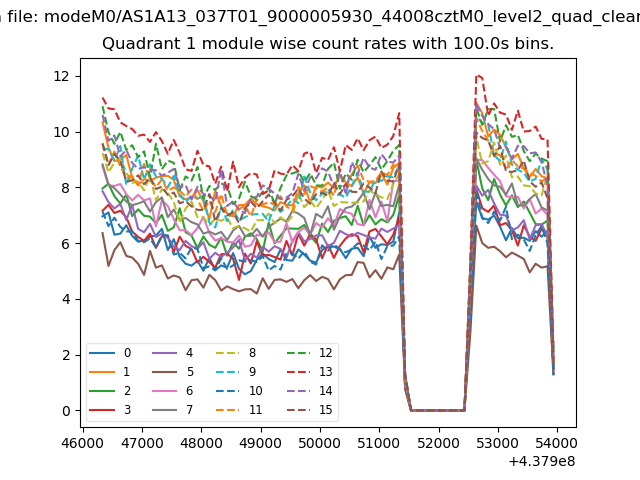
| Module-wise count rates for Quadrant A Data is divided into 100 sec bins |
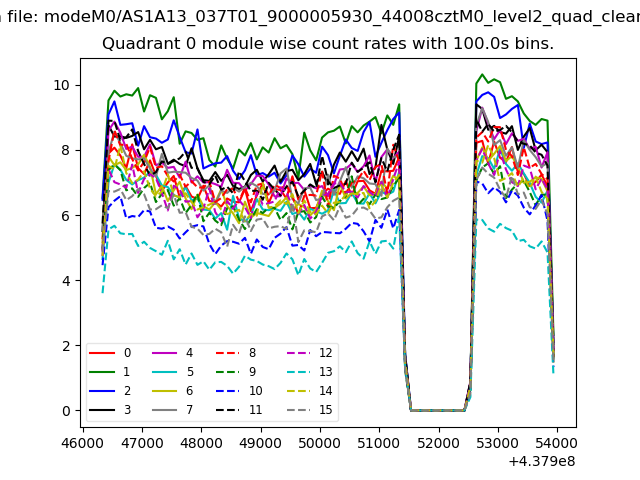 |
 |
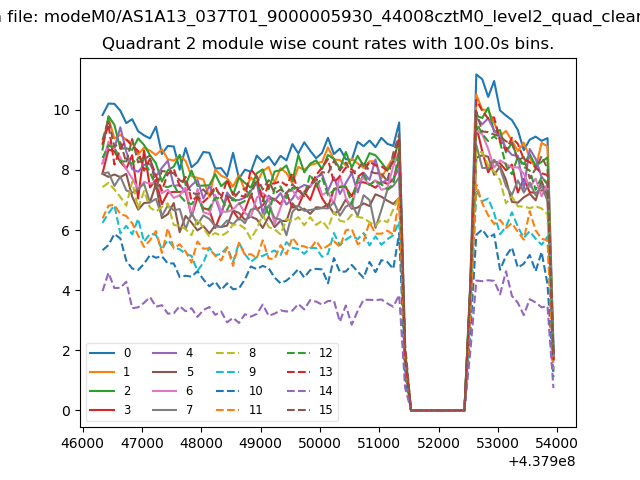
| Module-wise count rates for Quadrant B Data is divided into 100 sec bins |
 |
 |
| Module-wise count rates for Quadrant C Data is divided into 100 sec bins |
 |
 |
| Module-wise count rates for Quadrant D Data is divided into 100 sec bins |
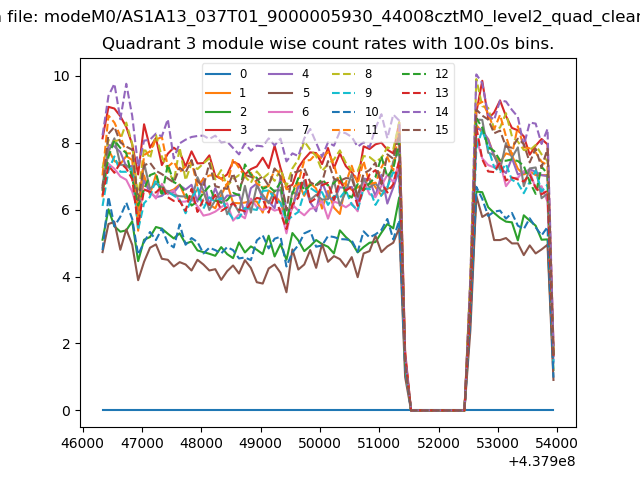 |
 |
| Parameter | Plot |
|---|---|
| CZT HV Monitor | 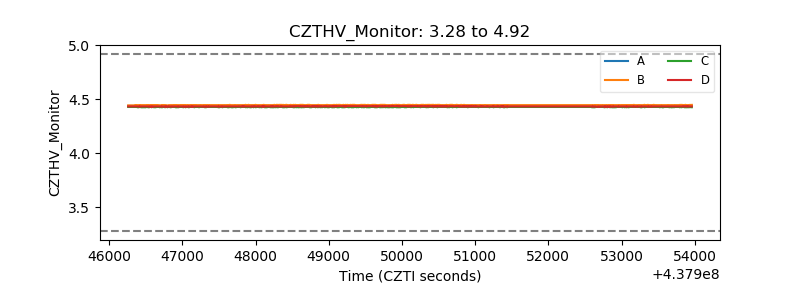 |
| D_VDD | 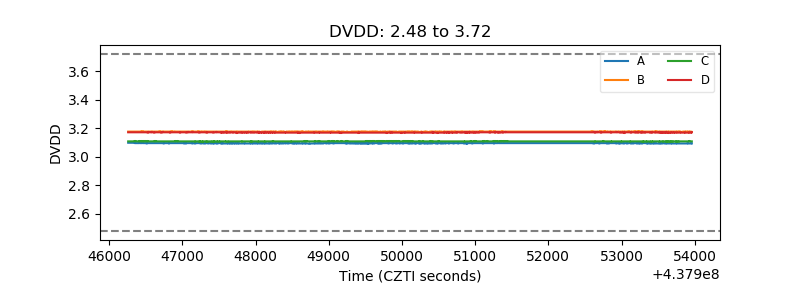 |
| Temperature 1 | 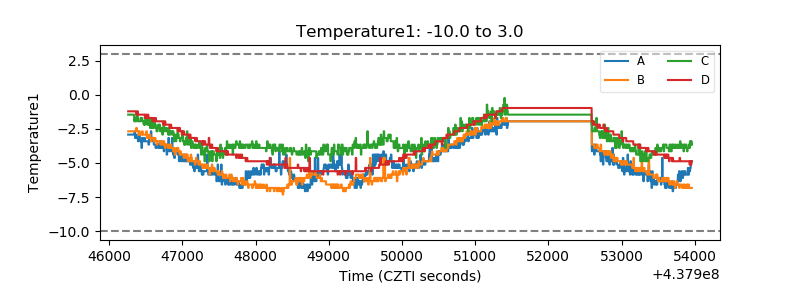 |
| Veto HV Monitor | 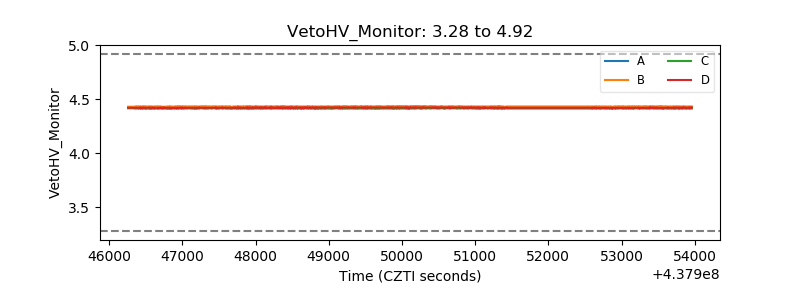 |
| Veto LLD | 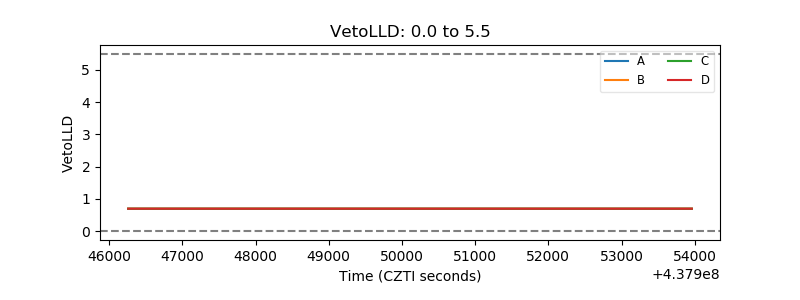 |
| Alpha Counter | 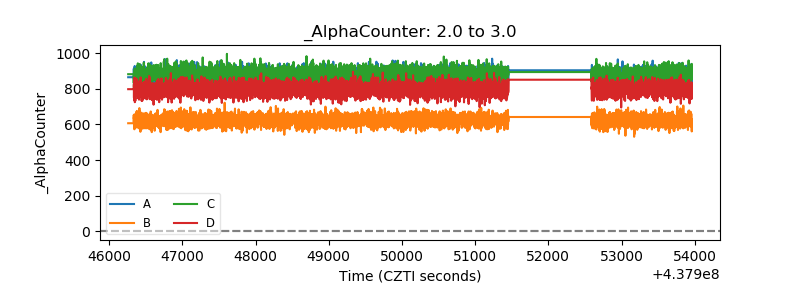 |
| _CPM_Rate | 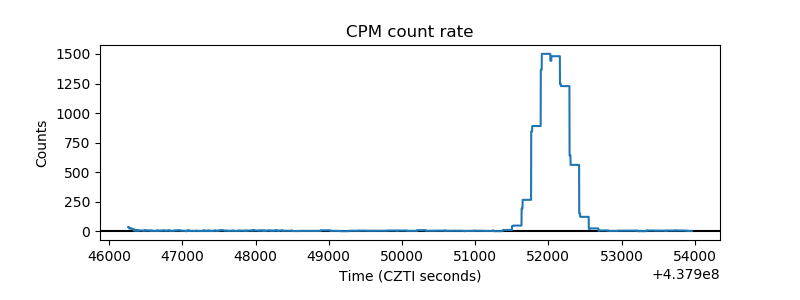 |
| CZT Counter | 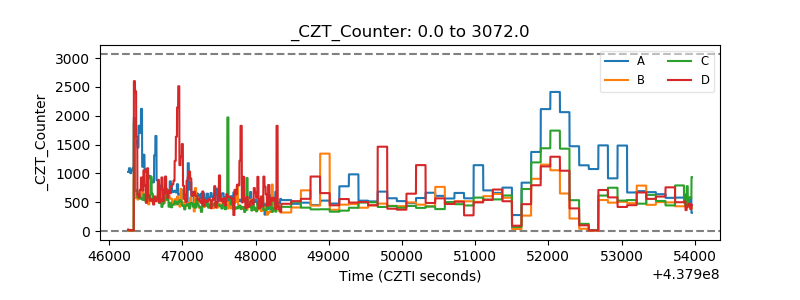 |
| +2.5 Volts monitor | 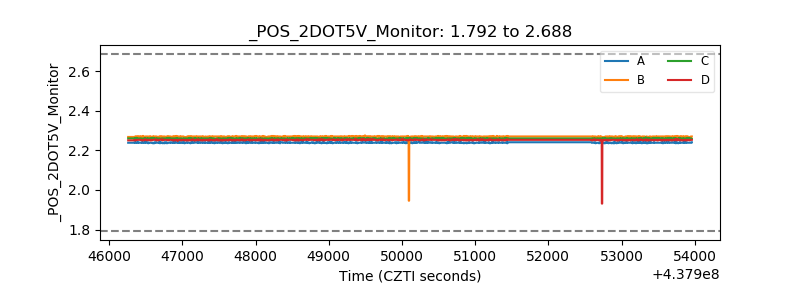 |
| +5 Volts monitor | 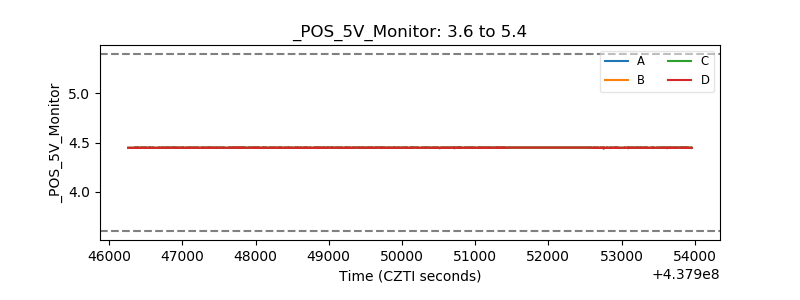 |
| _ROLL_ROT | 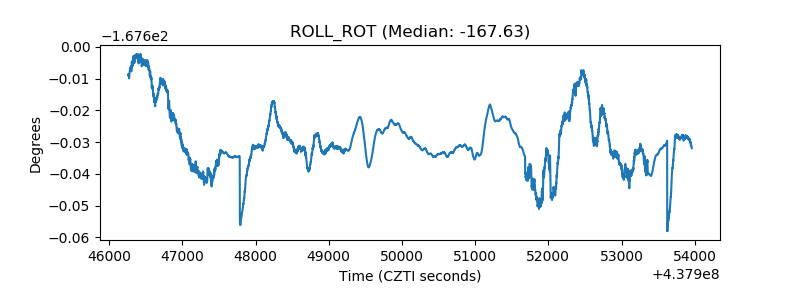 |
| _Roll_DEC | 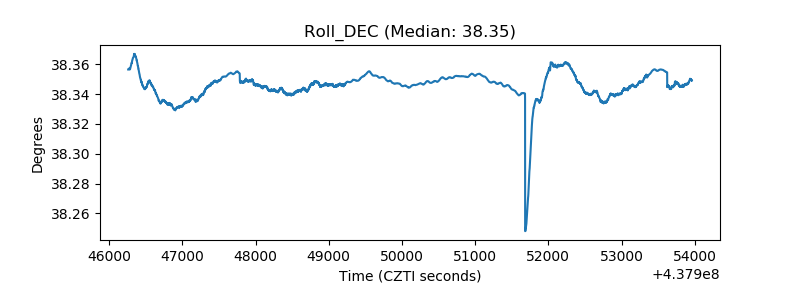 |
| _Roll_RA | 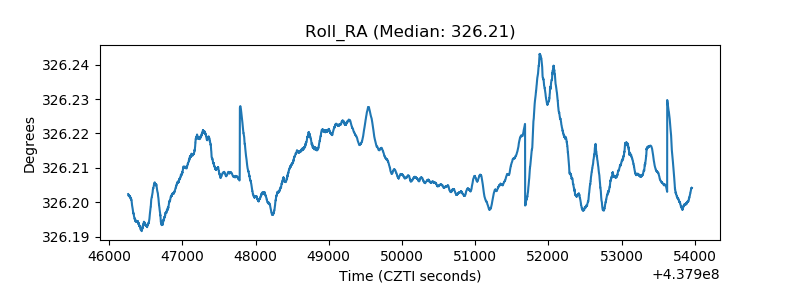 |
| Veto Counter | 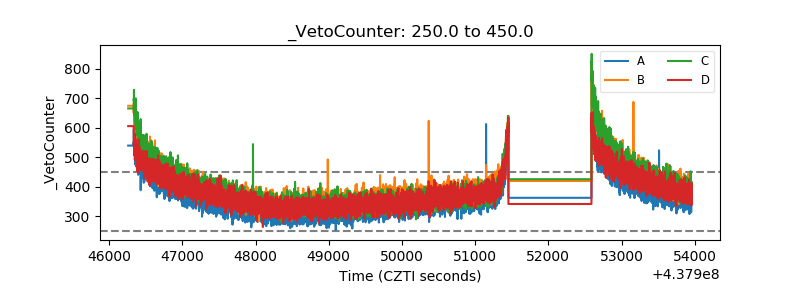 |