| Param | Original file | Final file |
|---|---|---|
| Filename | modeM0/AS1A13_037T01_9000005930_44010cztM0_level2.fits | modeM0/AS1A13_037T01_9000005930_44010cztM0_level2_quad_clean.evt |
| Size (bytes) | 448,032,960 | 115,833,600 |
| Size | 427.3 MB | 110.5 MB |
| Events in quadrant A | 5,116,806 | 753,516 |
| Events in quadrant B | 3,304,467 | 819,818 |
| Events in quadrant C | 3,705,455 | 778,754 |
| Events in quadrant D | 3,942,239 | 692,712 |
| Mode SS | |||
|---|---|---|---|
| Quadrant | BADHDUFLAG | Total packets | Discarded packets |
| A | 0 | 134 | 0 |
| B | 0 | 134 | 0 |
| C | 0 | 134 | 0 |
| D | 0 | 134 | 0 |
| Mode M0 | |||
|---|---|---|---|
| Quadrant | BADHDUFLAG | Total packets | Discarded packets |
| A | 0 | 19859 | 2 |
| B | 0 | 14124 | 3 |
| C | 0 | 15240 | 2 |
| D | 0 | 16404 | 2 |
| Mode M9 | |||
|---|---|---|---|
| Quadrant | BADHDUFLAG | Total packets | Discarded packets |
| A | 0 | 21 | 0 |
| B | 0 | 22 | 0 |
| C | 0 | 22 | 0 |
| D | 0 | 22 | 0 |
| Quadrant | Total seconds | Saturated seconds | Saturation percentage |
|---|---|---|---|
| A | 6639 | 335 | 5.045941% |
| B | 6638 | 42 | 0.632721% |
| C | 6638 | 37 | 0.557397% |
| D | 6638 | 116 | 1.747514% |
Noise dominated data is calculated using 1-second bins in cleaned event files. If a bin has >2000 counts, and if more than 50% of those come from <1% of pixels, then it is considered to be noise-dominated and hence unusable.
| Quadrant | # 1 sec bins | Bins with >0 counts | Bins with >2000 counts | High rate bins dominated by noise | Noise dominated (total time) | Noise dominated (detector-on time) | Marked lightcurve |
|---|---|---|---|---|---|---|---|
| A | 7879 | 6640 | 180 | 180 | 2.28% | 2.71% | 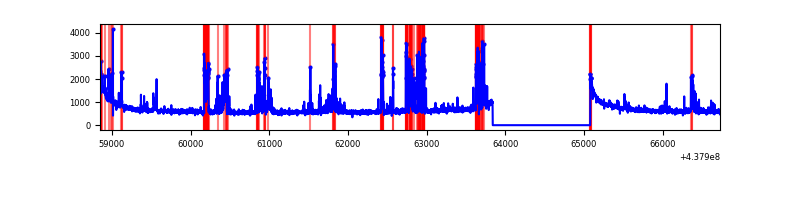 |
| B | 7878 | 6639 | 5 | 5 | 0.06% | 0.08% | 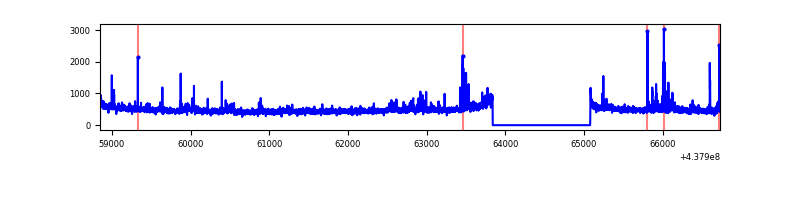 |
| C | 7878 | 6639 | 14 | 14 | 0.18% | 0.21% | 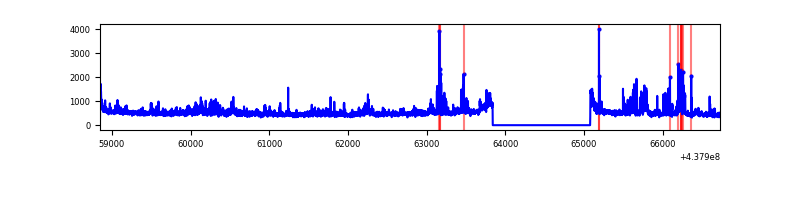 |
| D | 7878 | 6639 | 83 | 83 | 1.05% | 1.25% | 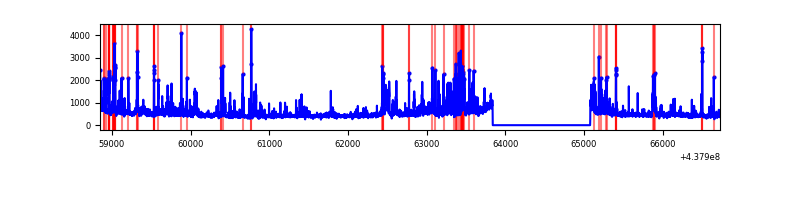 |
Top three noisy pixels from each quadrant. If the there are fewer than three noisy pixels in the level2.evt file, extra rows are filled as -1
| Pixel properties | Quadrant properties | ||||||
|---|---|---|---|---|---|---|---|
| Quadrant | DetID | PixID | Counts | Sigma | Mean | Median | Sigma |
| A | 10 | 83 | 1236157 | 7989.35 | 759 | 743 | 154.6 |
| A | 14 | 238 | 852438 | 5507.86 | 759 | 743 | 154.6 |
| A | 7 | 3 | 43520 | 276.64 | 759 | 743 | 154.6 |
| B | 0 | 213 | 81261 | 522.6 | 781 | 756 | 154.0 |
| B | 0 | 155 | 49425 | 315.94 | 781 | 756 | 154.0 |
| B | 0 | 245 | 37821 | 240.61 | 781 | 756 | 154.0 |
| C | 3 | 233 | 441407 | 2435.53 | 766 | 772 | 180.9 |
| C | 14 | 254 | 270667 | 1491.8 | 766 | 772 | 180.9 |
| C | 13 | 61 | 5121 | 24.04 | 766 | 772 | 180.9 |
| D | 1 | 52 | 634496 | 3312.54 | 754 | 729 | 191.3 |
| D | 13 | 171 | 102075 | 529.71 | 754 | 729 | 191.3 |
| D | 13 | 249 | 76581 | 396.46 | 754 | 729 | 191.3 |
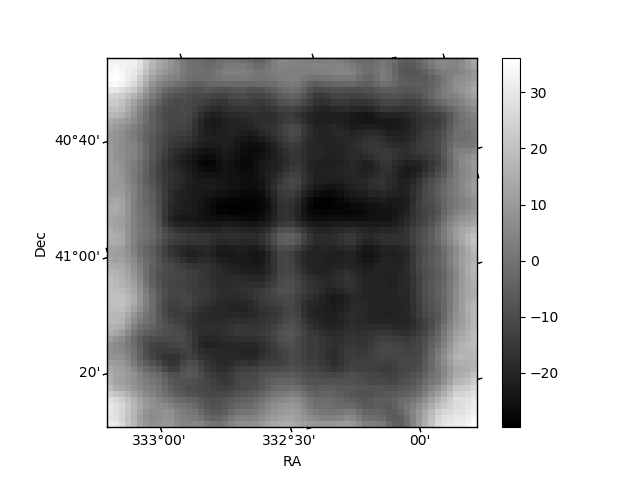
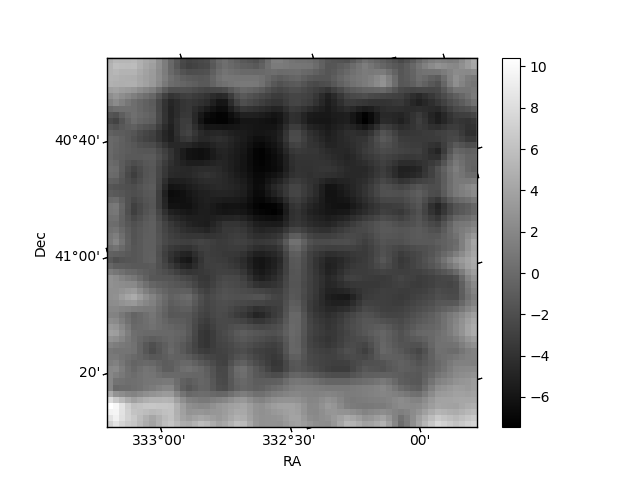
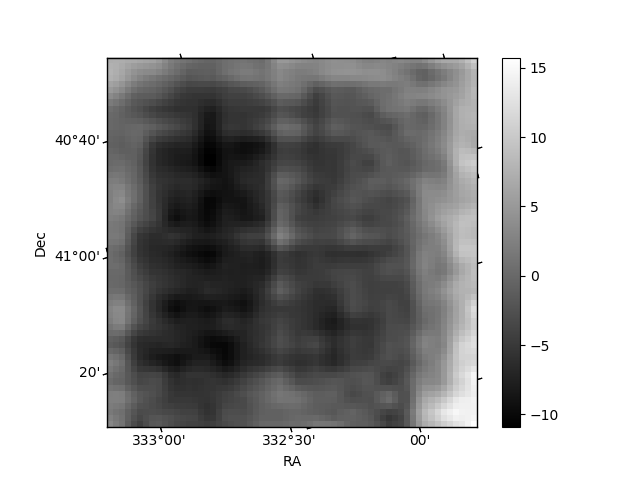
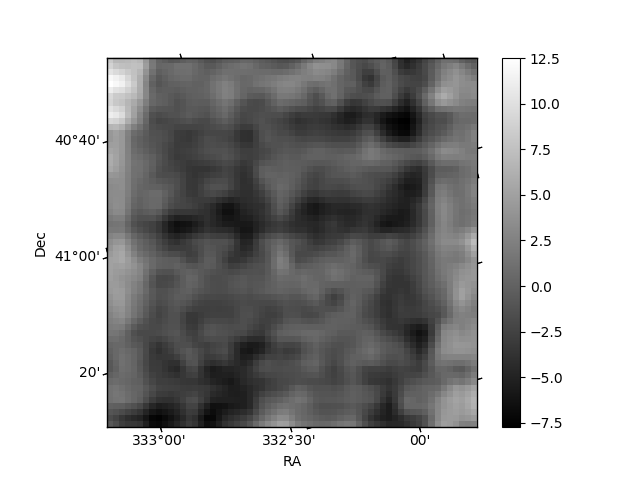
Histogram calculated using DETX and DETY for each event in the final _common_clean file
| Quadrant A | 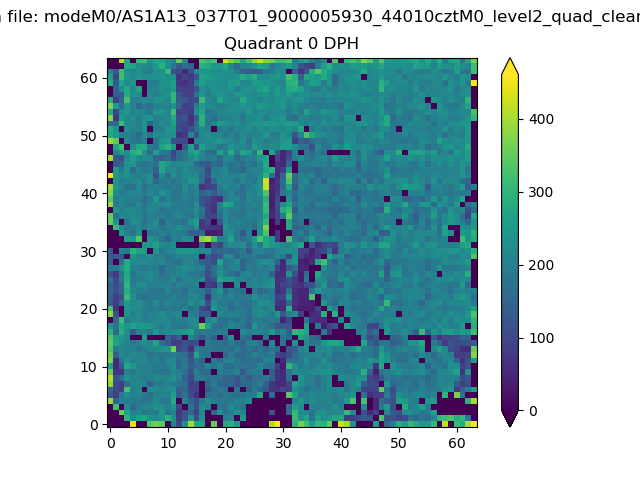 |
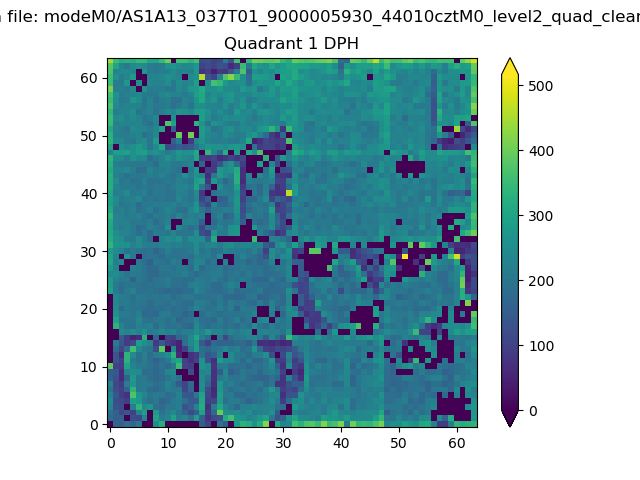 |
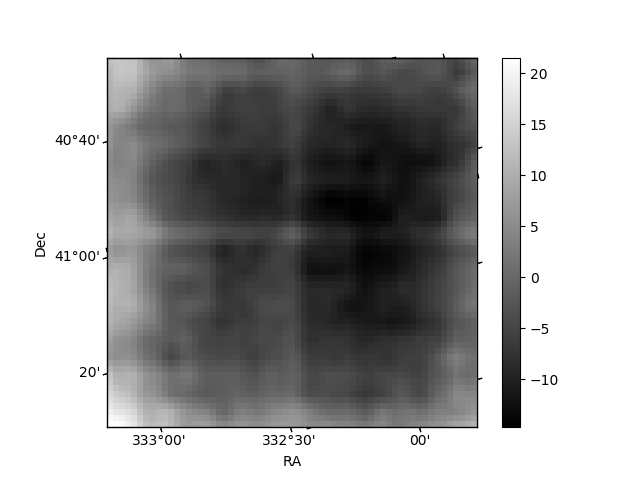
Quadrant B |
|---|---|---|---|
| Quadrant D | 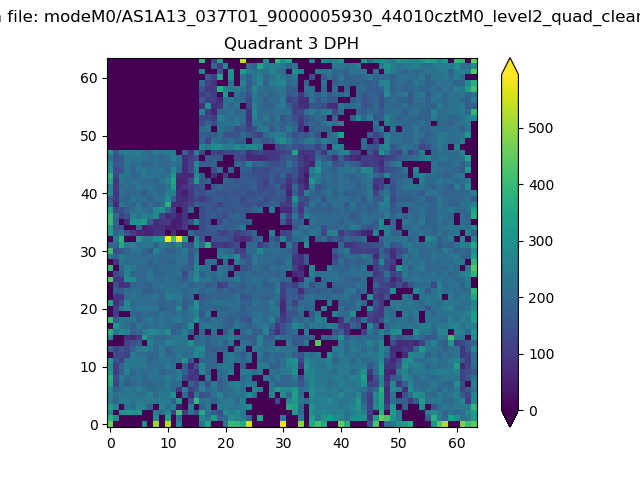 |
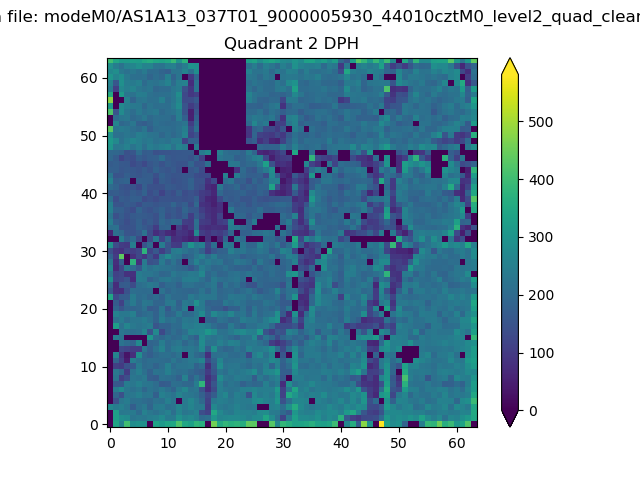 |
Quadrant C |
| Plot type | Count rate plots | Images |
|---|---|---|
| Comparison with Poisson distribution Blue bars denote a histogram of data divided into 1 sec bins. Red curve is a Poisson curve with rate = median count rate of data. |
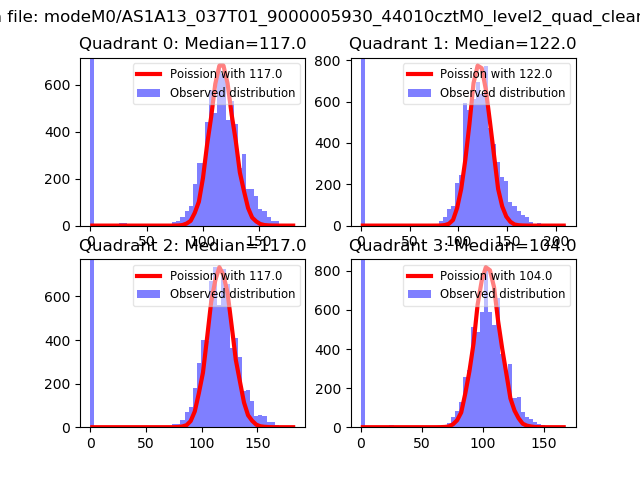 |
 |
| Quadrant-wise count rates Data is divided into 100 sec bins |
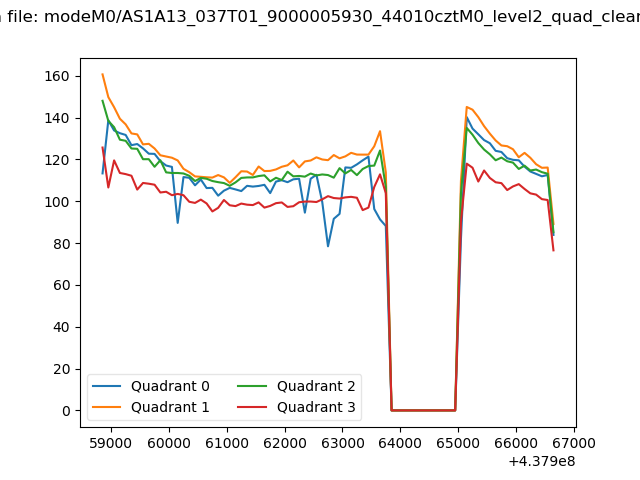 |
|
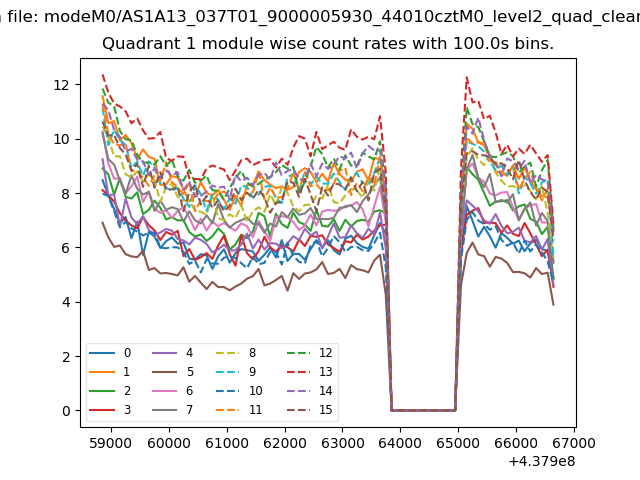
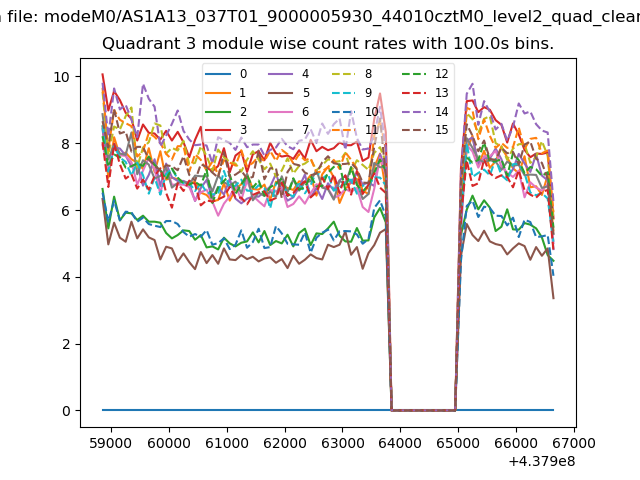
| Module-wise count rates for Quadrant A Data is divided into 100 sec bins |
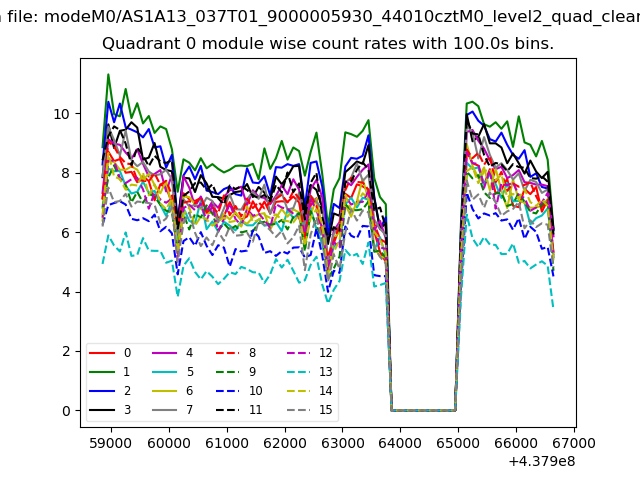 |
 |
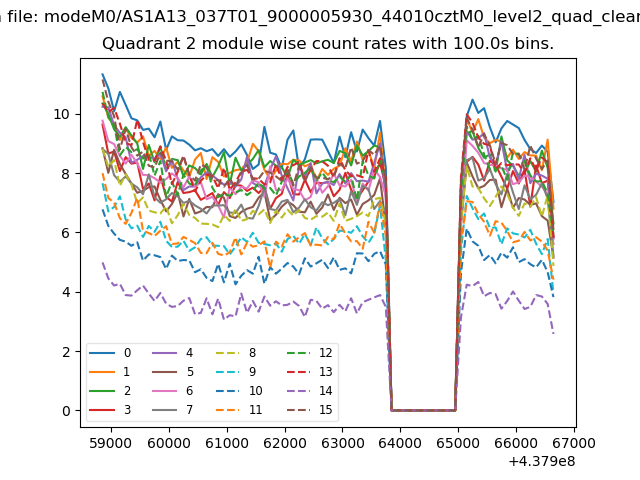
| Module-wise count rates for Quadrant B Data is divided into 100 sec bins |
 |
 |
| Module-wise count rates for Quadrant C Data is divided into 100 sec bins |
 |
 |
| Module-wise count rates for Quadrant D Data is divided into 100 sec bins |
 |
 |
| Parameter | Plot |
|---|---|
| CZT HV Monitor |  |
| D_VDD | 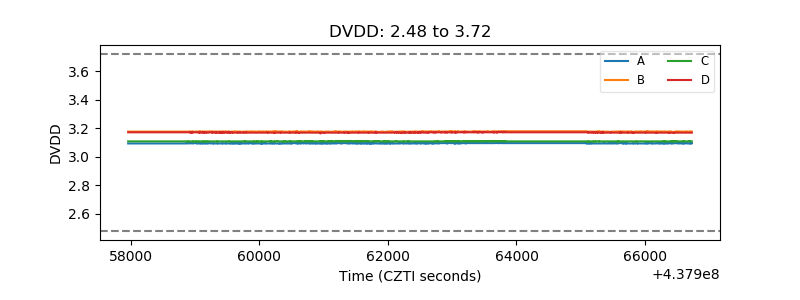 |
| Temperature 1 | 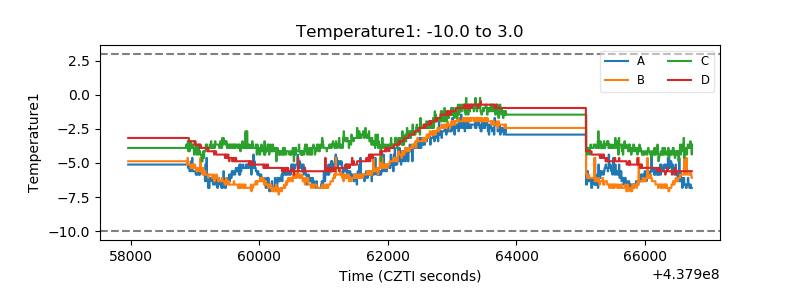 |
| Veto HV Monitor | 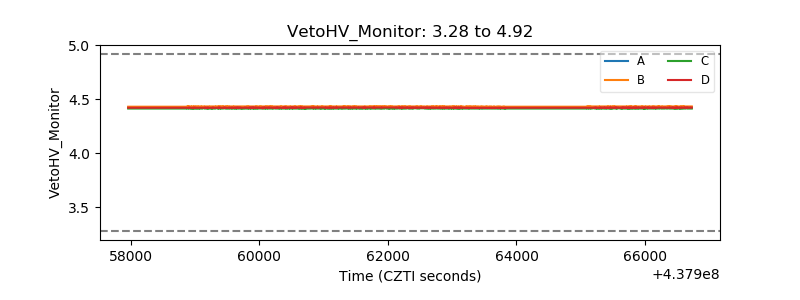 |
| Veto LLD | 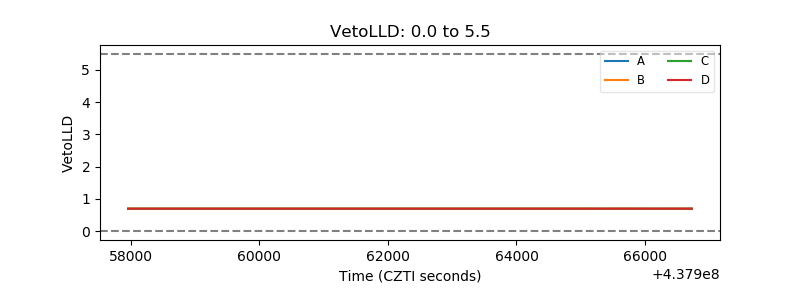 |
| Alpha Counter | 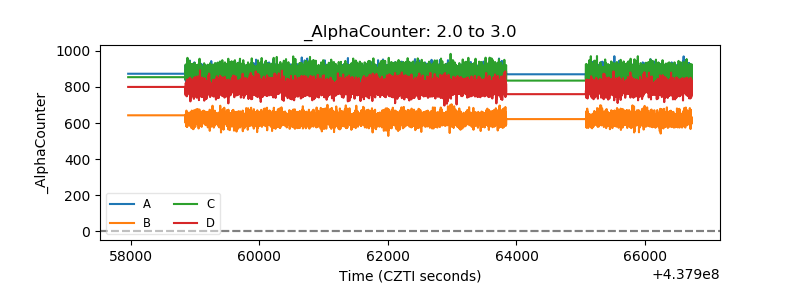 |
| _CPM_Rate | 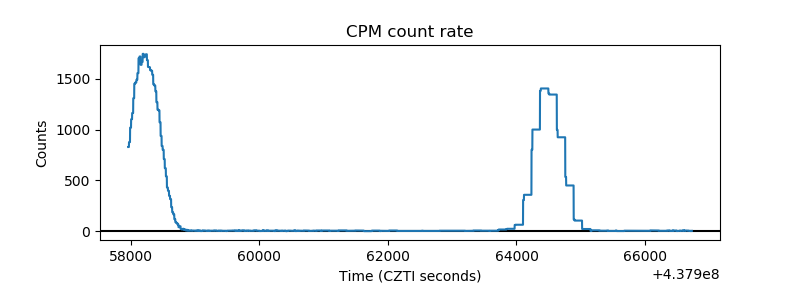 |
| CZT Counter | 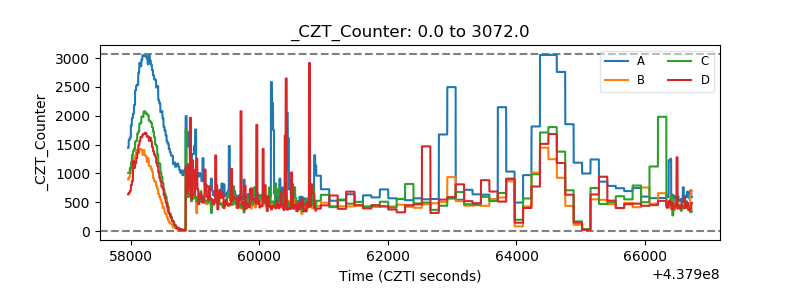 |
| +2.5 Volts monitor | 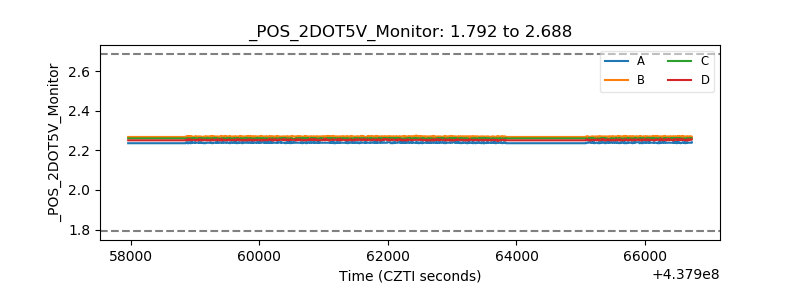 |
| +5 Volts monitor | 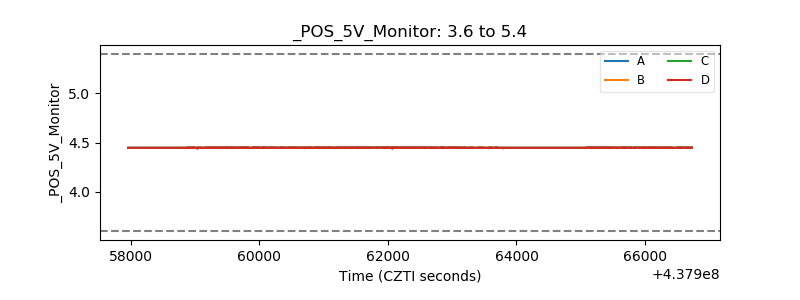 |
| _ROLL_ROT | 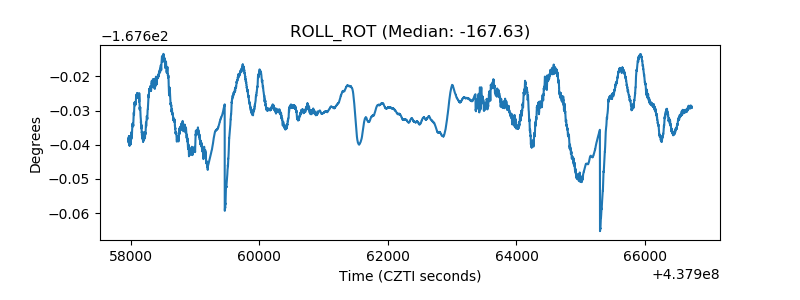 |
| _Roll_DEC | 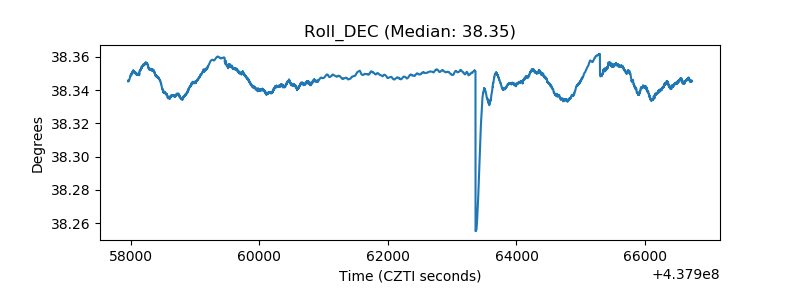 |
| _Roll_RA | 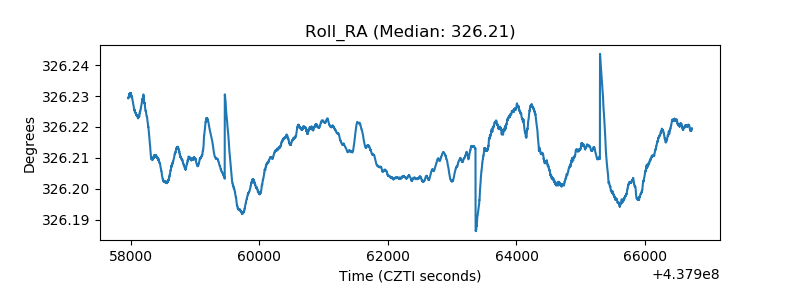 |
| Veto Counter | 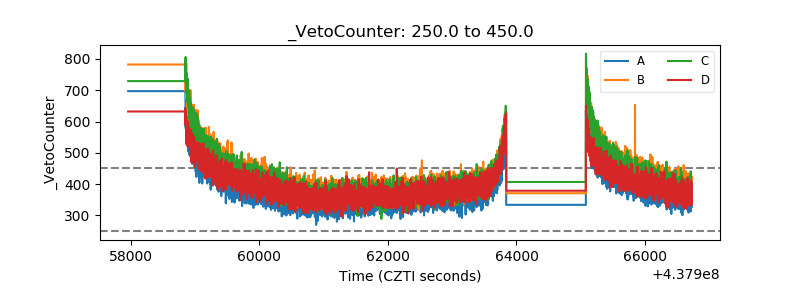 |