| Param | Original file | Final file |
|---|---|---|
| Filename | modeM0/AS1A13_037T01_9000005930_44011cztM0_level2.fits | modeM0/AS1A13_037T01_9000005930_44011cztM0_level2_quad_clean.evt |
| Size (bytes) | 375,909,120 | 102,686,400 |
| Size | 358.5 MB | 97.9 MB |
| Events in quadrant A | 3,927,881 | 679,252 |
| Events in quadrant B | 2,950,536 | 714,816 |
| Events in quadrant C | 2,975,541 | 687,286 |
| Events in quadrant D | 3,593,910 | 608,805 |
| Mode SS | |||
|---|---|---|---|
| Quadrant | BADHDUFLAG | Total packets | Discarded packets |
| A | 0 | 122 | 0 |
| B | 0 | 122 | 0 |
| C | 0 | 122 | 0 |
| D | 0 | 122 | 0 |
| Mode M0 | |||
|---|---|---|---|
| Quadrant | BADHDUFLAG | Total packets | Discarded packets |
| A | 0 | 15748 | 1 |
| B | 0 | 12696 | 1 |
| C | 0 | 12987 | 1 |
| D | 0 | 14902 | 1 |
| Mode M9 | |||
|---|---|---|---|
| Quadrant | BADHDUFLAG | Total packets | Discarded packets |
| A | 0 | 12 | 0 |
| B | 0 | 12 | 0 |
| C | 0 | 12 | 0 |
| D | 0 | 12 | 0 |
| Quadrant | Total seconds | Saturated seconds | Saturation percentage |
|---|---|---|---|
| A | 6003 | 135 | 2.248876% |
| B | 6004 | 99 | 1.648901% |
| C | 6003 | 52 | 0.866234% |
| D | 6003 | 176 | 2.931867% |
Noise dominated data is calculated using 1-second bins in cleaned event files. If a bin has >2000 counts, and if more than 50% of those come from <1% of pixels, then it is considered to be noise-dominated and hence unusable.
| Quadrant | # 1 sec bins | Bins with >0 counts | Bins with >2000 counts | High rate bins dominated by noise | Noise dominated (total time) | Noise dominated (detector-on time) | Marked lightcurve |
|---|---|---|---|---|---|---|---|
| A | 7153 | 6005 | 13 | 13 | 0.18% | 0.22% | 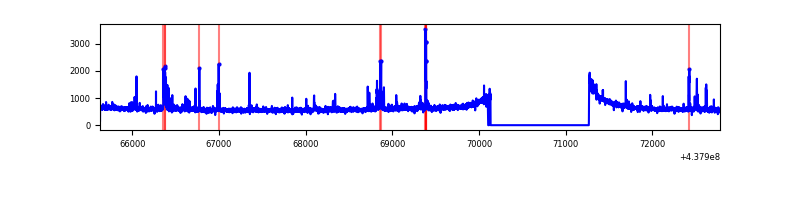 |
| B | 7154 | 6006 | 3 | 3 | 0.04% | 0.05% | 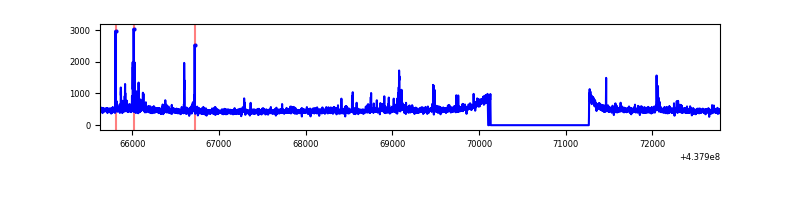 |
| C | 7153 | 6005 | 10 | 10 | 0.14% | 0.17% | 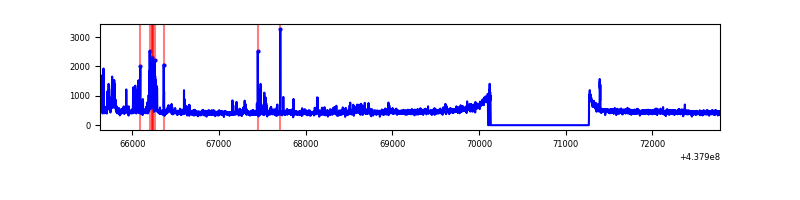 |
| D | 7153 | 6005 | 84 | 84 | 1.17% | 1.40% | 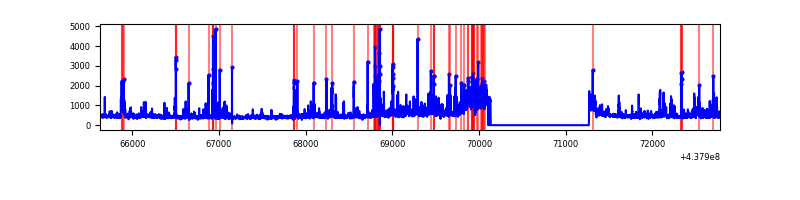 |
Top three noisy pixels from each quadrant. If the there are fewer than three noisy pixels in the level2.evt file, extra rows are filled as -1
| Pixel properties | Quadrant properties | ||||||
|---|---|---|---|---|---|---|---|
| Quadrant | DetID | PixID | Counts | Sigma | Mean | Median | Sigma |
| A | 10 | 83 | 1023997 | 7072.89 | 694 | 680 | 144.7 |
| A | 14 | 238 | 178742 | 1230.72 | 694 | 680 | 144.7 |
| A | 7 | 3 | 26104 | 175.72 | 694 | 680 | 144.7 |
| B | 0 | 213 | 89090 | 638.53 | 701 | 679 | 138.5 |
| B | 4 | 170 | 20756 | 145.0 | 701 | 679 | 138.5 |
| B | 4 | 173 | 17796 | 123.62 | 701 | 679 | 138.5 |
| C | 14 | 254 | 237641 | 1469.15 | 686 | 688 | 161.3 |
| C | 3 | 233 | 50359 | 307.97 | 686 | 688 | 161.3 |
| C | 12 | 16 | 10462 | 60.6 | 686 | 688 | 161.3 |
| D | 1 | 52 | 605923 | 3569.98 | 674 | 653 | 169.5 |
| D | 5 | 222 | 83131 | 486.47 | 674 | 653 | 169.5 |
| D | 13 | 249 | 68080 | 397.7 | 674 | 653 | 169.5 |
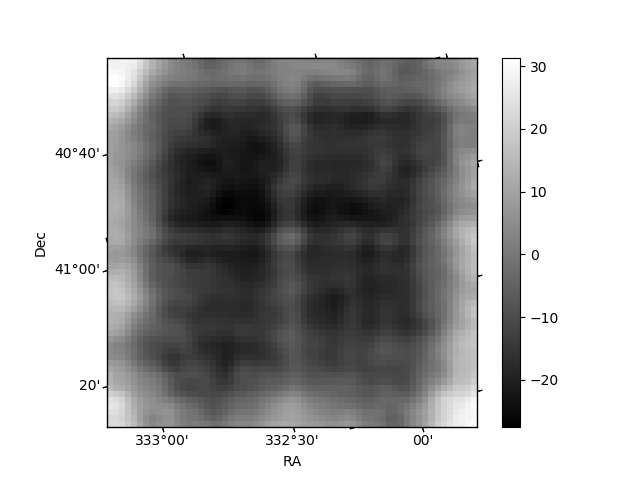
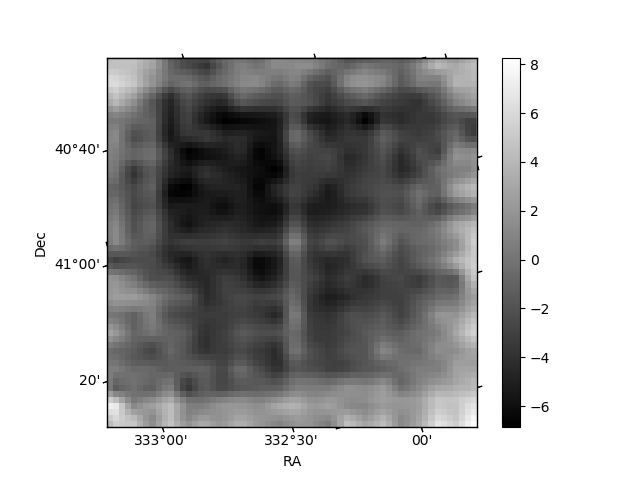
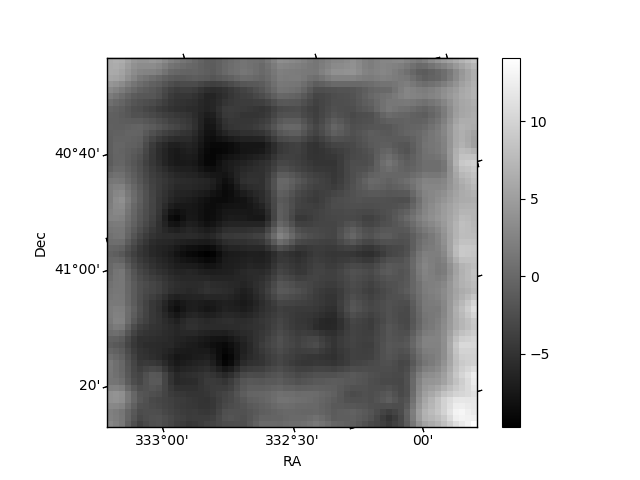
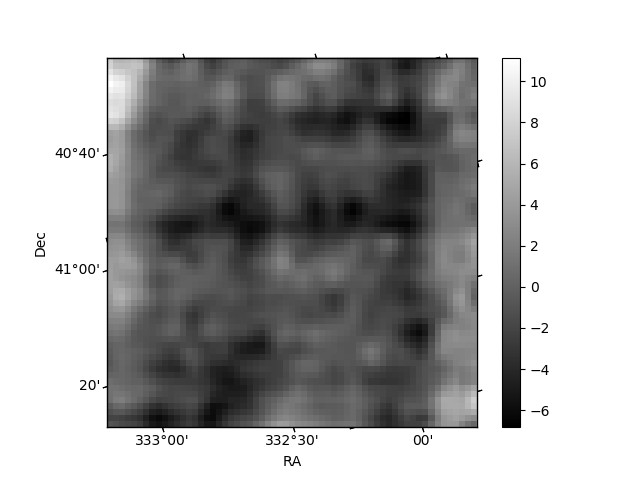
Histogram calculated using DETX and DETY for each event in the final _common_clean file
| Quadrant A | 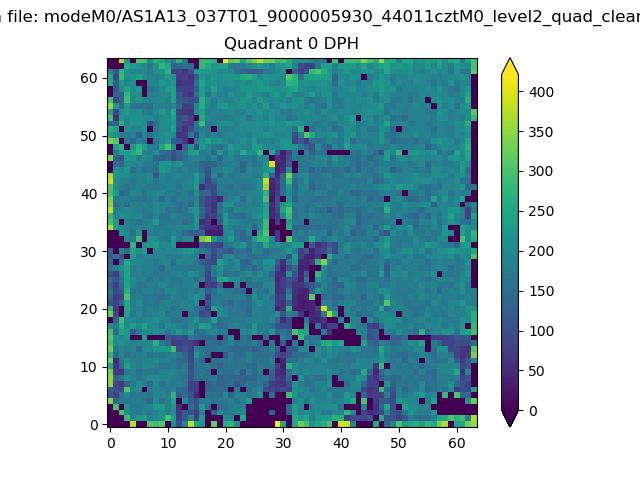 |
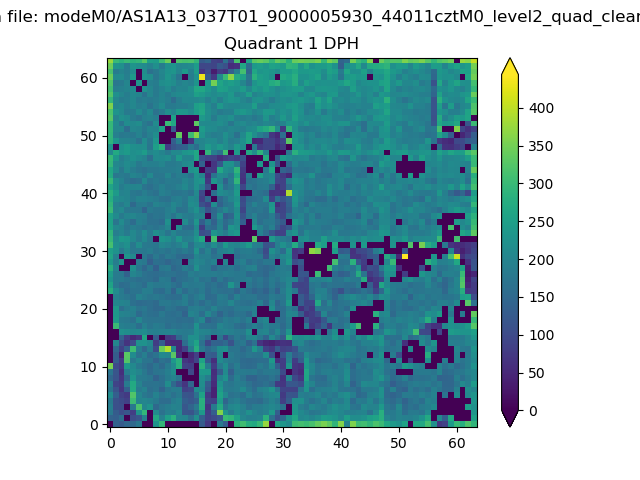 |
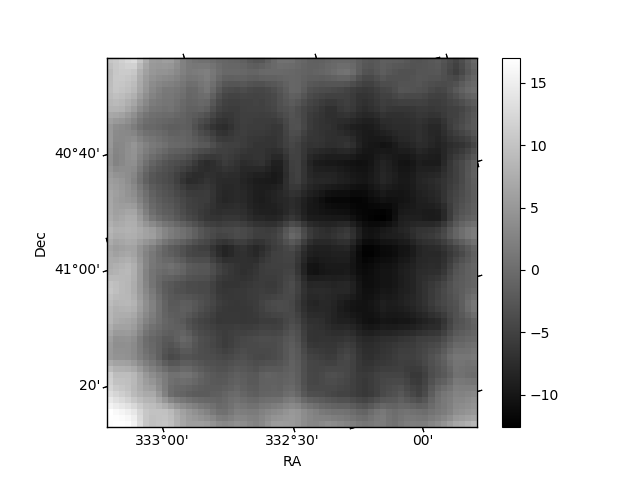
Quadrant B |
|---|---|---|---|
| Quadrant D | 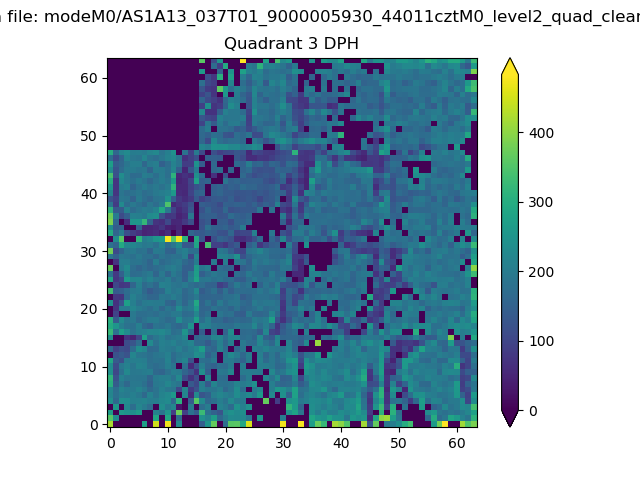 |
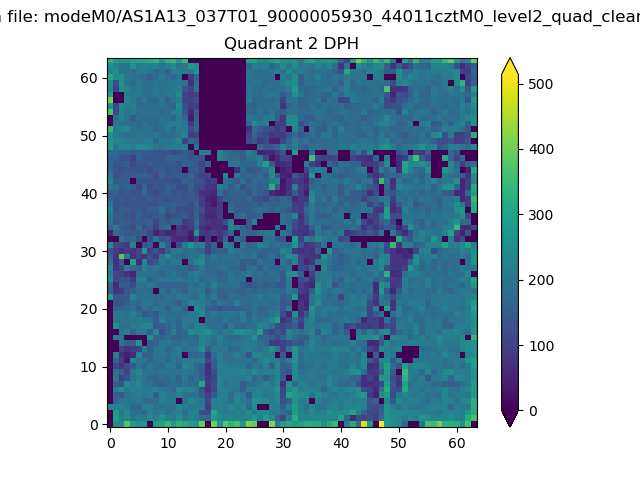 |
Quadrant C |
| Plot type | Count rate plots | Images |
|---|---|---|
| Comparison with Poisson distribution Blue bars denote a histogram of data divided into 1 sec bins. Red curve is a Poisson curve with rate = median count rate of data. |
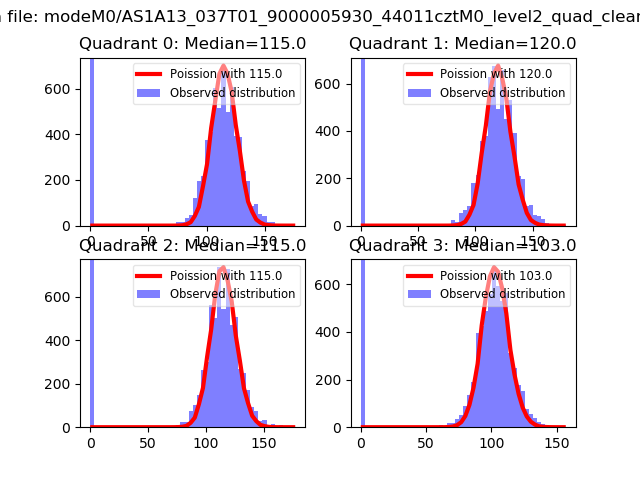 |
 |
| Quadrant-wise count rates Data is divided into 100 sec bins |
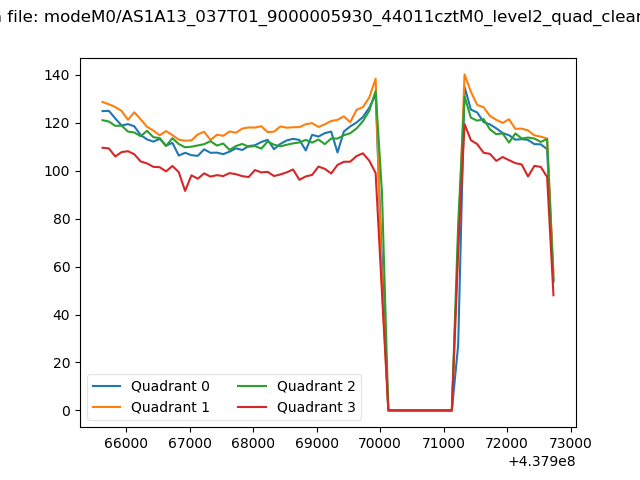 |
|
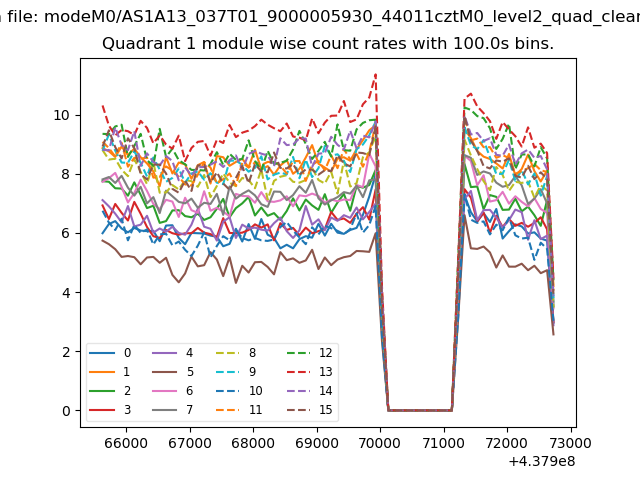
| Module-wise count rates for Quadrant A Data is divided into 100 sec bins |
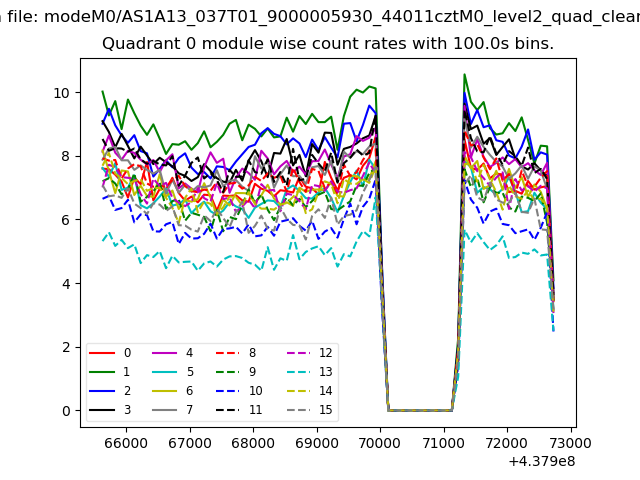 |
 |
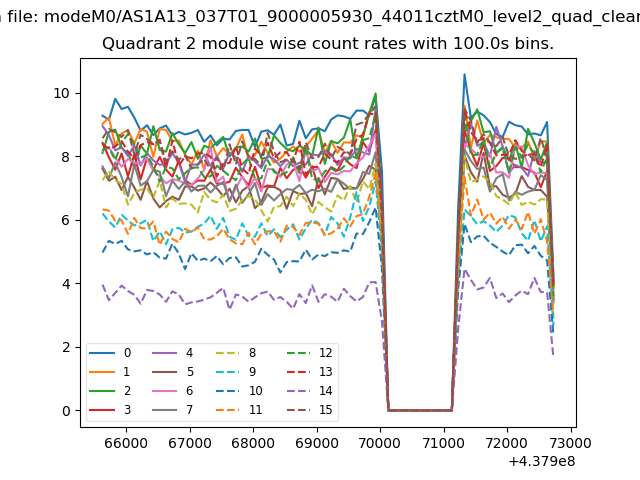
| Module-wise count rates for Quadrant B Data is divided into 100 sec bins |
 |
 |
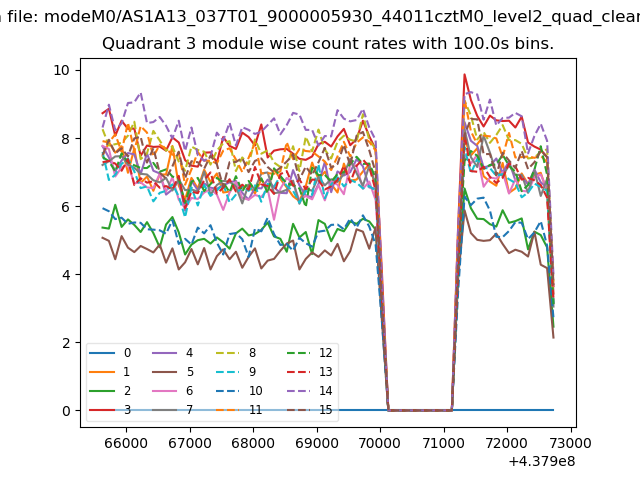
| Module-wise count rates for Quadrant C Data is divided into 100 sec bins |
 |
 |
| Module-wise count rates for Quadrant D Data is divided into 100 sec bins |
 |
 |
| Parameter | Plot |
|---|---|
| CZT HV Monitor | 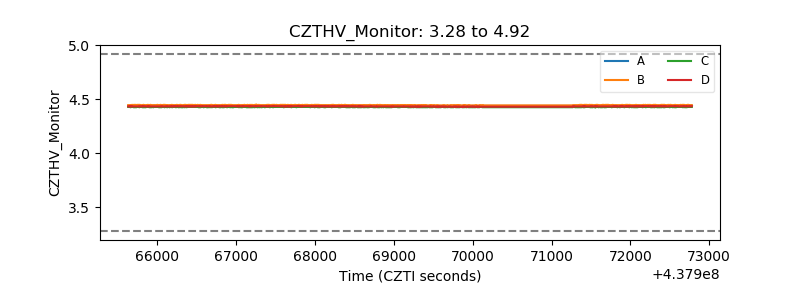 |
| D_VDD | 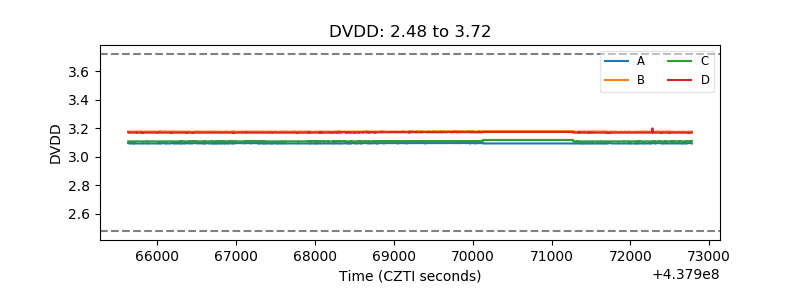 |
| Temperature 1 | 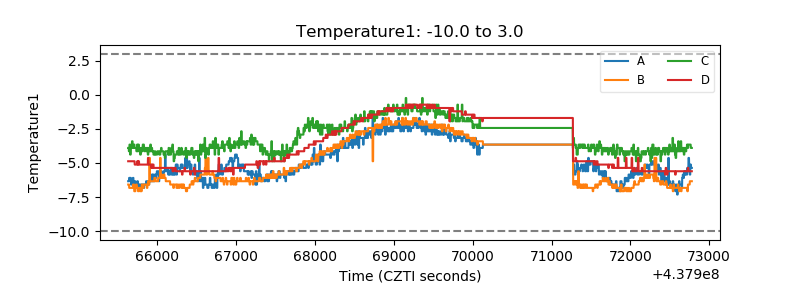 |
| Veto HV Monitor | 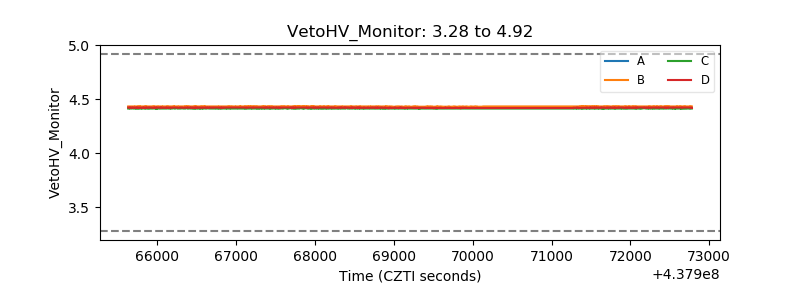 |
| Veto LLD | 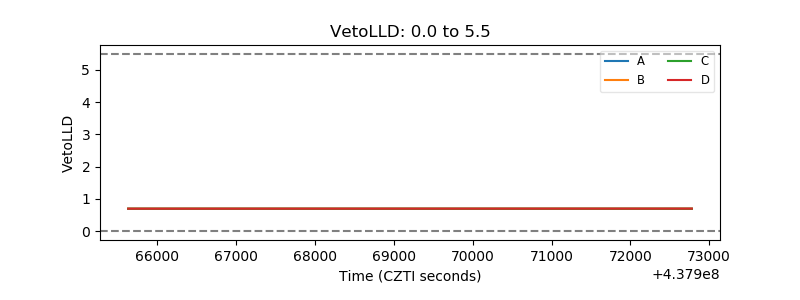 |
| Alpha Counter | 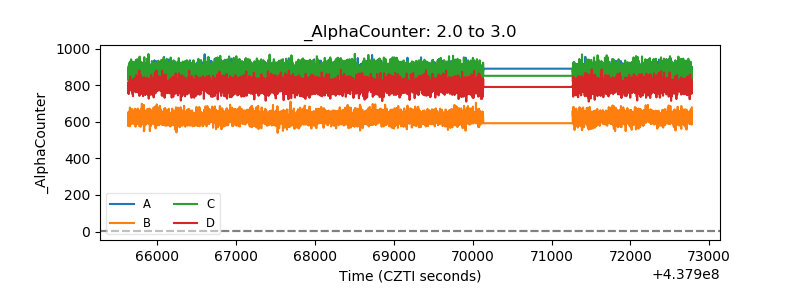 |
| _CPM_Rate | 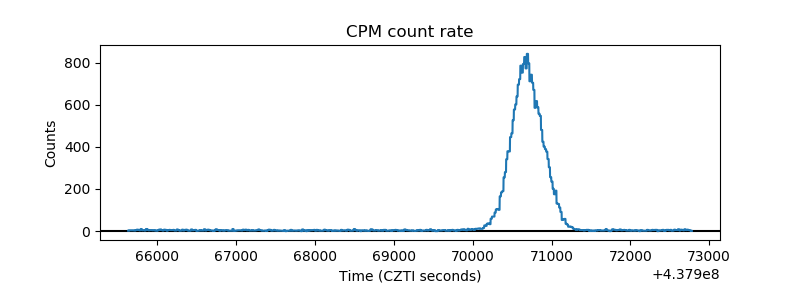 |
| CZT Counter | 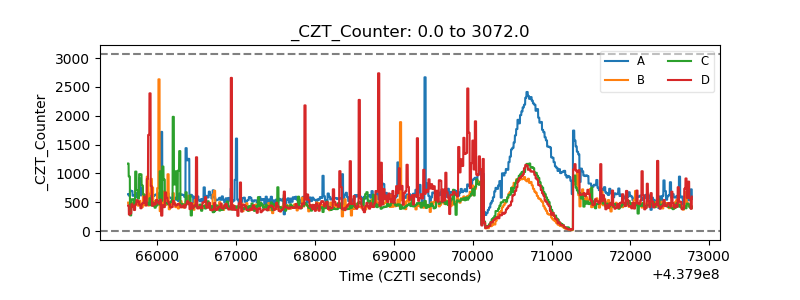 |
| +2.5 Volts monitor | 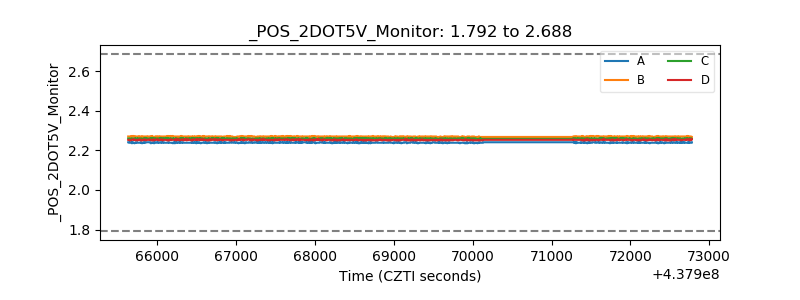 |
| +5 Volts monitor | 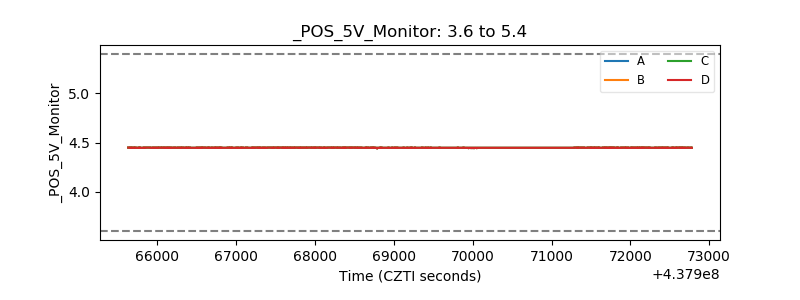 |
| _ROLL_ROT | 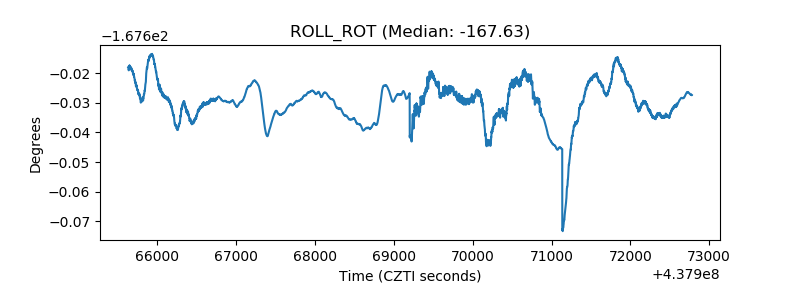 |
| _Roll_DEC | 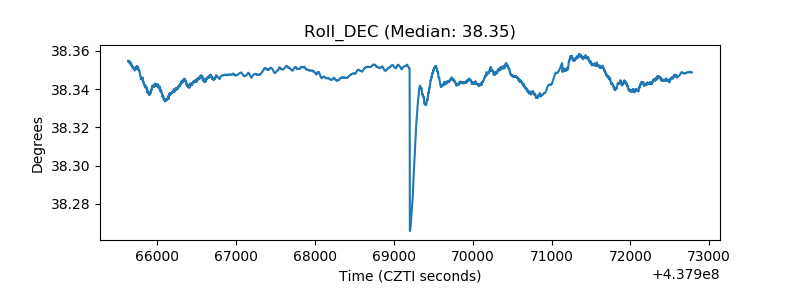 |
| _Roll_RA | 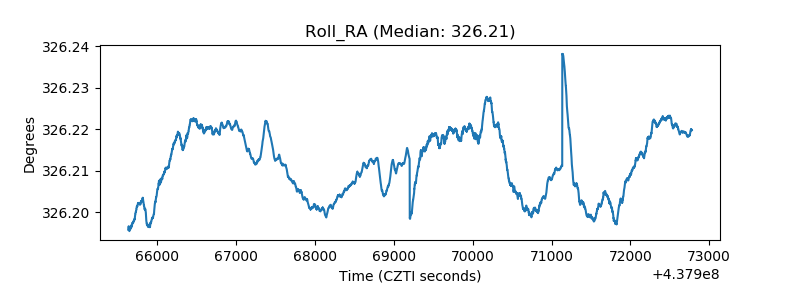 |
| Veto Counter | 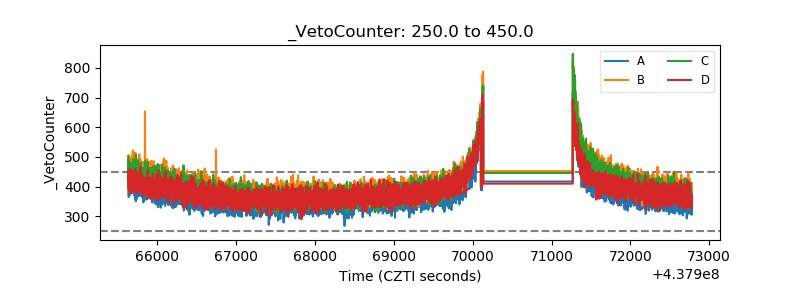 |