| Param | Original file | Final file |
|---|---|---|
| Filename | modeM0/AS1A13_037T01_9000005930_44012cztM0_level2.fits | modeM0/AS1A13_037T01_9000005930_44012cztM0_level2_quad_clean.evt |
| Size (bytes) | 469,768,320 | 112,109,760 |
| Size | 448.0 MB | 106.9 MB |
| Events in quadrant A | 5,096,104 | 723,664 |
| Events in quadrant B | 3,337,065 | 785,609 |
| Events in quadrant C | 3,265,619 | 761,521 |
| Events in quadrant D | 5,162,513 | 650,317 |
| Mode SS | |||
|---|---|---|---|
| Quadrant | BADHDUFLAG | Total packets | Discarded packets |
| A | 0 | 138 | 0 |
| B | 0 | 138 | 0 |
| C | 0 | 138 | 0 |
| D | 0 | 138 | 0 |
| Mode M0 | |||
|---|---|---|---|
| Quadrant | BADHDUFLAG | Total packets | Discarded packets |
| A | 0 | 19831 | 2 |
| B | 0 | 14397 | 2 |
| C | 0 | 14384 | 3 |
| D | 0 | 20062 | 14 |
| Mode M9 | |||
|---|---|---|---|
| Quadrant | BADHDUFLAG | Total packets | Discarded packets |
| A | 0 | 15 | 0 |
| B | 0 | 16 | 0 |
| C | 0 | 16 | 0 |
| D | 0 | 16 | 0 |
| Quadrant | Total seconds | Saturated seconds | Saturation percentage |
|---|---|---|---|
| A | 6796 | 412 | 6.062390% |
| B | 6796 | 141 | 2.074750% |
| C | 6795 | 73 | 1.074319% |
| D | 6792 | 517 | 7.611896% |
Noise dominated data is calculated using 1-second bins in cleaned event files. If a bin has >2000 counts, and if more than 50% of those come from <1% of pixels, then it is considered to be noise-dominated and hence unusable.
| Quadrant | # 1 sec bins | Bins with >0 counts | Bins with >2000 counts | High rate bins dominated by noise | Noise dominated (total time) | Noise dominated (detector-on time) | Marked lightcurve |
|---|---|---|---|---|---|---|---|
| A | 7806 | 6797 | 173 | 173 | 2.22% | 2.55% | 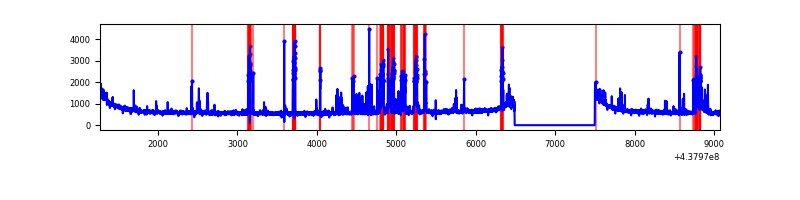 |
| B | 7806 | 6797 | 5 | 5 | 0.06% | 0.07% | 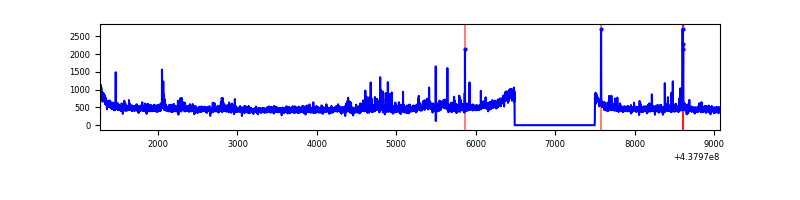 |
| C | 7805 | 6796 | 2 | 2 | 0.03% | 0.03% | 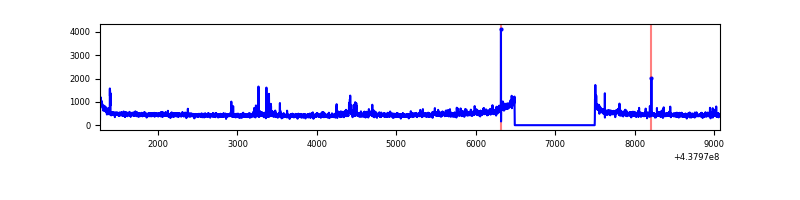 |
| D | 7805 | 6794 | 403 | 403 | 5.16% | 5.93% | 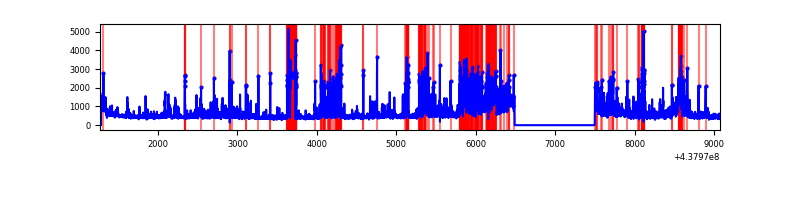 |
Top three noisy pixels from each quadrant. If the there are fewer than three noisy pixels in the level2.evt file, extra rows are filled as -1
| Pixel properties | Quadrant properties | ||||||
|---|---|---|---|---|---|---|---|
| Quadrant | DetID | PixID | Counts | Sigma | Mean | Median | Sigma |
| A | 10 | 83 | 1268569 | 7885.87 | 775 | 756 | 160.8 |
| A | 14 | 238 | 687964 | 4274.47 | 775 | 756 | 160.8 |
| A | 10 | 248 | 79386 | 489.08 | 775 | 756 | 160.8 |
| B | 0 | 213 | 79436 | 500.44 | 795 | 773 | 157.2 |
| B | 4 | 171 | 36366 | 226.43 | 795 | 773 | 157.2 |
| B | 10 | 244 | 33873 | 210.57 | 795 | 773 | 157.2 |
| C | 3 | 233 | 127027 | 695.74 | 778 | 783 | 181.5 |
| C | 14 | 254 | 85785 | 468.45 | 778 | 783 | 181.5 |
| C | 2 | 14 | 12489 | 64.51 | 778 | 783 | 181.5 |
| D | 1 | 52 | 1181334 | 6326.92 | 746 | 722 | 186.6 |
| D | 13 | 249 | 332093 | 1775.82 | 746 | 722 | 186.6 |
| D | 5 | 222 | 306623 | 1639.33 | 746 | 722 | 186.6 |
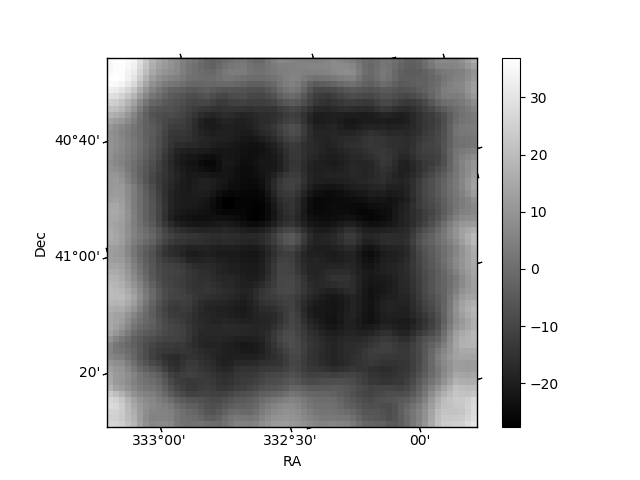
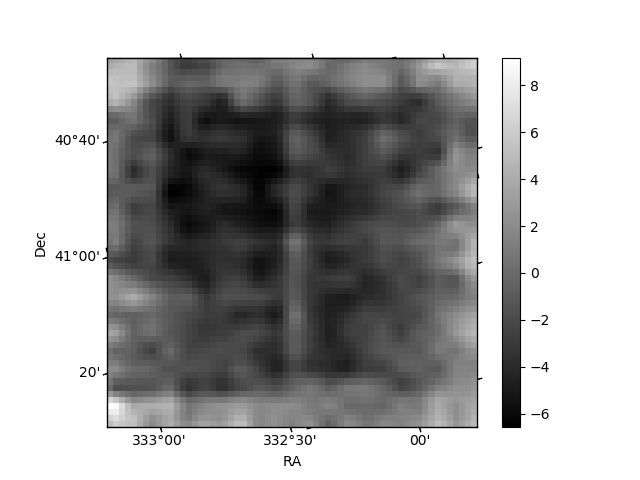
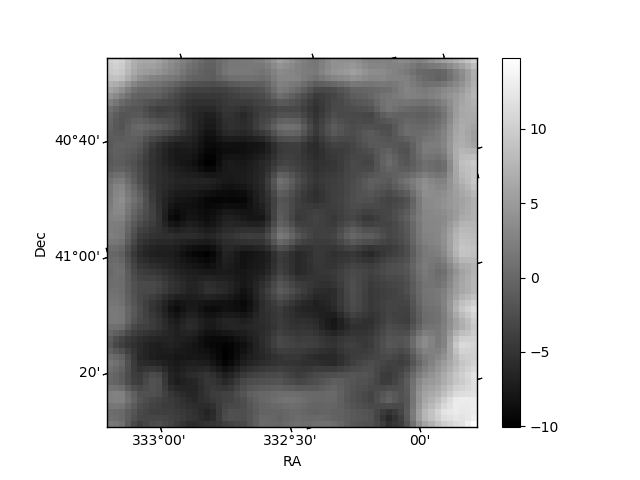
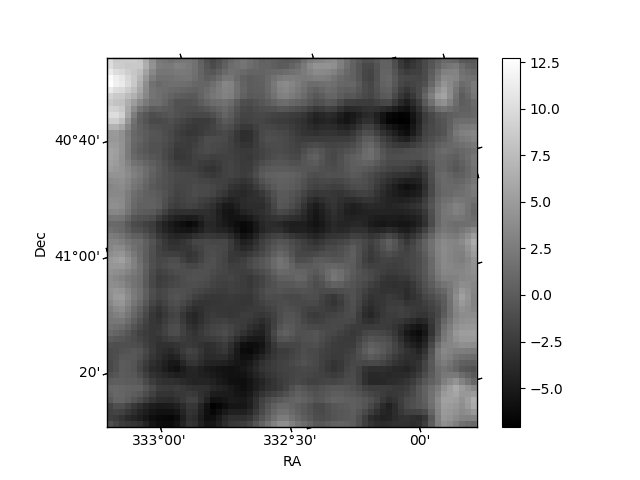
Histogram calculated using DETX and DETY for each event in the final _common_clean file
| Quadrant A | 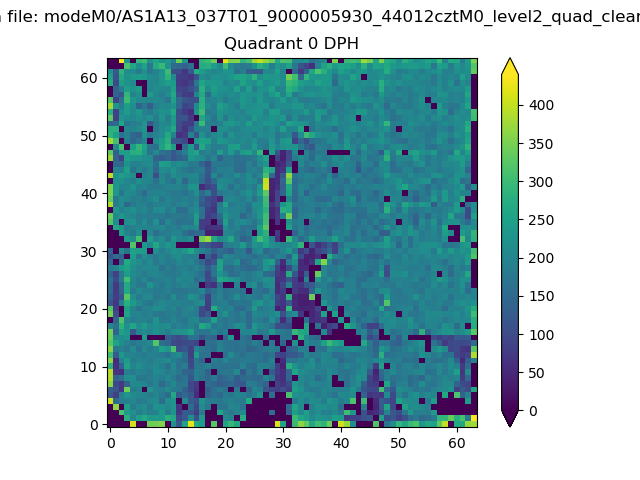 |
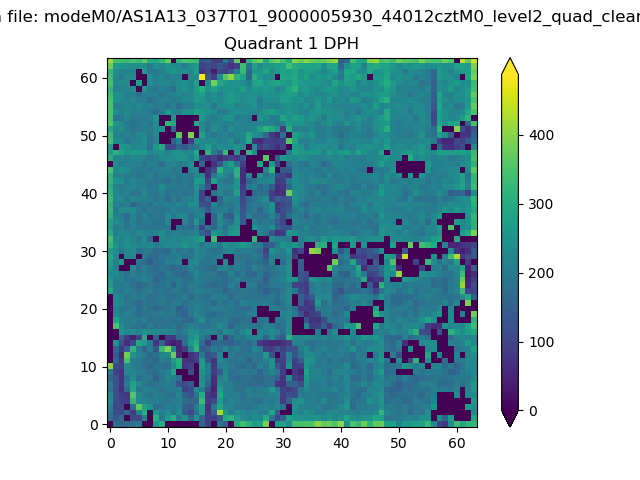 |
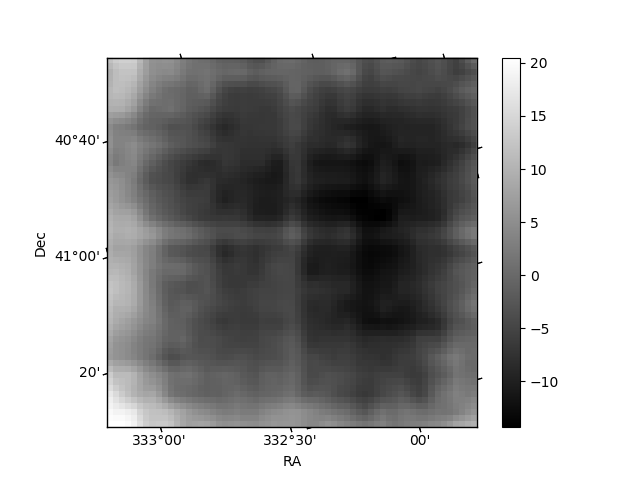
Quadrant B |
|---|---|---|---|
| Quadrant D | 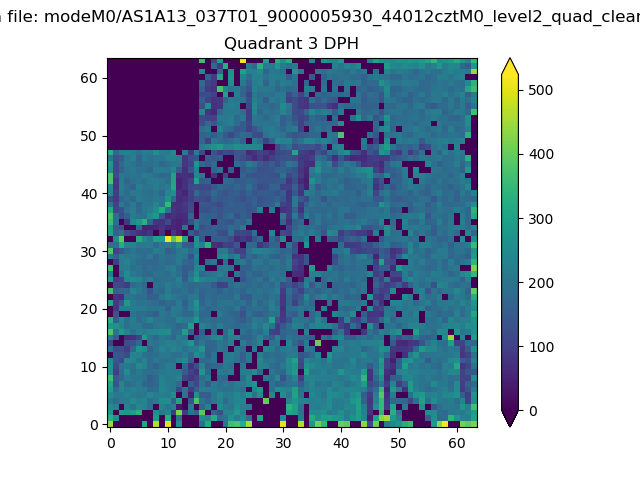 |
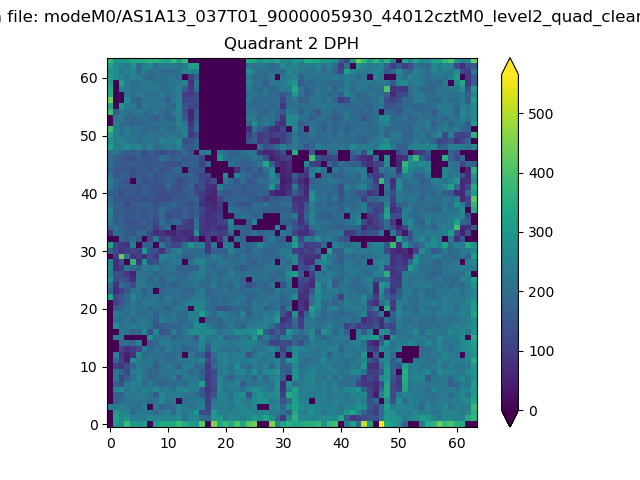 |
Quadrant C |
| Plot type | Count rate plots | Images |
|---|---|---|
| Comparison with Poisson distribution Blue bars denote a histogram of data divided into 1 sec bins. Red curve is a Poisson curve with rate = median count rate of data. |
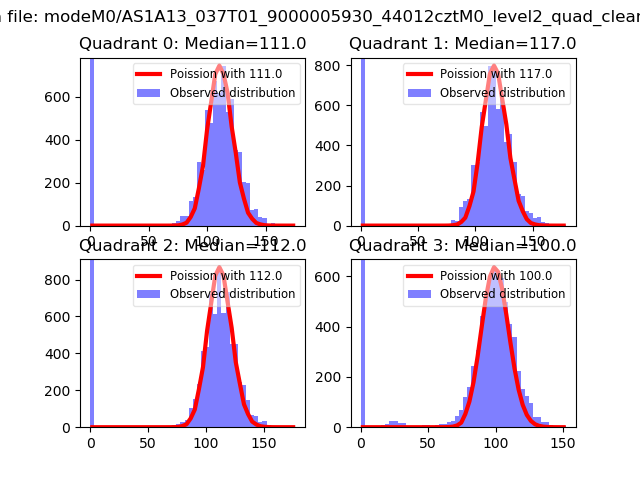 |
 |
| Quadrant-wise count rates Data is divided into 100 sec bins |
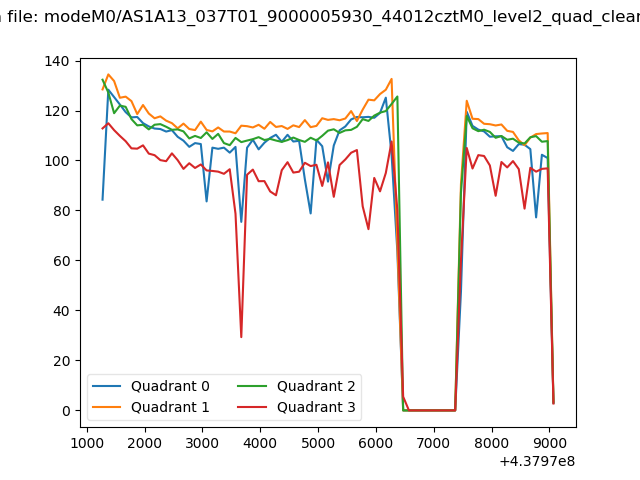 |
|
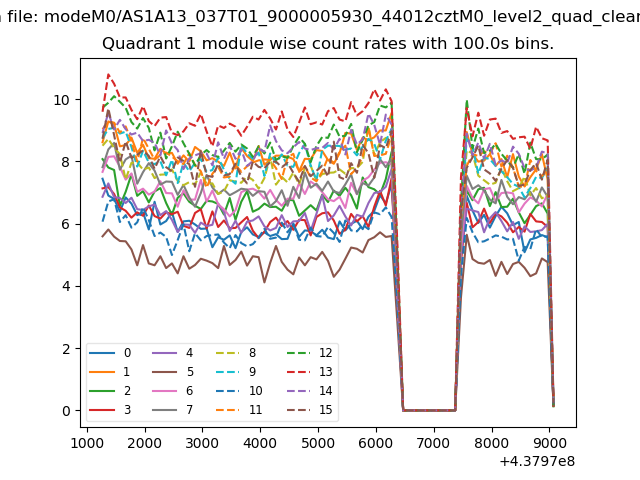
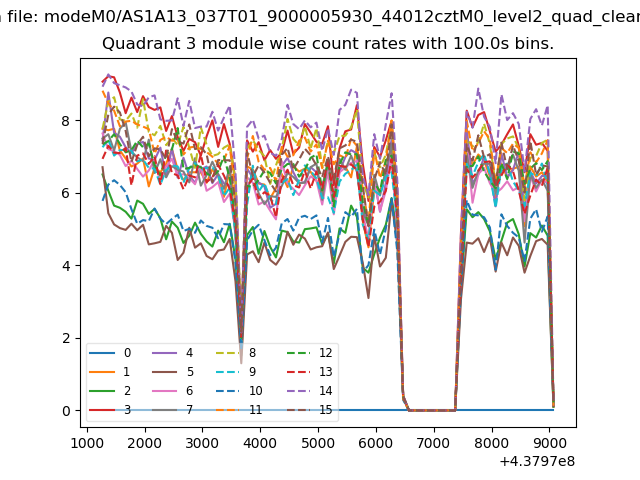
| Module-wise count rates for Quadrant A Data is divided into 100 sec bins |
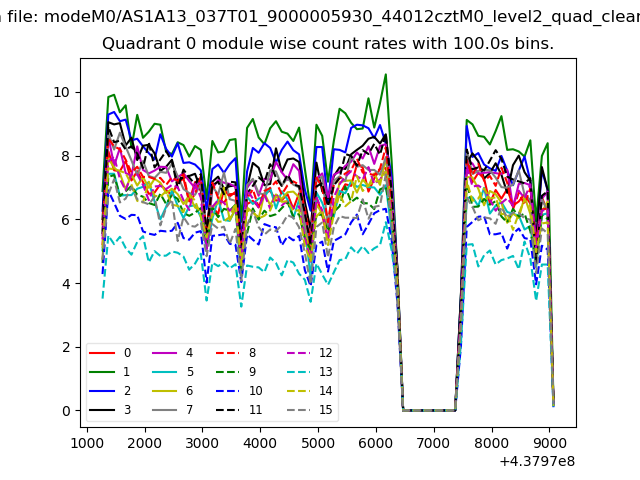 |
 |
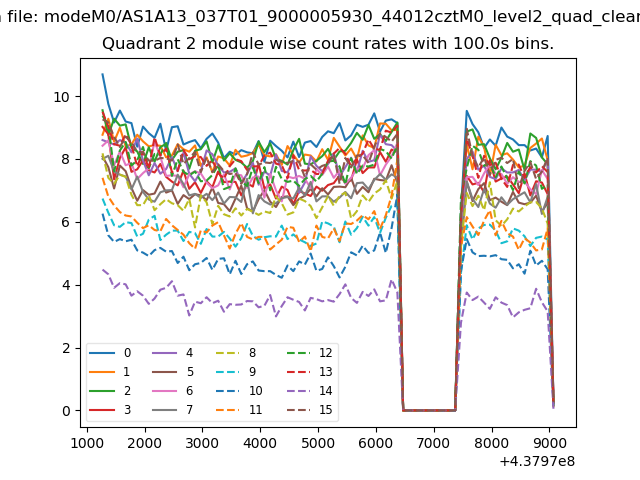
| Module-wise count rates for Quadrant B Data is divided into 100 sec bins |
 |
 |
| Module-wise count rates for Quadrant C Data is divided into 100 sec bins |
 |
 |
| Module-wise count rates for Quadrant D Data is divided into 100 sec bins |
 |
 |
| Parameter | Plot |
|---|---|
| CZT HV Monitor | 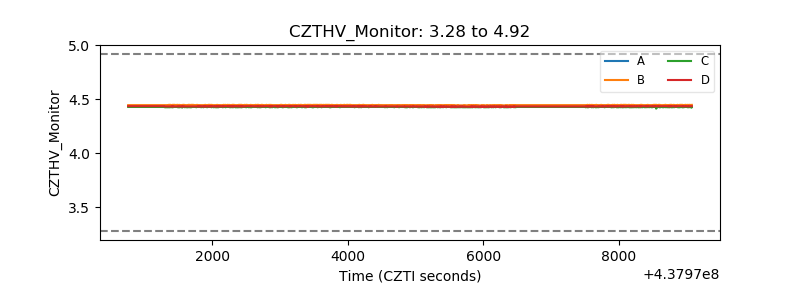 |
| D_VDD | 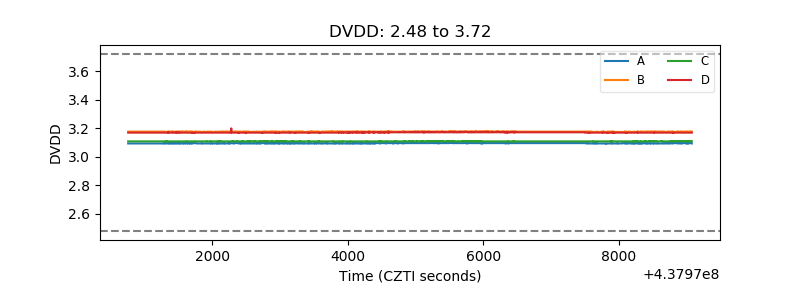 |
| Temperature 1 | 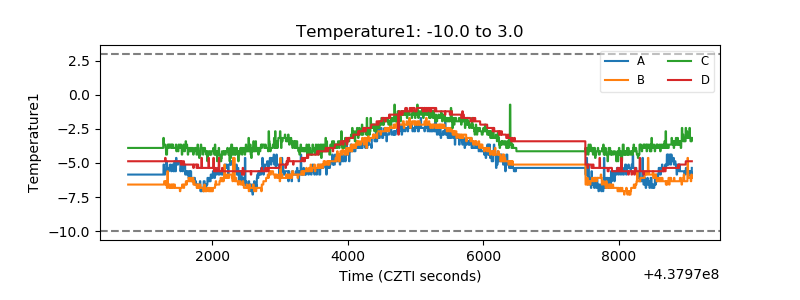 |
| Veto HV Monitor | 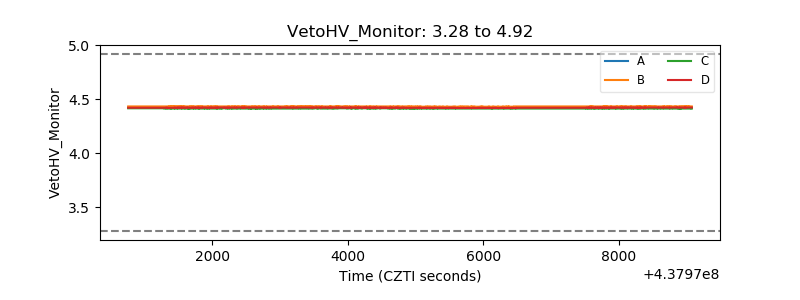 |
| Veto LLD | 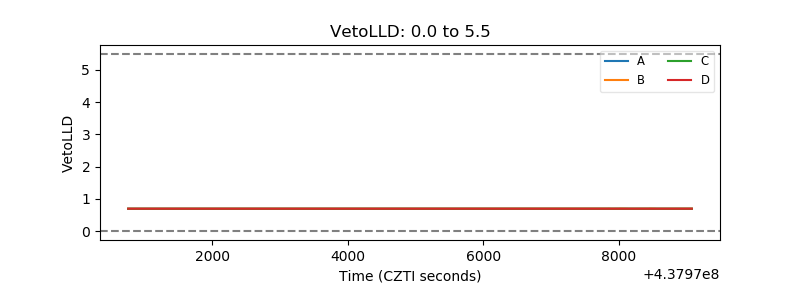 |
| Alpha Counter | 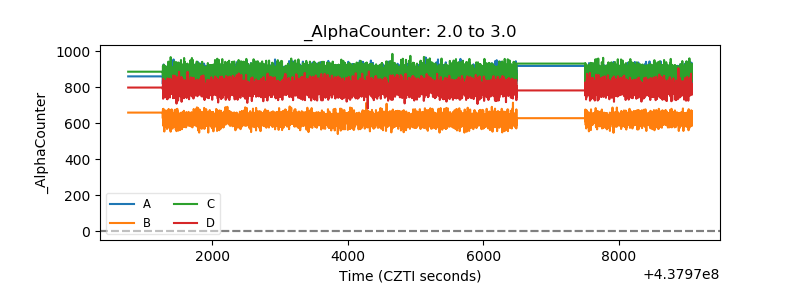 |
| _CPM_Rate | 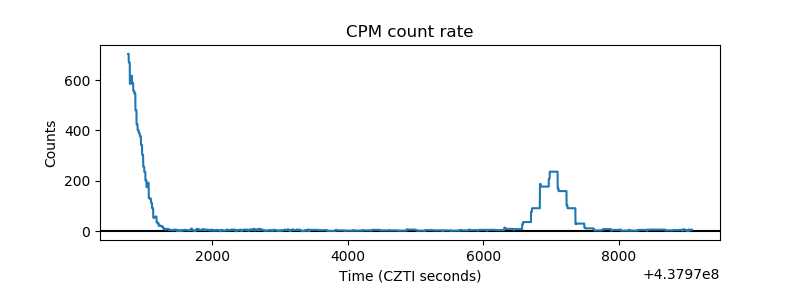 |
| CZT Counter | 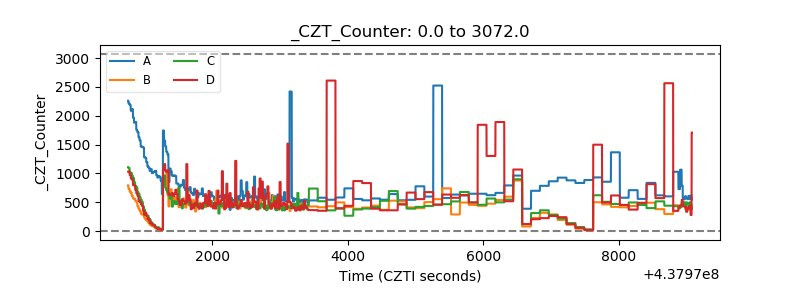 |
| +2.5 Volts monitor |  |
| +5 Volts monitor | 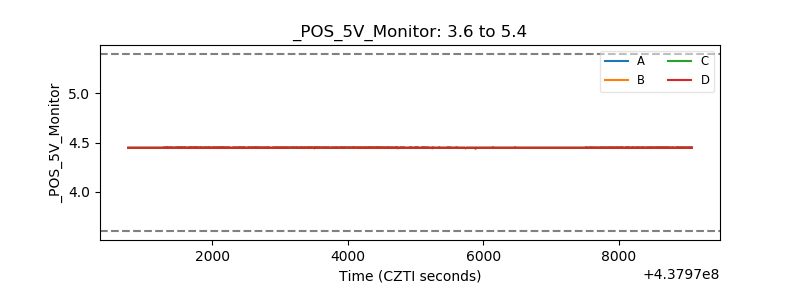 |
| _ROLL_ROT | 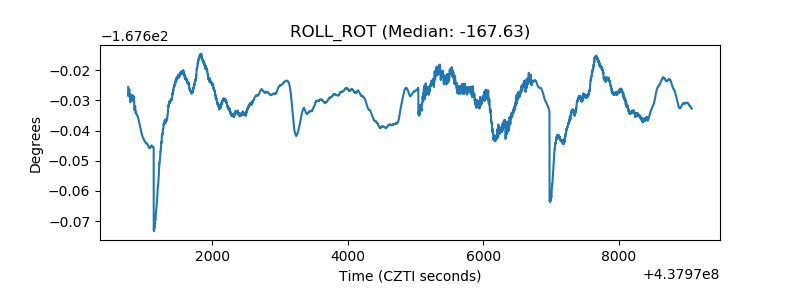 |
| _Roll_DEC | 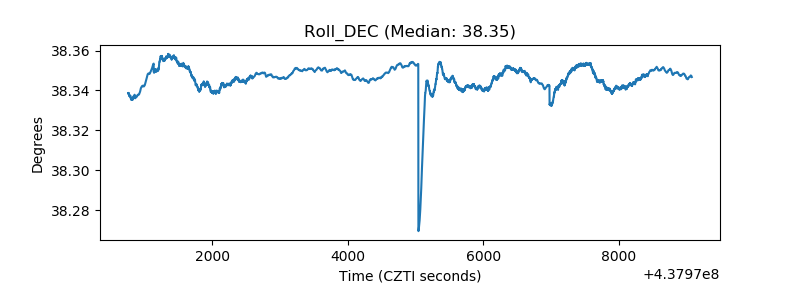 |
| _Roll_RA | 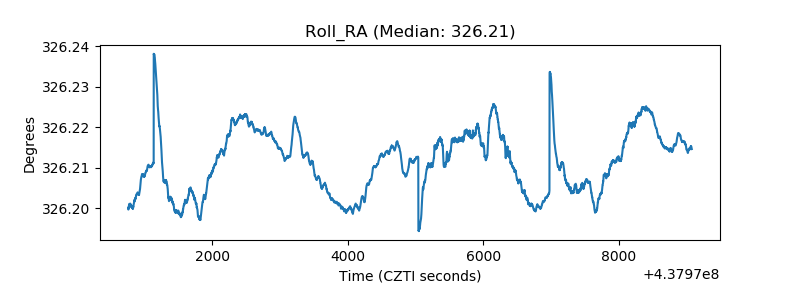 |
| Veto Counter | 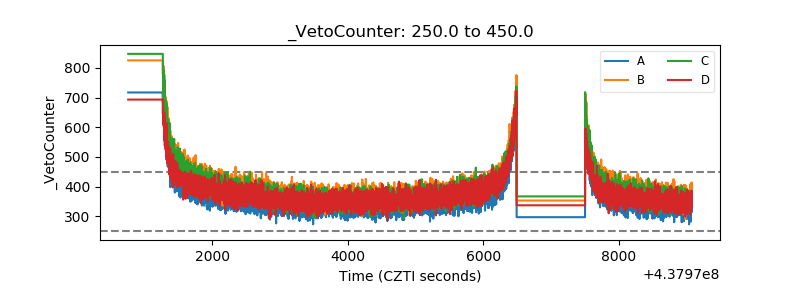 |