| Param | Original file | Final file |
|---|---|---|
| Filename | modeM0/AS1A13_037T01_9000005930_44013cztM0_level2.fits | modeM0/AS1A13_037T01_9000005930_44013cztM0_level2_quad_clean.evt |
| Size (bytes) | 470,462,400 | 112,930,560 |
| Size | 448.7 MB | 107.7 MB |
| Events in quadrant A | 5,475,077 | 713,630 |
| Events in quadrant B | 3,388,461 | 784,214 |
| Events in quadrant C | 3,346,468 | 759,040 |
| Events in quadrant D | 4,657,794 | 672,158 |
| Mode SS | |||
|---|---|---|---|
| Quadrant | BADHDUFLAG | Total packets | Discarded packets |
| A | 0 | 144 | 0 |
| B | 0 | 144 | 0 |
| C | 0 | 144 | 0 |
| D | 0 | 144 | 0 |
| Mode M0 | |||
|---|---|---|---|
| Quadrant | BADHDUFLAG | Total packets | Discarded packets |
| A | 0 | 21065 | 3 |
| B | 0 | 14862 | 4 |
| C | 0 | 14905 | 3 |
| D | 0 | 18687 | 3 |
| Mode M9 | |||
|---|---|---|---|
| Quadrant | BADHDUFLAG | Total packets | Discarded packets |
| A | 0 | 6 | 0 |
| B | 0 | 7 | 0 |
| C | 0 | 7 | 0 |
| D | 0 | 7 | 0 |
| Quadrant | Total seconds | Saturated seconds | Saturation percentage |
|---|---|---|---|
| A | 7040 | 524 | 7.443182% |
| B | 7039 | 175 | 2.486149% |
| C | 7039 | 116 | 1.647961% |
| D | 7039 | 293 | 4.162523% |
Noise dominated data is calculated using 1-second bins in cleaned event files. If a bin has >2000 counts, and if more than 50% of those come from <1% of pixels, then it is considered to be noise-dominated and hence unusable.
| Quadrant | # 1 sec bins | Bins with >0 counts | Bins with >2000 counts | High rate bins dominated by noise | Noise dominated (total time) | Noise dominated (detector-on time) | Marked lightcurve |
|---|---|---|---|---|---|---|---|
| A | 7695 | 7042 | 258 | 258 | 3.35% | 3.66% | 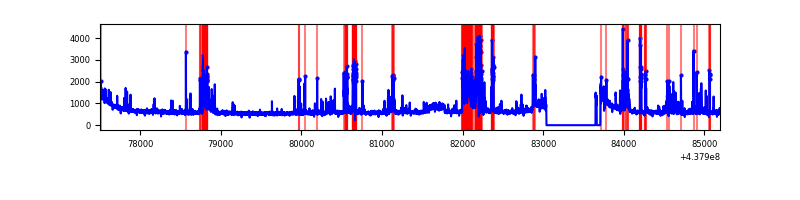 |
| B | 7694 | 7041 | 7 | 7 | 0.09% | 0.10% | 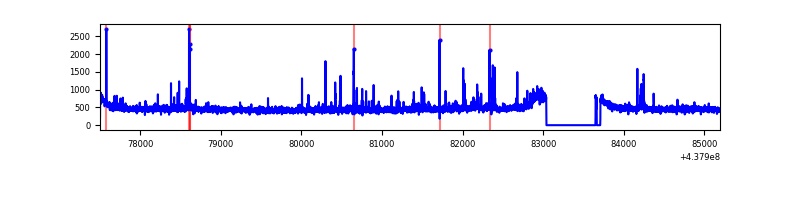 |
| C | 7694 | 7041 | 11 | 11 | 0.14% | 0.16% | 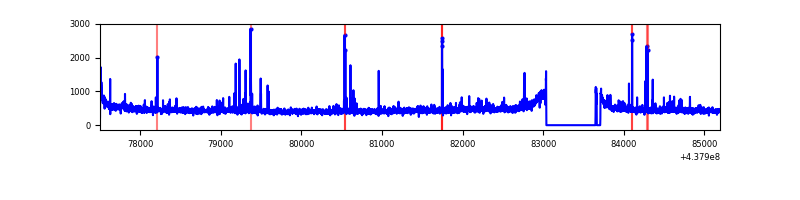 |
| D | 7694 | 7041 | 173 | 173 | 2.25% | 2.46% | 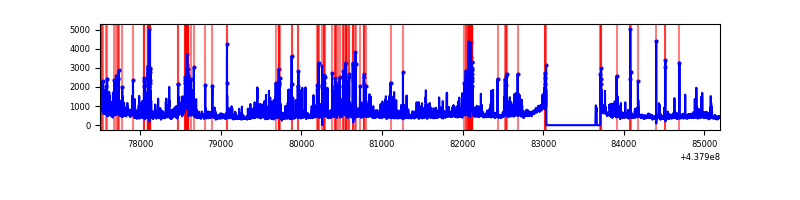 |
Top three noisy pixels from each quadrant. If the there are fewer than three noisy pixels in the level2.evt file, extra rows are filled as -1
| Pixel properties | Quadrant properties | ||||||
|---|---|---|---|---|---|---|---|
| Quadrant | DetID | PixID | Counts | Sigma | Mean | Median | Sigma |
| A | 10 | 83 | 1255552 | 7657.51 | 785 | 767 | 163.9 |
| A | 14 | 238 | 1084217 | 6611.91 | 785 | 767 | 163.9 |
| A | 15 | 223 | 69958 | 422.25 | 785 | 767 | 163.9 |
| B | 0 | 213 | 48804 | 300.65 | 806 | 781 | 159.7 |
| B | 4 | 171 | 40263 | 247.18 | 806 | 781 | 159.7 |
| B | 3 | 112 | 35096 | 214.83 | 806 | 781 | 159.7 |
| C | 14 | 254 | 112332 | 594.83 | 796 | 801 | 187.5 |
| C | 3 | 233 | 98820 | 522.77 | 796 | 801 | 187.5 |
| C | 2 | 14 | 27612 | 142.99 | 796 | 801 | 187.5 |
| D | 1 | 52 | 1078412 | 5517.5 | 775 | 749 | 195.3 |
| D | 7 | 80 | 170664 | 869.94 | 775 | 749 | 195.3 |
| D | 5 | 235 | 77173 | 391.28 | 775 | 749 | 195.3 |
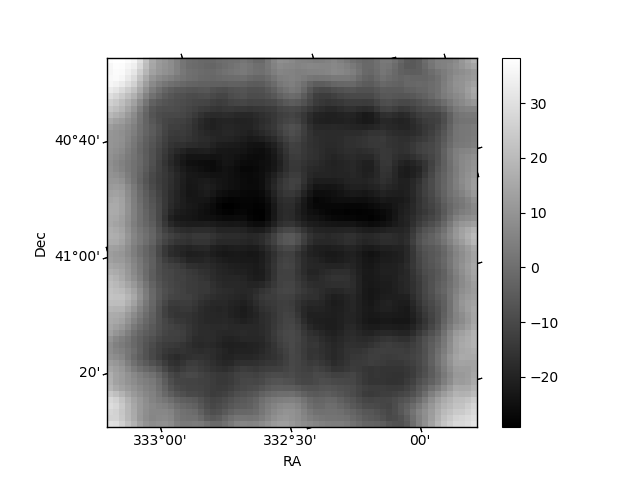
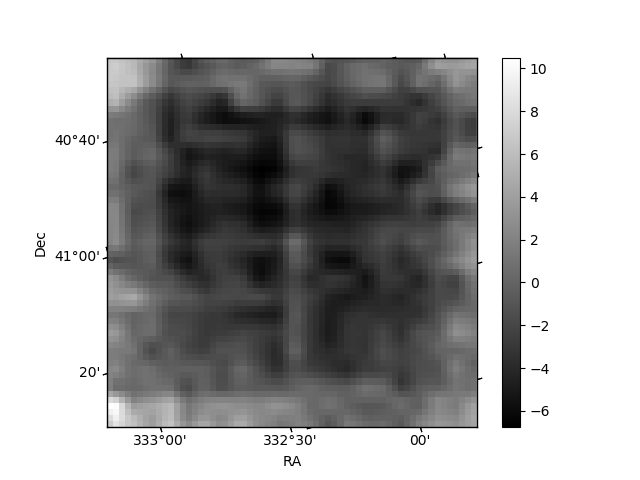
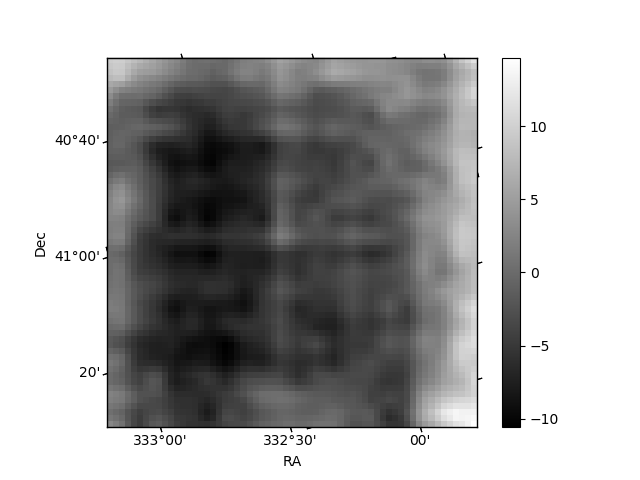
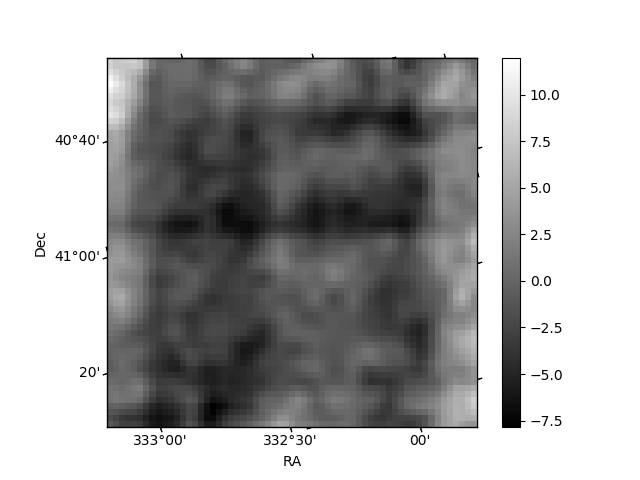
Histogram calculated using DETX and DETY for each event in the final _common_clean file
| Quadrant A | 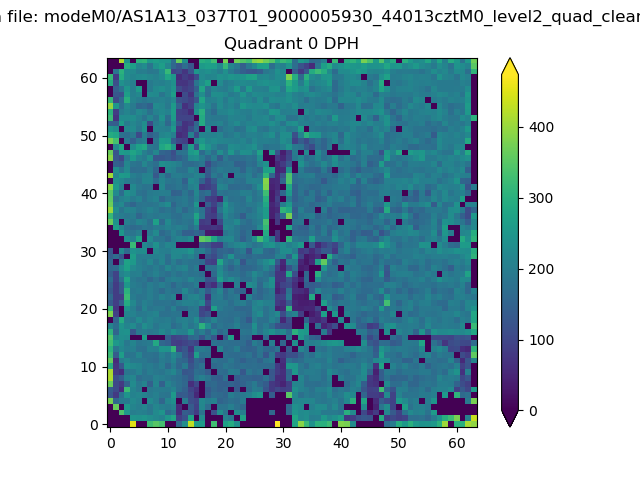 |
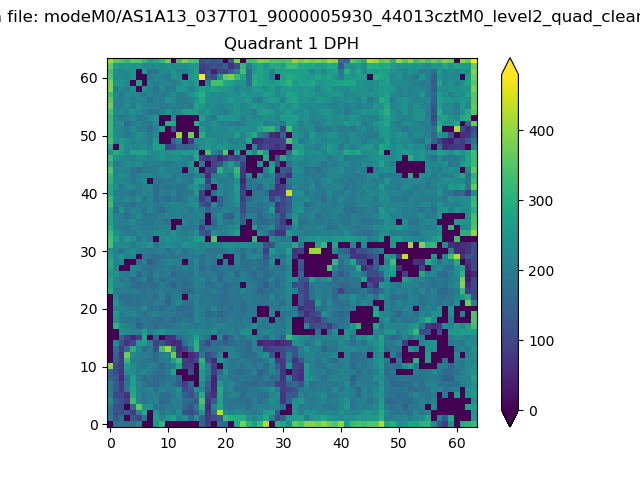 |
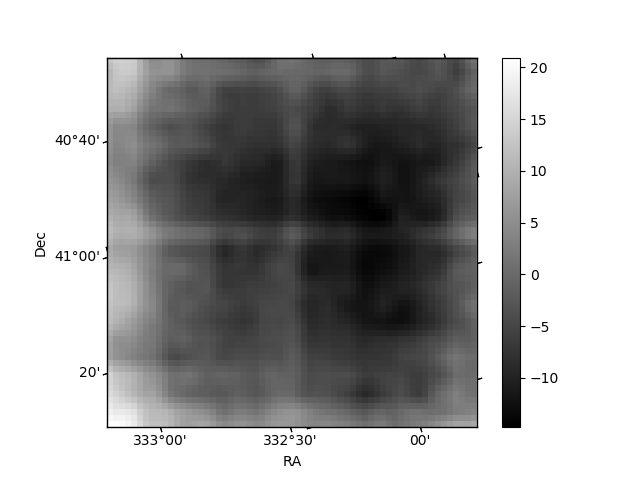
Quadrant B |
|---|---|---|---|
| Quadrant D | 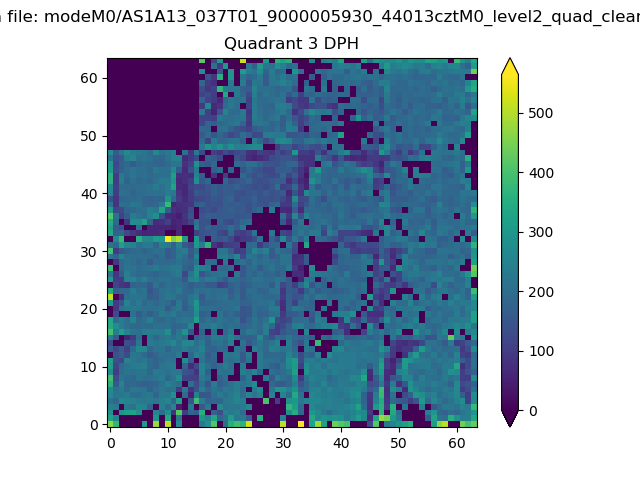 |
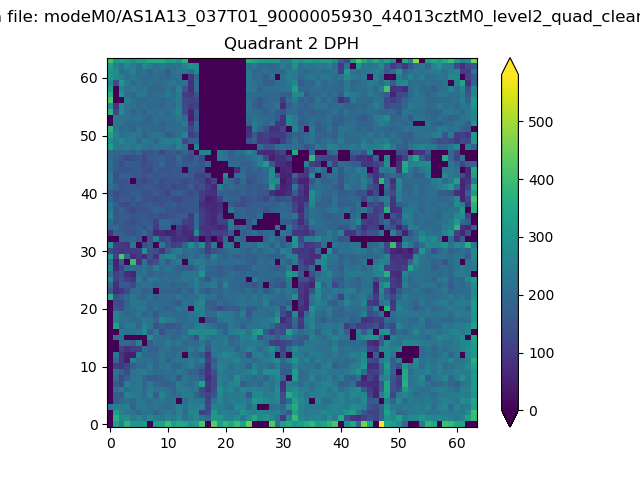 |
Quadrant C |
| Plot type | Count rate plots | Images |
|---|---|---|
| Comparison with Poisson distribution Blue bars denote a histogram of data divided into 1 sec bins. Red curve is a Poisson curve with rate = median count rate of data. |
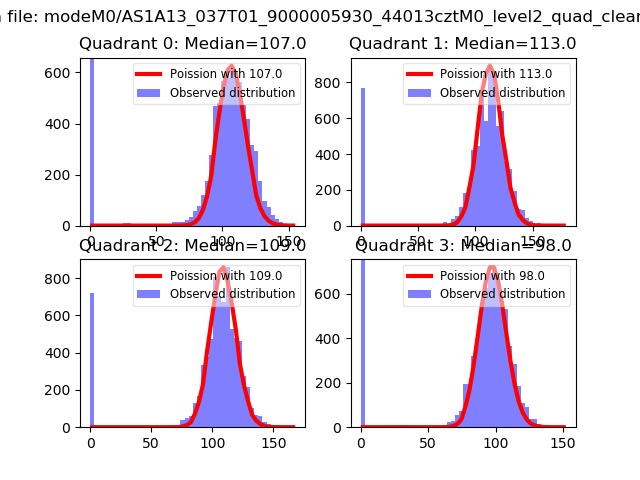 |
 |
| Quadrant-wise count rates Data is divided into 100 sec bins |
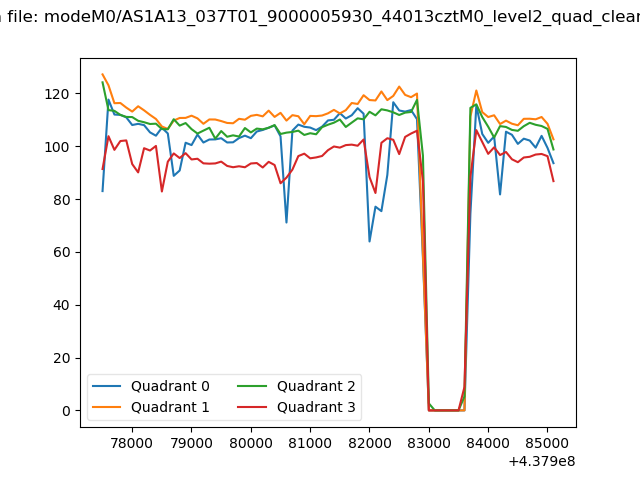 |
|
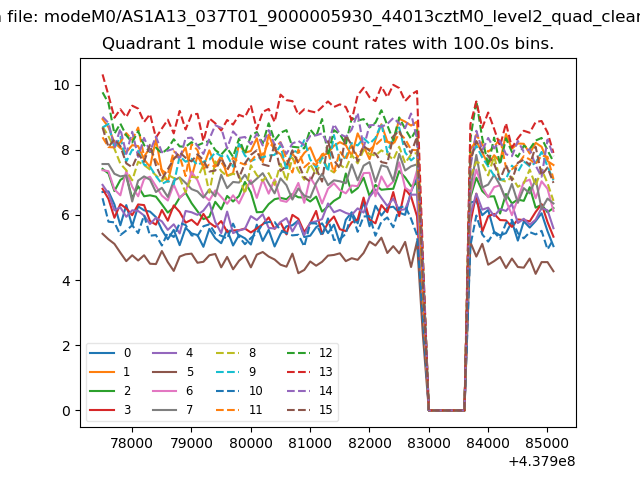
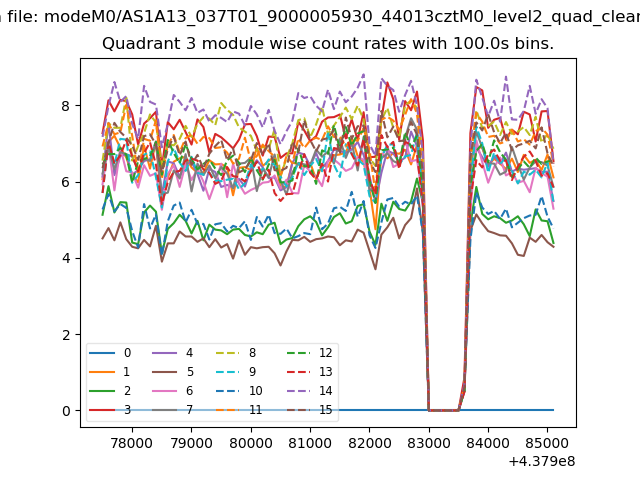
| Module-wise count rates for Quadrant A Data is divided into 100 sec bins |
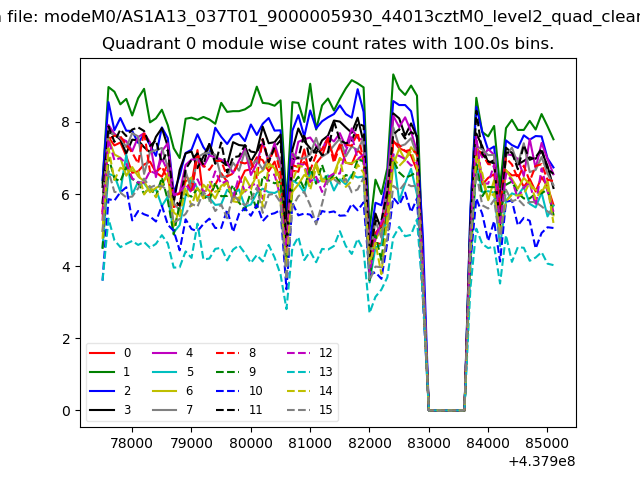 |
 |
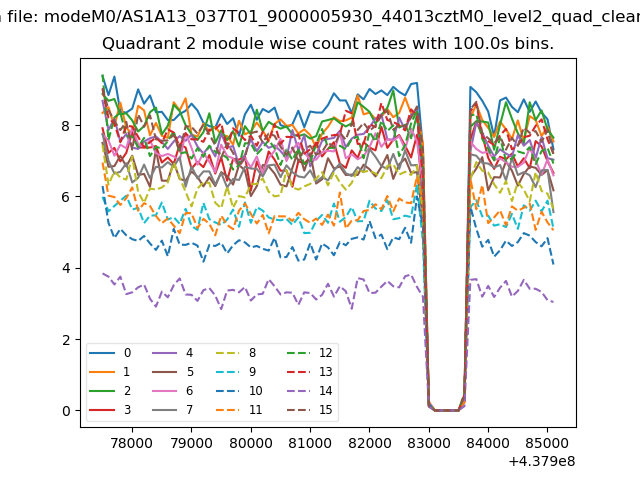
| Module-wise count rates for Quadrant B Data is divided into 100 sec bins |
 |
 |
| Module-wise count rates for Quadrant C Data is divided into 100 sec bins |
 |
 |
| Module-wise count rates for Quadrant D Data is divided into 100 sec bins |
 |
 |
| Parameter | Plot |
|---|---|
| CZT HV Monitor | 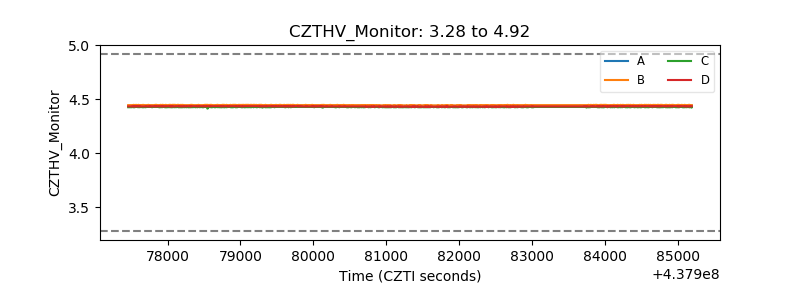 |
| D_VDD | 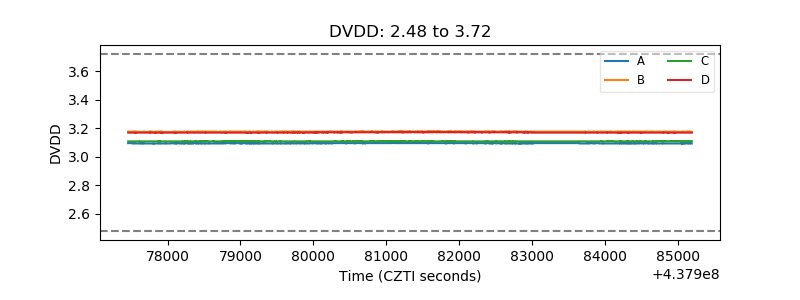 |
| Temperature 1 | 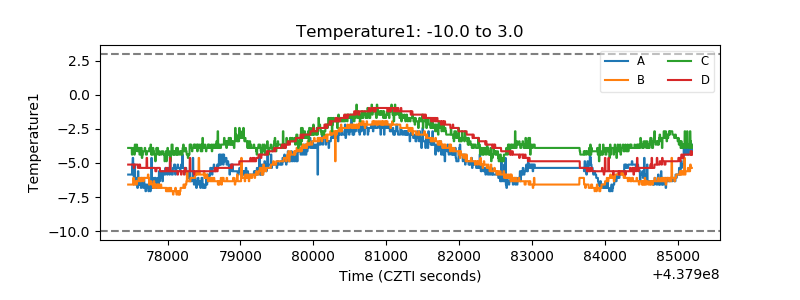 |
| Veto HV Monitor | 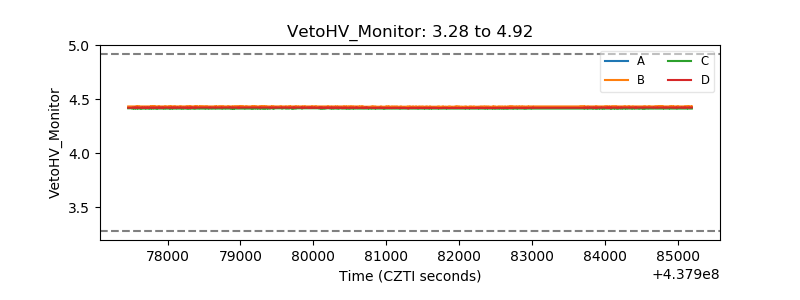 |
| Veto LLD | 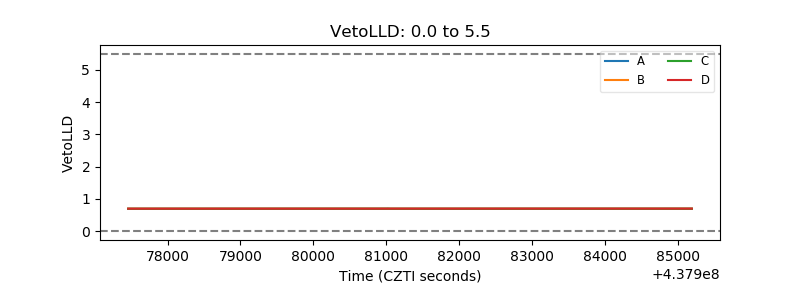 |
| Alpha Counter | 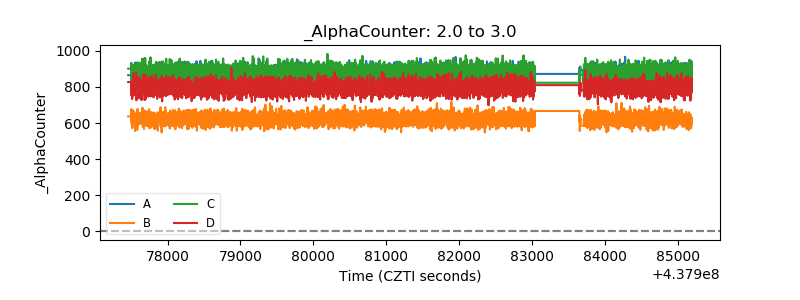 |
| _CPM_Rate | 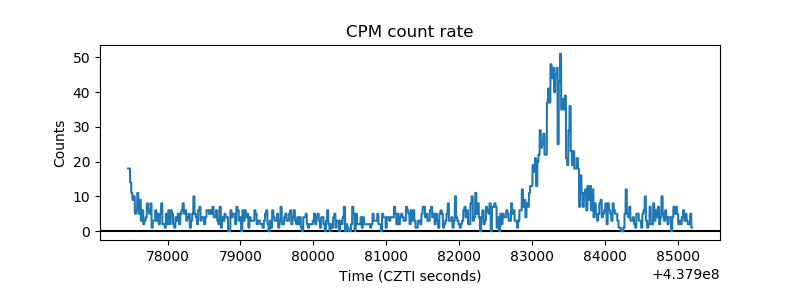 |
| CZT Counter | 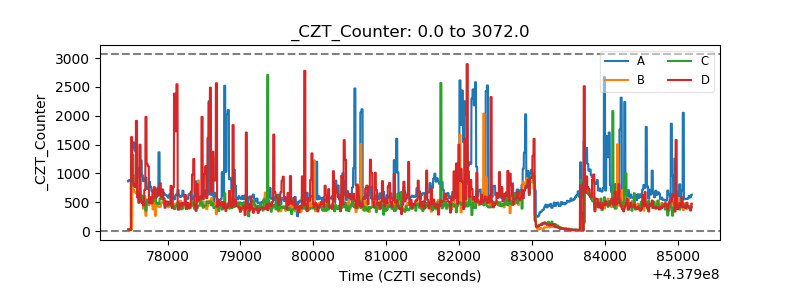 |
| +2.5 Volts monitor | 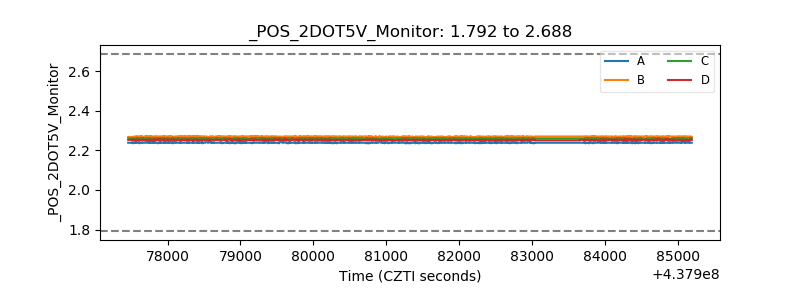 |
| +5 Volts monitor | 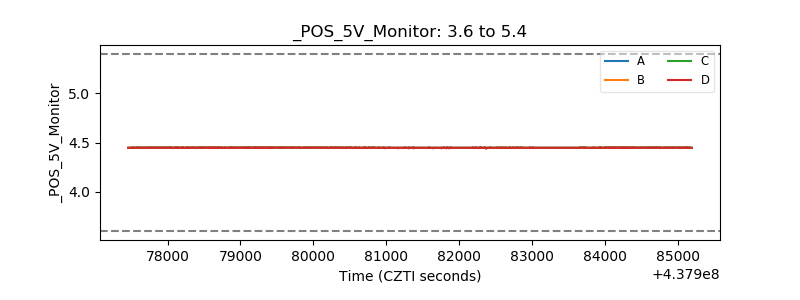 |
| _ROLL_ROT | 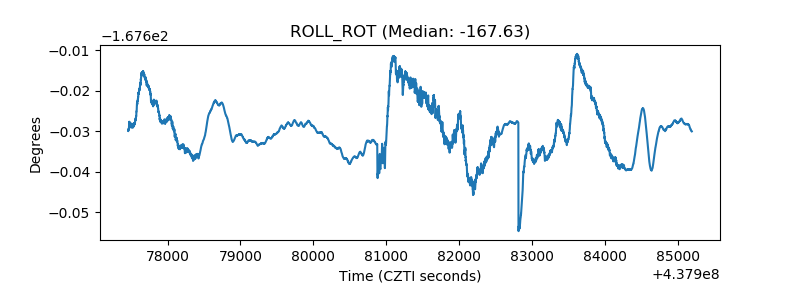 |
| _Roll_DEC | 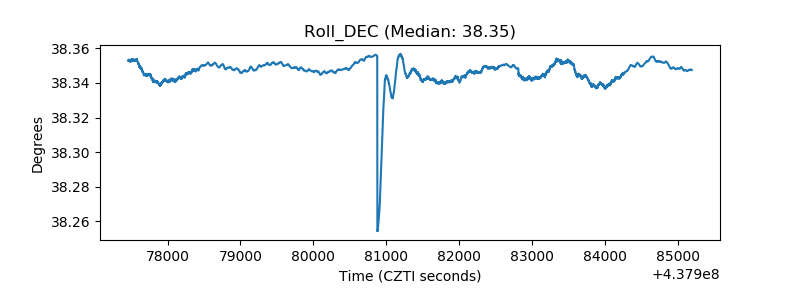 |
| _Roll_RA | 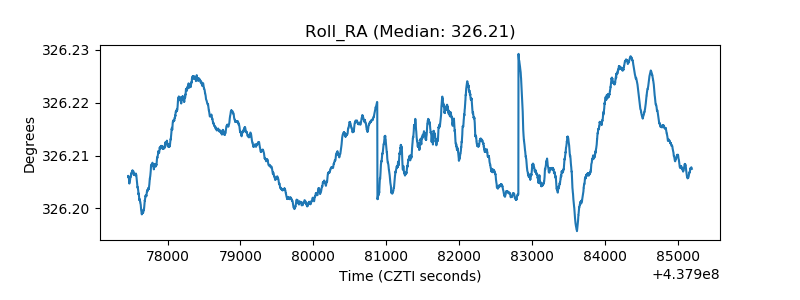 |
| Veto Counter | 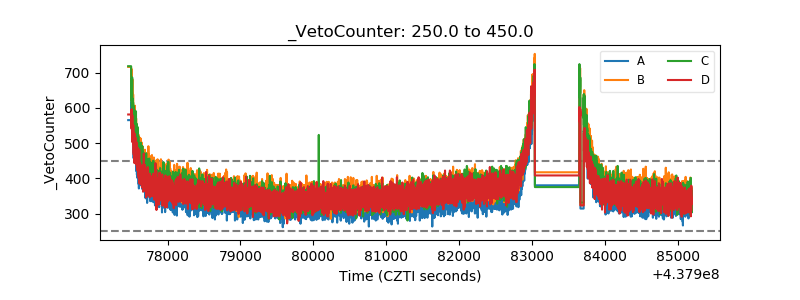 |