| Param | Original file | Final file |
|---|---|---|
| Filename | modeM0/AS1A13_037T01_9000005930_44014cztM0_level2.fits | modeM0/AS1A13_037T01_9000005930_44014cztM0_level2_quad_clean.evt |
| Size (bytes) | 254,050,560 | 61,499,520 |
| Size | 242.3 MB | 58.7 MB |
| Events in quadrant A | 2,757,032 | 390,369 |
| Events in quadrant B | 1,902,022 | 420,889 |
| Events in quadrant C | 2,315,569 | 408,563 |
| Events in quadrant D | 2,132,133 | 373,819 |
| Mode SS | |||
|---|---|---|---|
| Quadrant | BADHDUFLAG | Total packets | Discarded packets |
| A | 0 | 76 | 0 |
| B | 0 | 76 | 0 |
| C | 0 | 76 | 0 |
| D | 0 | 76 | 0 |
| Mode M0 | |||
|---|---|---|---|
| Quadrant | BADHDUFLAG | Total packets | Discarded packets |
| A | 0 | 10895 | 1 |
| B | 0 | 8217 | 2 |
| C | 0 | 9312 | 4 |
| D | 0 | 9041 | 1 |
| Quadrant | Total seconds | Saturated seconds | Saturation percentage |
|---|---|---|---|
| A | 3800 | 338 | 8.894737% |
| B | 3799 | 223 | 5.869966% |
| C | 3799 | 173 | 4.553830% |
| D | 3799 | 136 | 3.579889% |
Noise dominated data is calculated using 1-second bins in cleaned event files. If a bin has >2000 counts, and if more than 50% of those come from <1% of pixels, then it is considered to be noise-dominated and hence unusable.
| Quadrant | # 1 sec bins | Bins with >0 counts | Bins with >2000 counts | High rate bins dominated by noise | Noise dominated (total time) | Noise dominated (detector-on time) | Marked lightcurve |
|---|---|---|---|---|---|---|---|
| A | 3815 | 3801 | 57 | 57 | 1.49% | 1.50% | 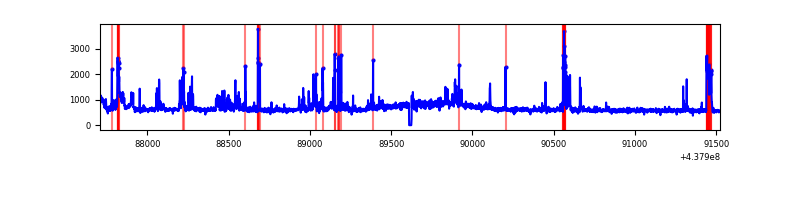 |
| B | 3815 | 3801 | 0 | 0 | 0.00% | 0.00% | 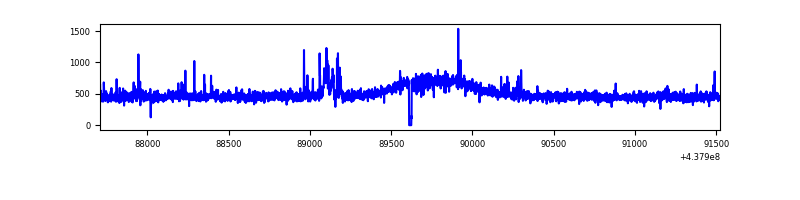 |
| C | 3814 | 3800 | 58 | 58 | 1.52% | 1.53% | 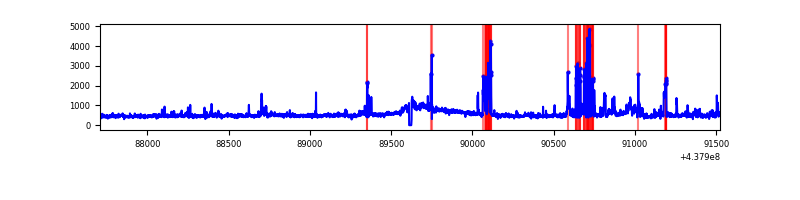 |
| D | 3814 | 3800 | 39 | 39 | 1.02% | 1.03% | 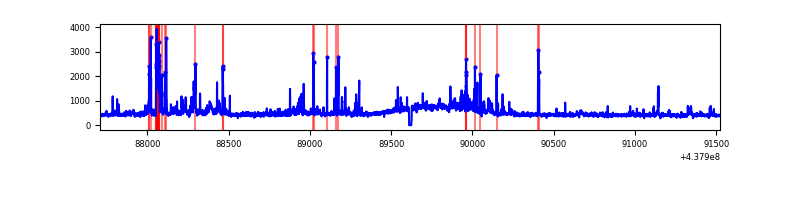 |
Top three noisy pixels from each quadrant. If the there are fewer than three noisy pixels in the level2.evt file, extra rows are filled as -1
| Pixel properties | Quadrant properties | ||||||
|---|---|---|---|---|---|---|---|
| Quadrant | DetID | PixID | Counts | Sigma | Mean | Median | Sigma |
| A | 10 | 83 | 565978 | 5827.14 | 458 | 446 | 97.1 |
| A | 14 | 238 | 381461 | 3925.91 | 458 | 446 | 97.1 |
| A | 7 | 3 | 28488 | 288.94 | 458 | 446 | 97.1 |
| B | 4 | 171 | 40980 | 429.78 | 463 | 447 | 94.3 |
| B | 12 | 111 | 12472 | 127.5 | 463 | 447 | 94.3 |
| B | 11 | 111 | 11010 | 112.0 | 463 | 447 | 94.3 |
| C | 15 | 1 | 214850 | 1967.14 | 456 | 456 | 109.0 |
| C | 3 | 233 | 167685 | 1534.39 | 456 | 456 | 109.0 |
| C | 14 | 254 | 139627 | 1276.94 | 456 | 456 | 109.0 |
| D | 13 | 171 | 194830 | 1674.6 | 453 | 437 | 116.1 |
| D | 5 | 235 | 80047 | 685.8 | 453 | 437 | 116.1 |
| D | 1 | 52 | 34994 | 297.69 | 453 | 437 | 116.1 |
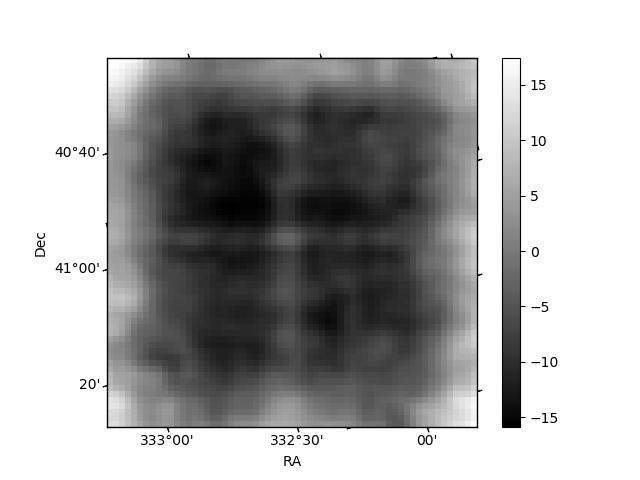
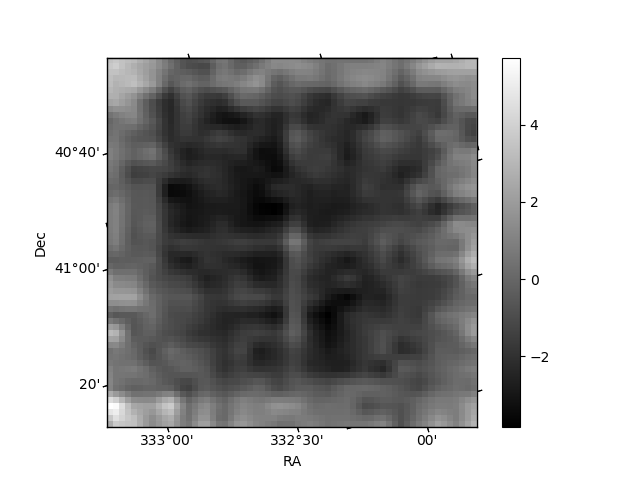
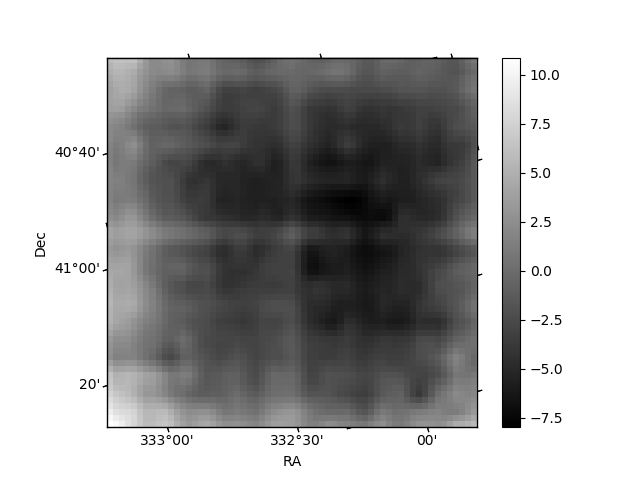
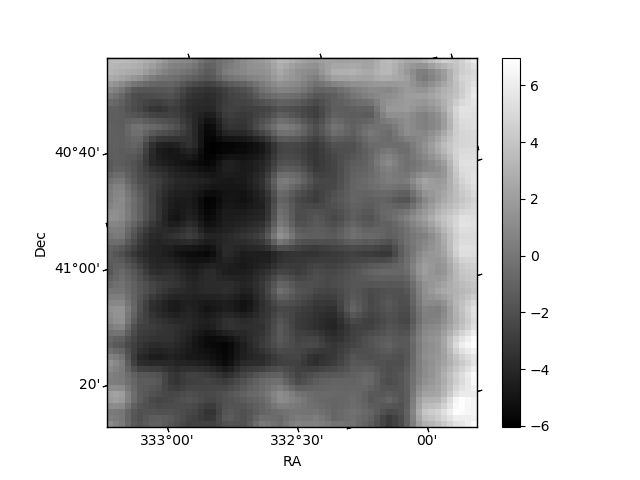
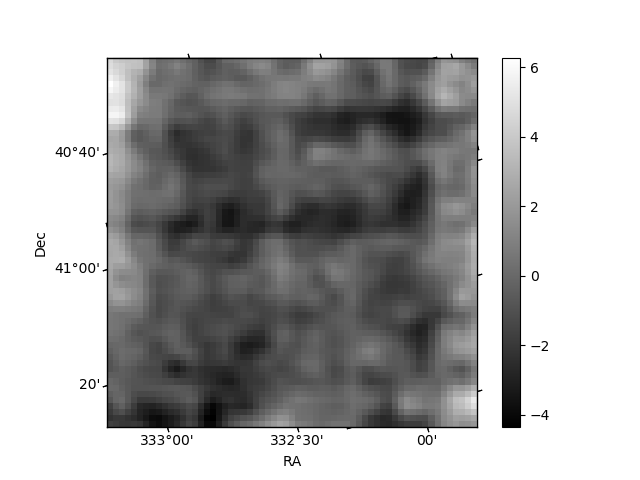
Histogram calculated using DETX and DETY for each event in the final _common_clean file
| Quadrant A | 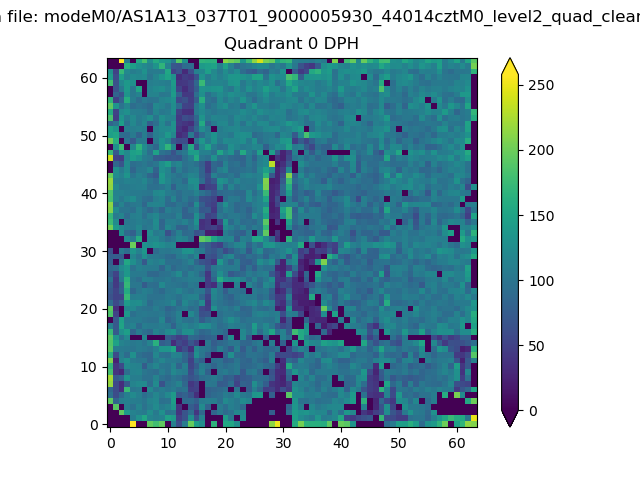 |
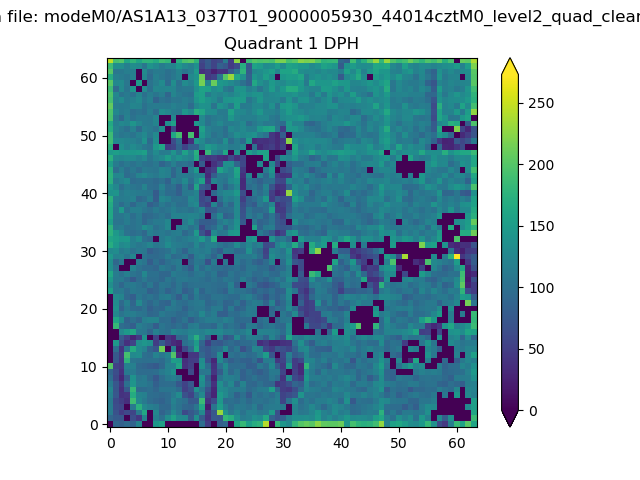 |
Quadrant B |
|---|---|---|---|
| Quadrant D | 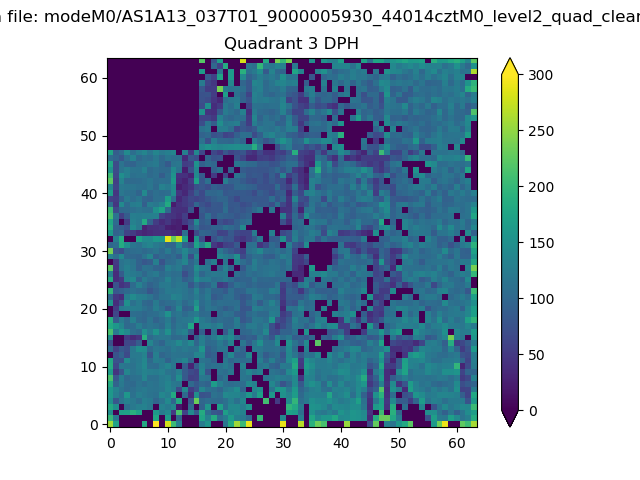 |
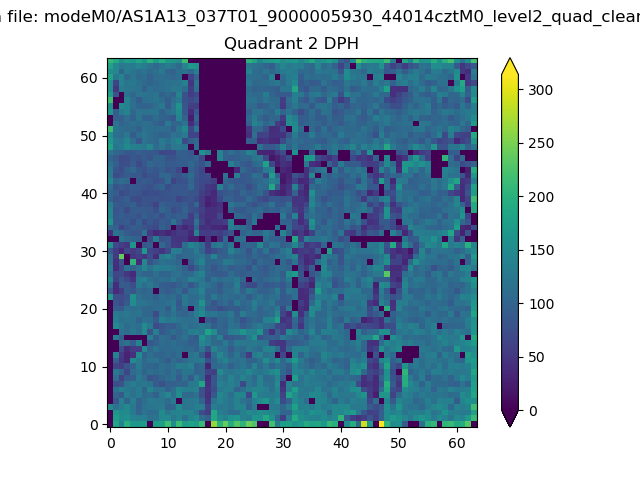 |
Quadrant C |
| Plot type | Count rate plots | Images |
|---|---|---|
| Comparison with Poisson distribution Blue bars denote a histogram of data divided into 1 sec bins. Red curve is a Poisson curve with rate = median count rate of data. |
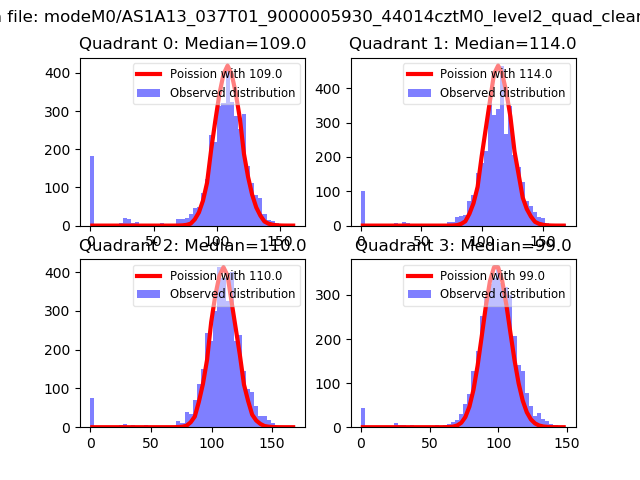 |
 |
| Quadrant-wise count rates Data is divided into 100 sec bins |
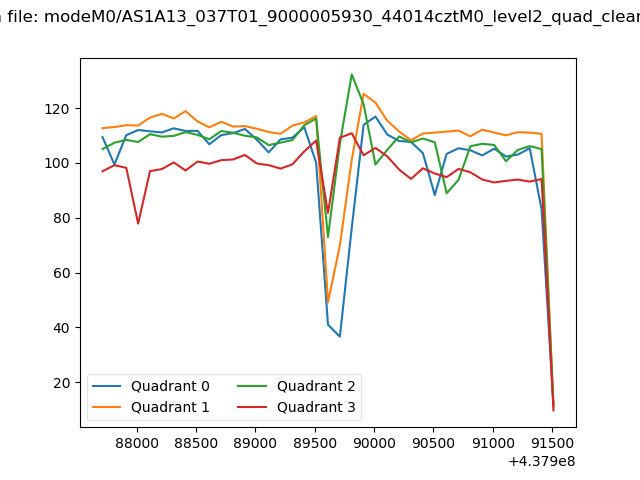 |
|
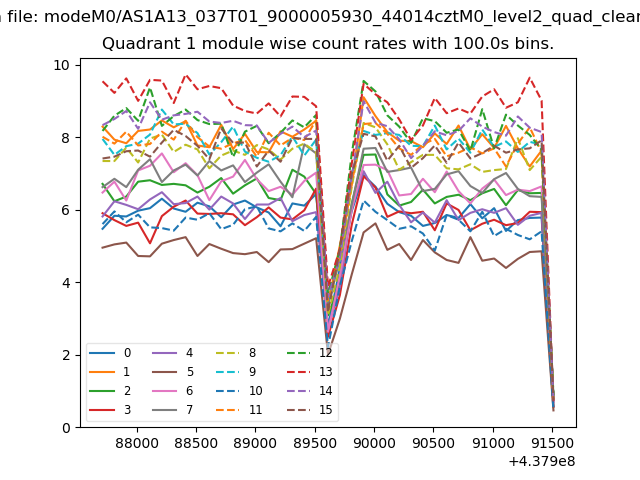
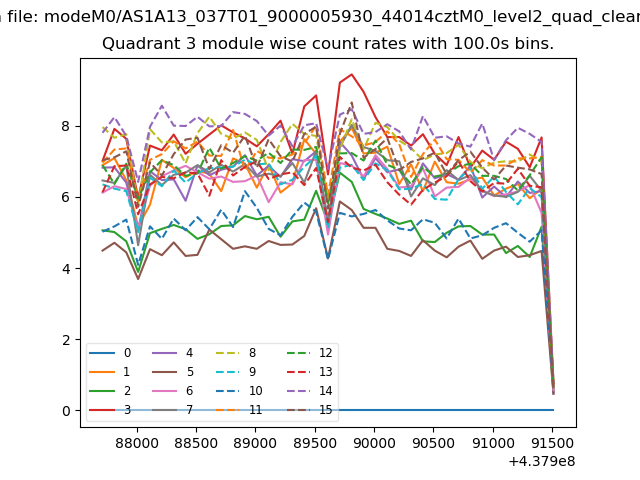
| Module-wise count rates for Quadrant A Data is divided into 100 sec bins |
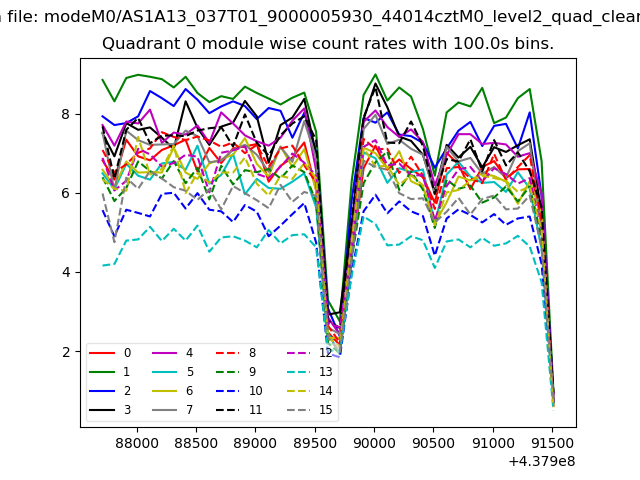 |
 |
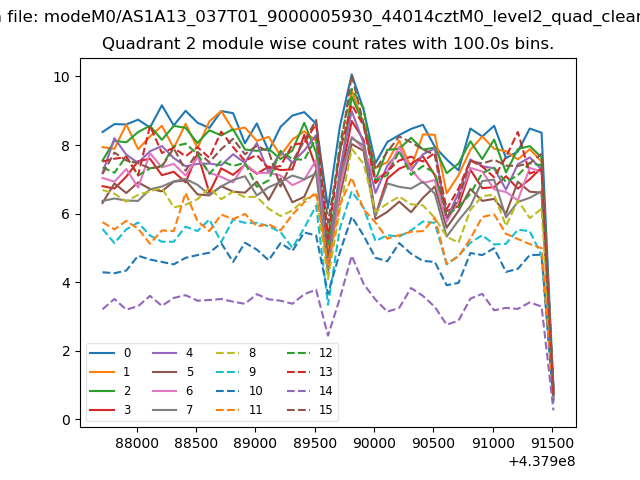
| Module-wise count rates for Quadrant B Data is divided into 100 sec bins |
 |
 |
| Module-wise count rates for Quadrant C Data is divided into 100 sec bins |
 |
 |
| Module-wise count rates for Quadrant D Data is divided into 100 sec bins |
 |
 |
| Parameter | Plot |
|---|---|
| CZT HV Monitor | 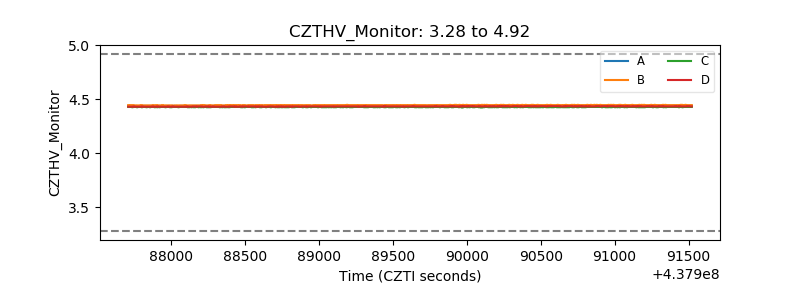 |
| D_VDD | 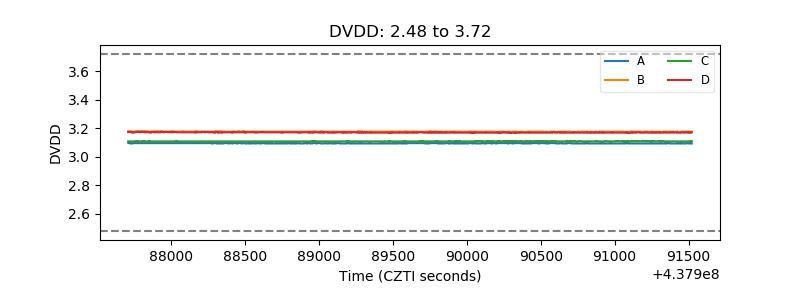 |
| Temperature 1 | 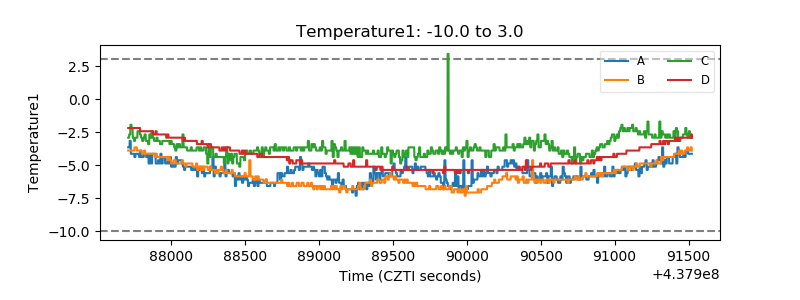 |
| Veto HV Monitor | 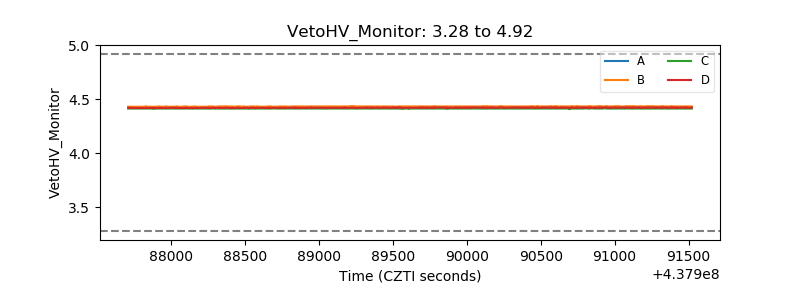 |
| Veto LLD | 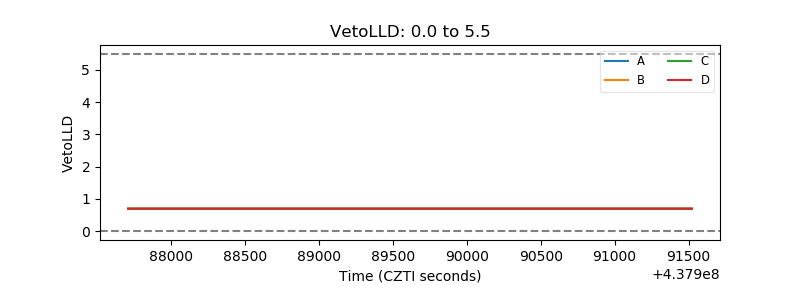 |
| Alpha Counter | 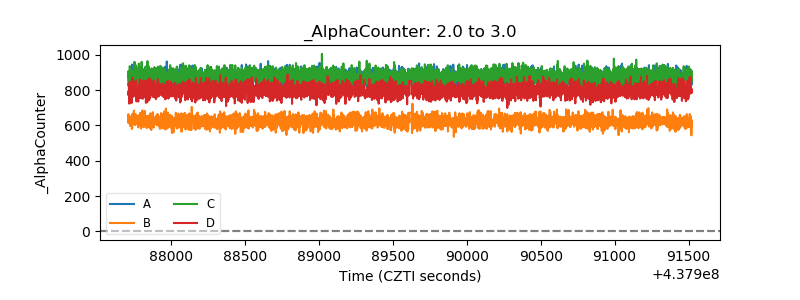 |
| _CPM_Rate | 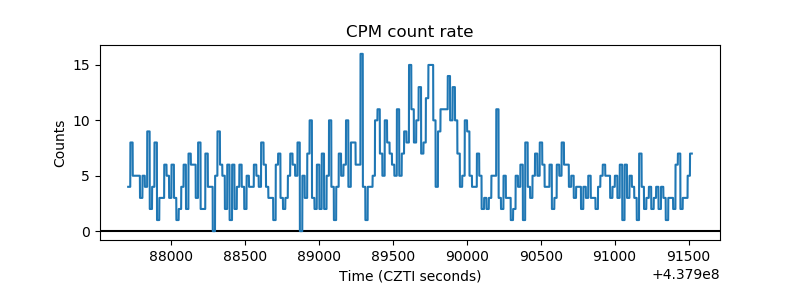 |
| CZT Counter | 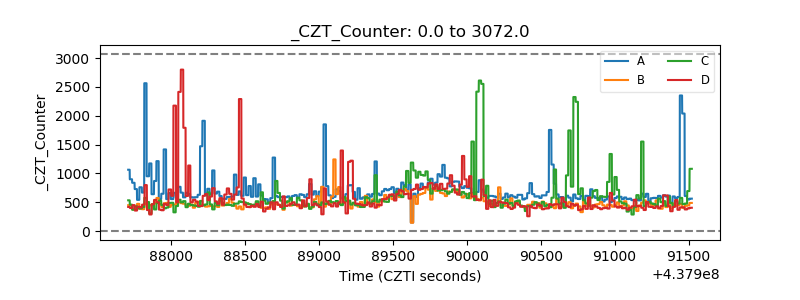 |
| +2.5 Volts monitor | 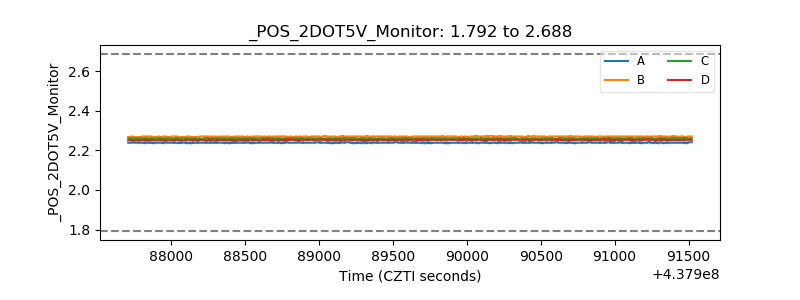 |
| +5 Volts monitor | 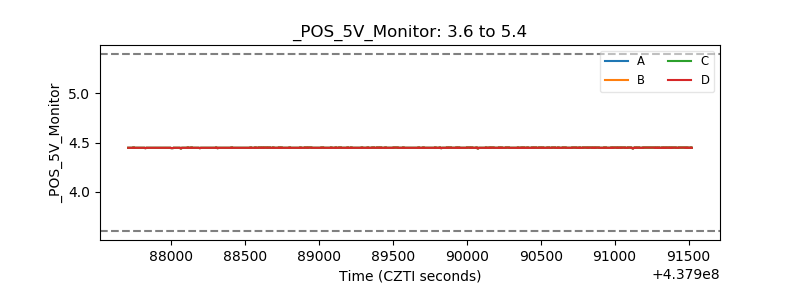 |
| _ROLL_ROT | 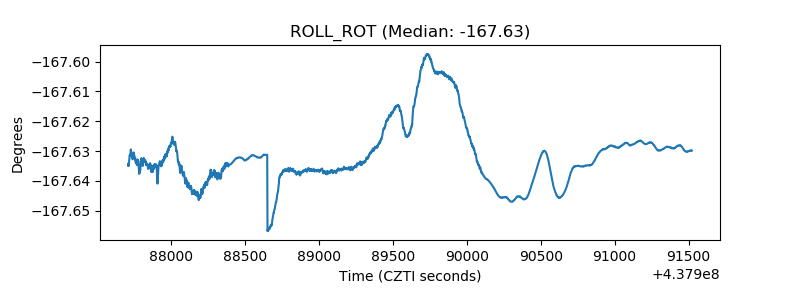 |
| _Roll_DEC | 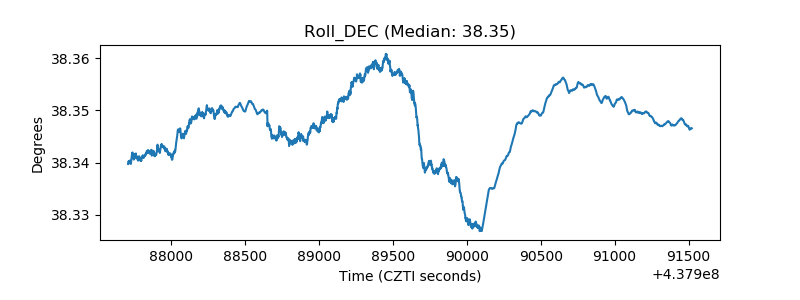 |
| _Roll_RA | 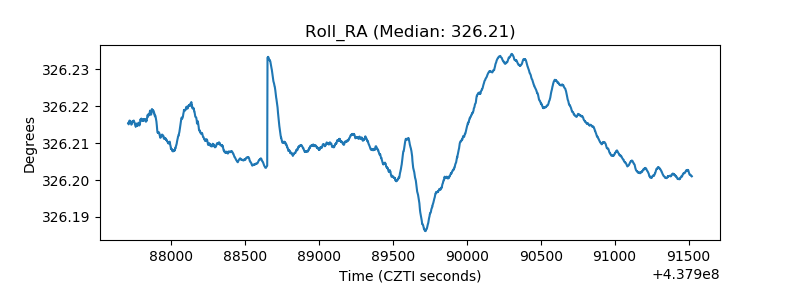 |
| Veto Counter | 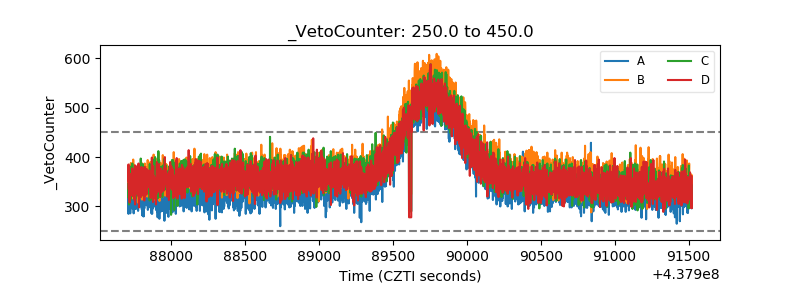 |