| Param | Original file | Final file |
|---|---|---|
| Filename | modeM0/AS1A13_037T01_9000005930_44015cztM0_level2.fits | modeM0/AS1A13_037T01_9000005930_44015cztM0_level2_quad_clean.evt |
| Size (bytes) | 540,371,520 | 126,783,360 |
| Size | 515.3 MB | 120.9 MB |
| Events in quadrant A | 5,762,955 | 821,364 |
| Events in quadrant B | 3,798,094 | 883,906 |
| Events in quadrant C | 4,750,374 | 837,944 |
| Events in quadrant D | 5,075,776 | 744,221 |
| Mode SS | |||
|---|---|---|---|
| Quadrant | BADHDUFLAG | Total packets | Discarded packets |
| A | 0 | 158 | 0 |
| B | 0 | 158 | 0 |
| C | 0 | 158 | 0 |
| D | 0 | 158 | 0 |
| Mode M0 | |||
|---|---|---|---|
| Quadrant | BADHDUFLAG | Total packets | Discarded packets |
| A | 0 | 22669 | 0 |
| B | 0 | 16789 | 0 |
| C | 0 | 19439 | 0 |
| D | 0 | 20642 | 10 |
| Quadrant | Total seconds | Saturated seconds | Saturation percentage |
|---|---|---|---|
| A | 7931 | 376 | 4.740890% |
| B | 7932 | 99 | 1.248109% |
| C | 7932 | 157 | 1.979324% |
| D | 7929 | 290 | 3.657460% |
Noise dominated data is calculated using 1-second bins in cleaned event files. If a bin has >2000 counts, and if more than 50% of those come from <1% of pixels, then it is considered to be noise-dominated and hence unusable.
| Quadrant | # 1 sec bins | Bins with >0 counts | Bins with >2000 counts | High rate bins dominated by noise | Noise dominated (total time) | Noise dominated (detector-on time) | Marked lightcurve |
|---|---|---|---|---|---|---|---|
| A | 7931 | 7931 | 211 | 211 | 2.66% | 2.66% | 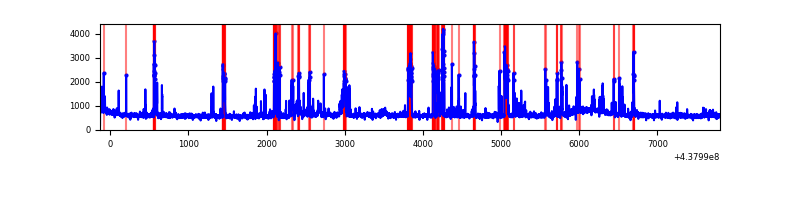 |
| B | 7932 | 7932 | 7 | 7 | 0.09% | 0.09% | 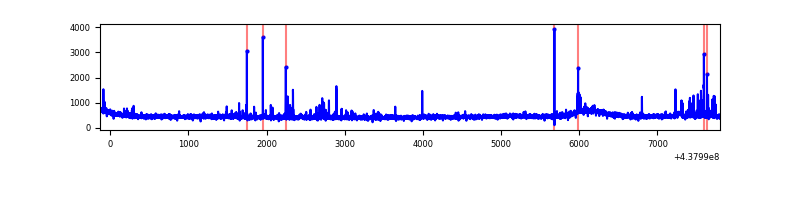 |
| C | 7932 | 7932 | 120 | 120 | 1.51% | 1.51% | 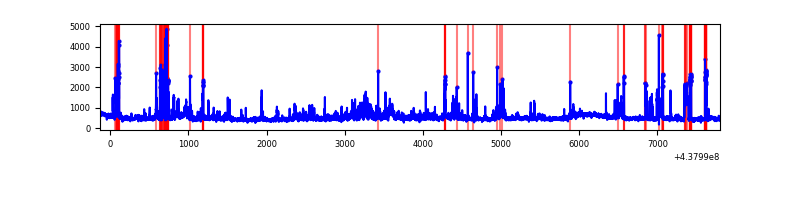 |
| D | 7932 | 7930 | 155 | 155 | 1.95% | 1.95% | 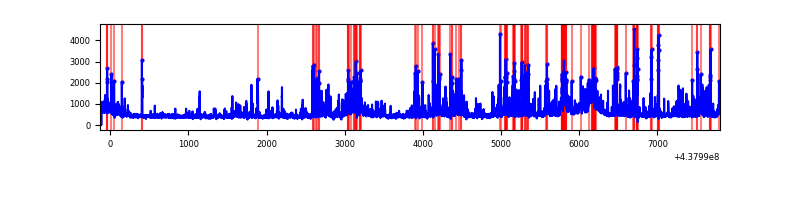 |
Top three noisy pixels from each quadrant. If the there are fewer than three noisy pixels in the level2.evt file, extra rows are filled as -1
| Pixel properties | Quadrant properties | ||||||
|---|---|---|---|---|---|---|---|
| Quadrant | DetID | PixID | Counts | Sigma | Mean | Median | Sigma |
| A | 10 | 83 | 1210553 | 6464.36 | 896 | 875 | 187.1 |
| A | 14 | 238 | 1054742 | 5631.73 | 896 | 875 | 187.1 |
| A | 15 | 222 | 17151 | 86.98 | 896 | 875 | 187.1 |
| B | 0 | 213 | 99337 | 544.69 | 907 | 879 | 180.8 |
| B | 15 | 36 | 31220 | 167.85 | 907 | 879 | 180.8 |
| B | 0 | 245 | 30888 | 166.02 | 907 | 879 | 180.8 |
| C | 15 | 1 | 497770 | 2373.34 | 884 | 889 | 209.4 |
| C | 3 | 233 | 453976 | 2164.16 | 884 | 889 | 209.4 |
| C | 14 | 254 | 224131 | 1066.31 | 884 | 889 | 209.4 |
| D | 1 | 52 | 692280 | 3140.62 | 875 | 845 | 220.2 |
| D | 2 | 120 | 241693 | 1093.97 | 875 | 845 | 220.2 |
| D | 12 | 233 | 123864 | 558.77 | 875 | 845 | 220.2 |
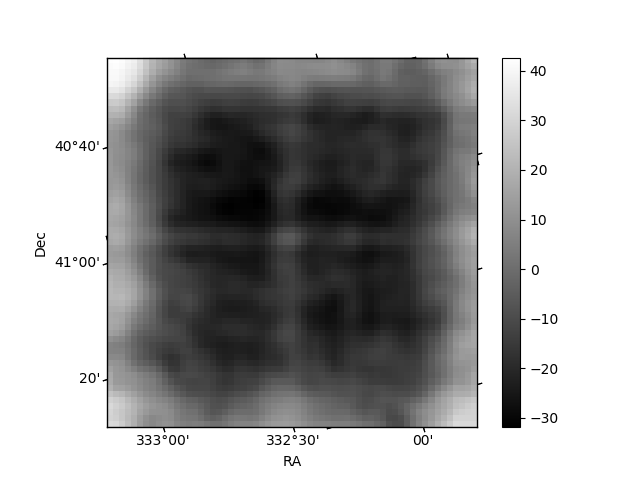
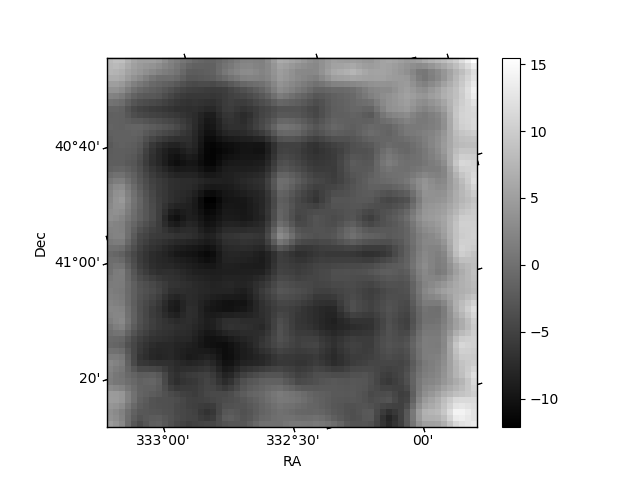
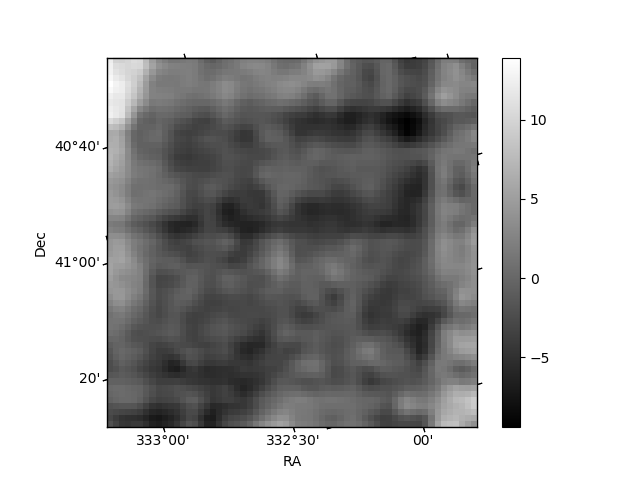
Histogram calculated using DETX and DETY for each event in the final _common_clean file
| Quadrant A | 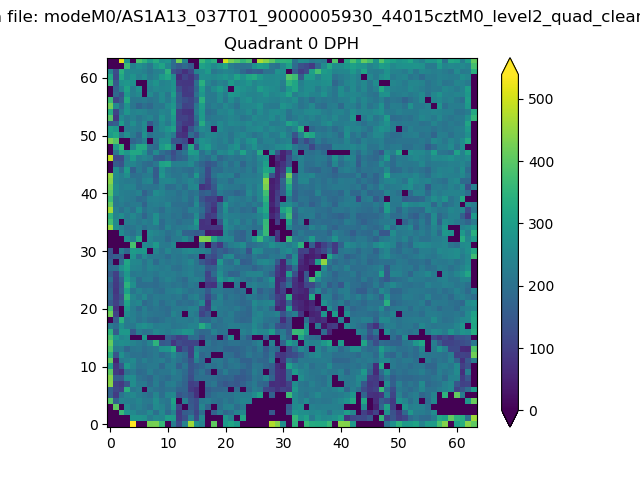 |
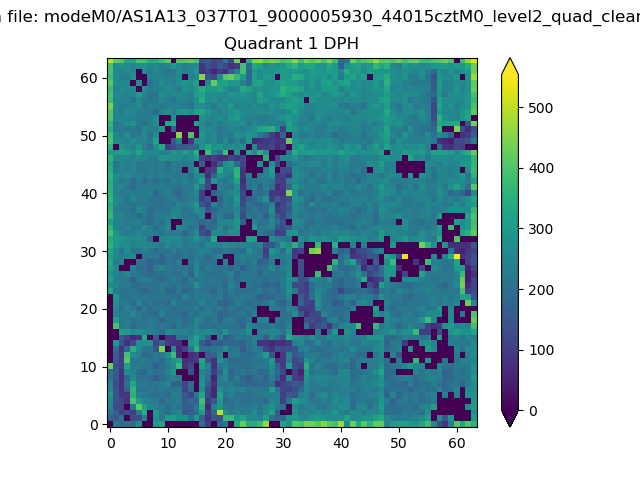 |
Quadrant B |
|---|---|---|---|
| Quadrant D | 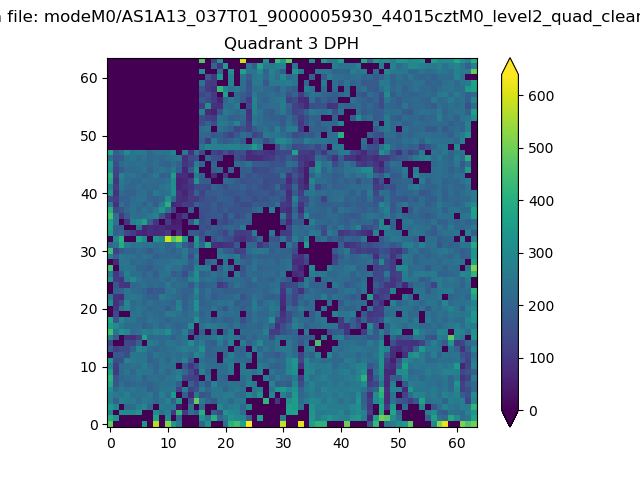 |
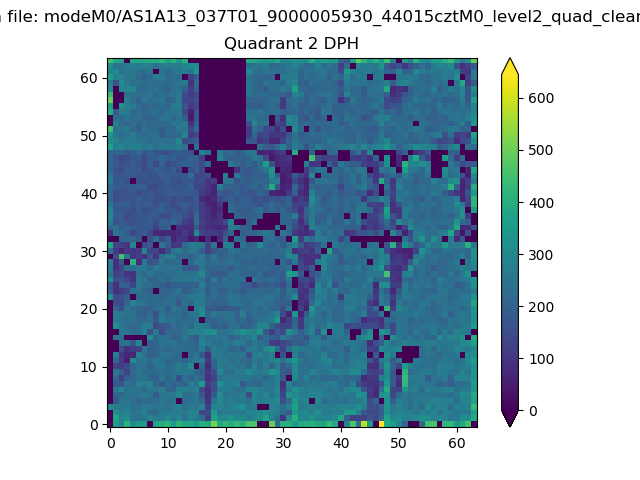 |
Quadrant C |
| Plot type | Count rate plots | Images |
|---|---|---|
| Comparison with Poisson distribution Blue bars denote a histogram of data divided into 1 sec bins. Red curve is a Poisson curve with rate = median count rate of data. |
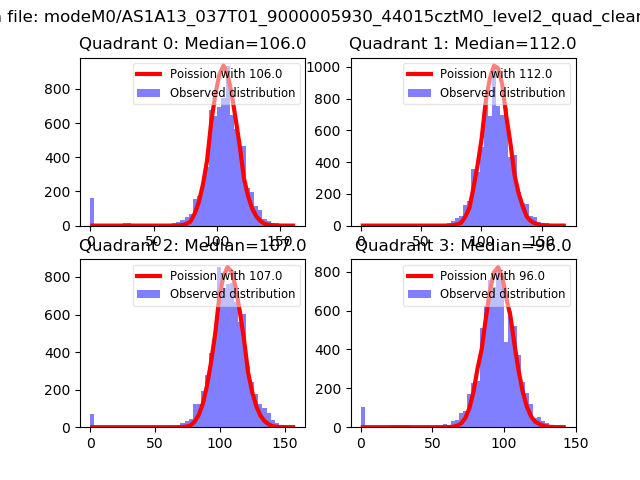 |
 |
| Quadrant-wise count rates Data is divided into 100 sec bins |
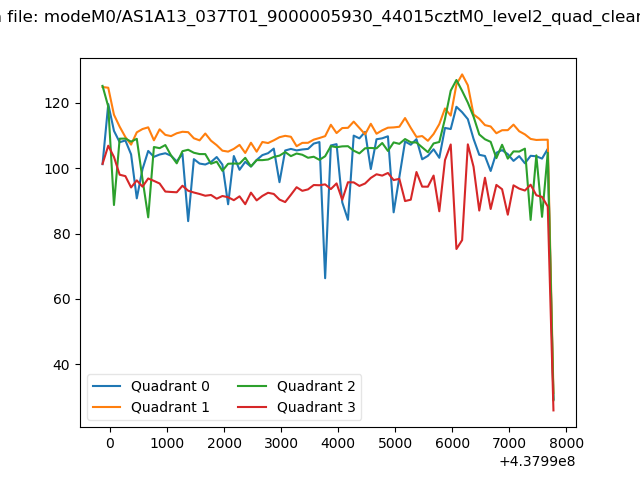 |
|
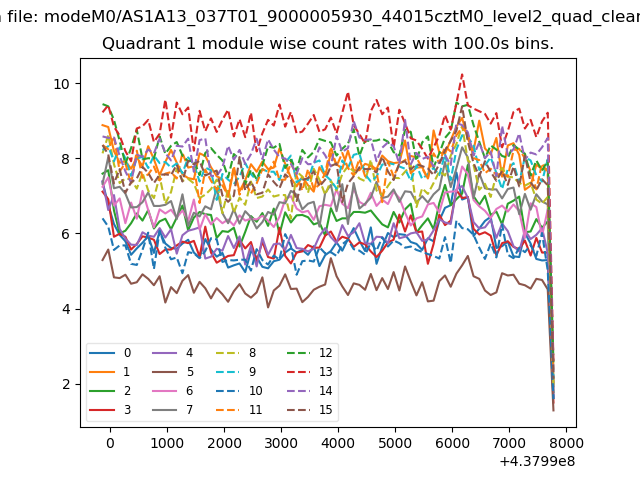
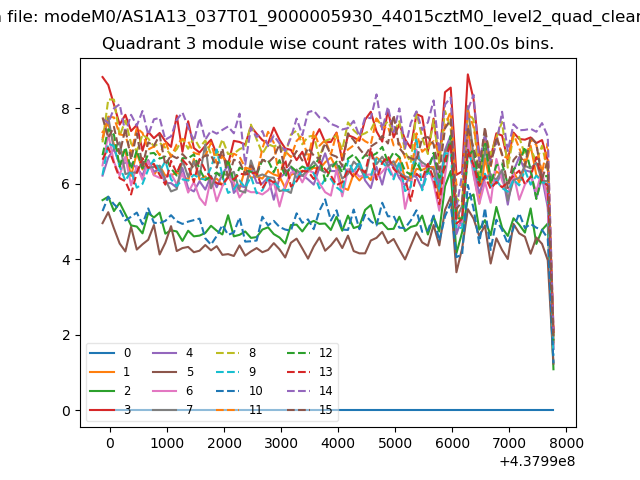
| Module-wise count rates for Quadrant A Data is divided into 100 sec bins |
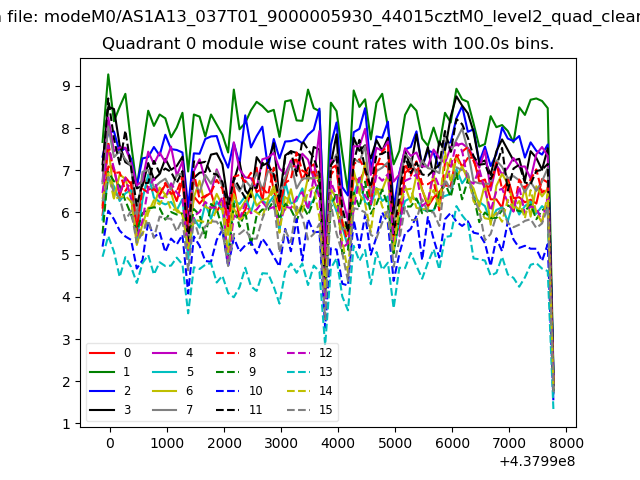 |
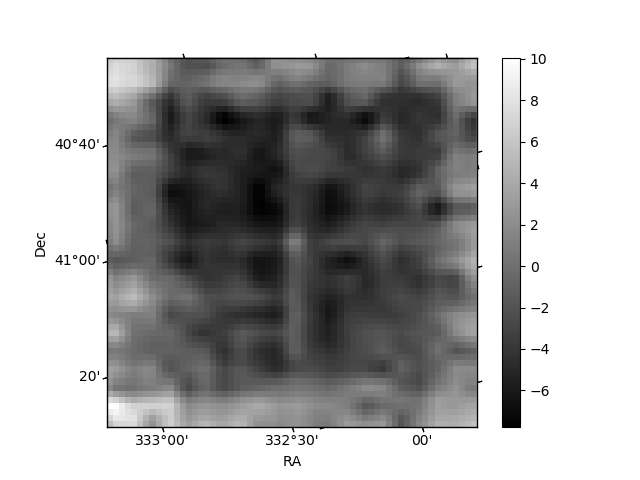 |
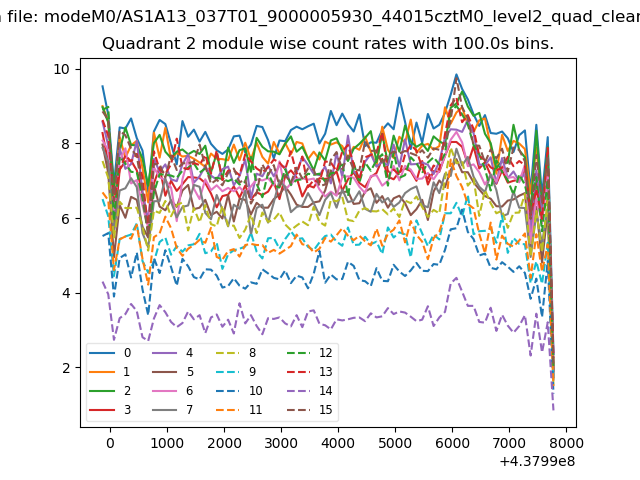
| Module-wise count rates for Quadrant B Data is divided into 100 sec bins |
 |
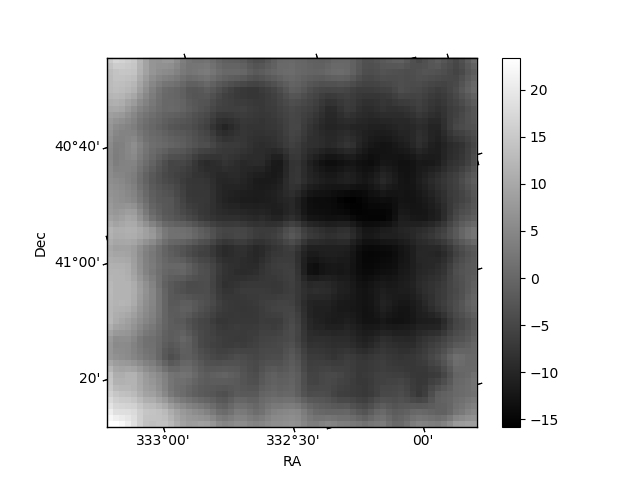 |
| Module-wise count rates for Quadrant C Data is divided into 100 sec bins |
 |
 |
| Module-wise count rates for Quadrant D Data is divided into 100 sec bins |
 |
 |
| Parameter | Plot |
|---|---|
| CZT HV Monitor | 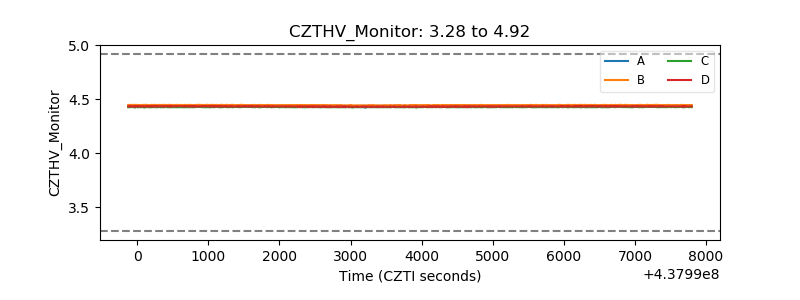 |
| D_VDD | 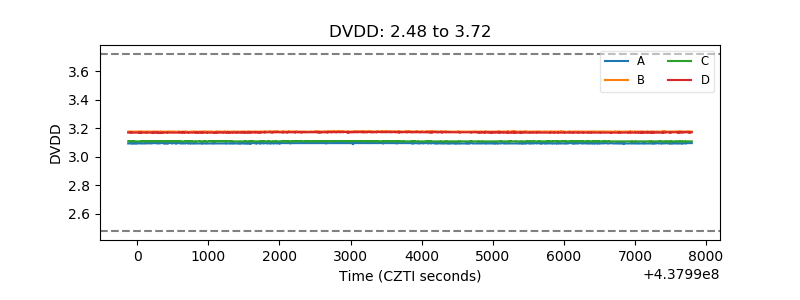 |
| Temperature 1 | 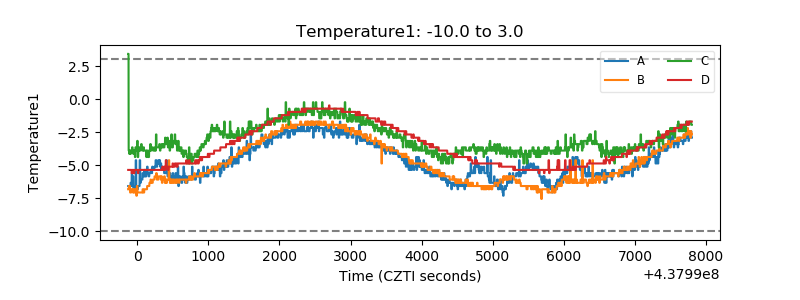 |
| Veto HV Monitor | 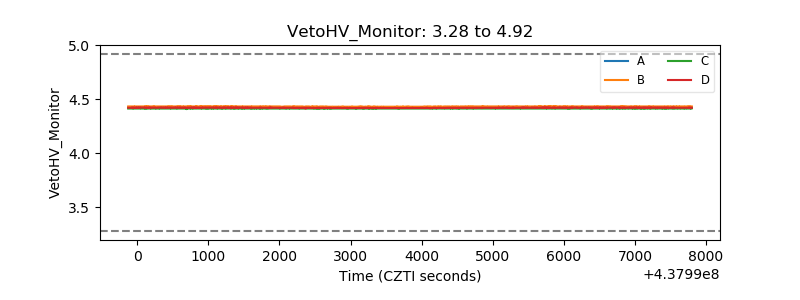 |
| Veto LLD | 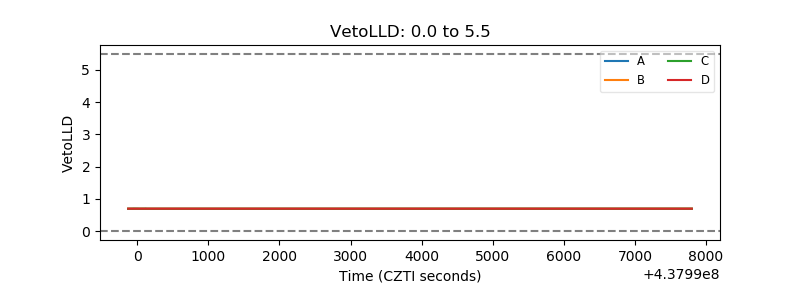 |
| Alpha Counter | 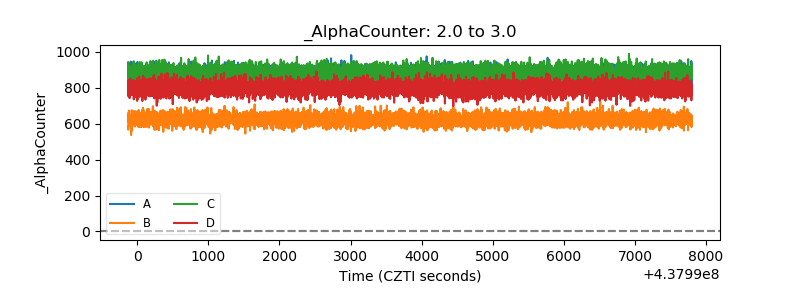 |
| _CPM_Rate | 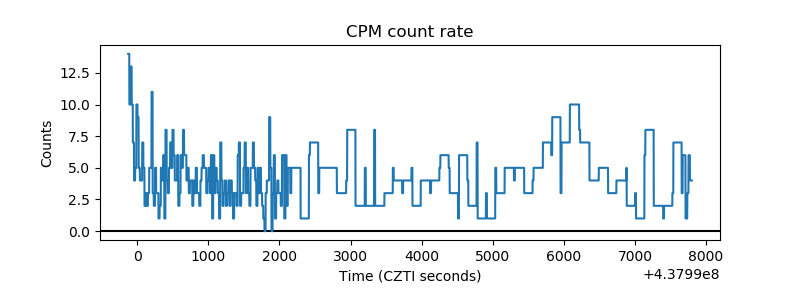 |
| CZT Counter | 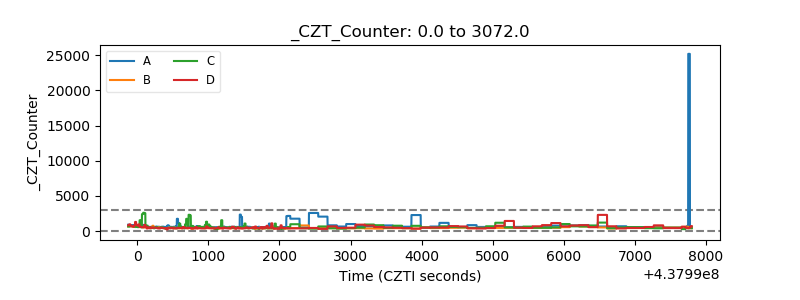 |
| +2.5 Volts monitor | 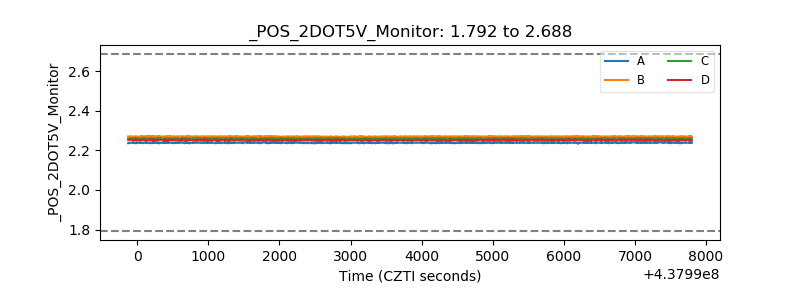 |
| +5 Volts monitor | 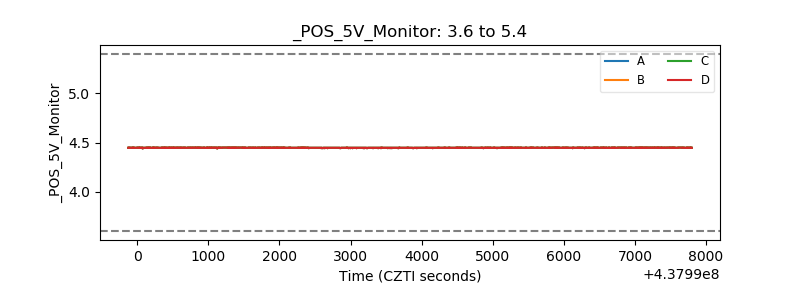 |
| _ROLL_ROT | 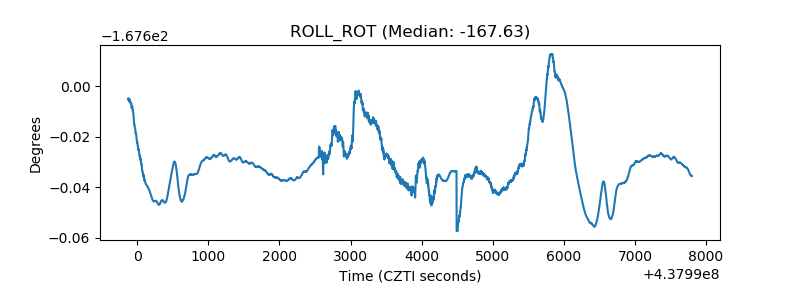 |
| _Roll_DEC | 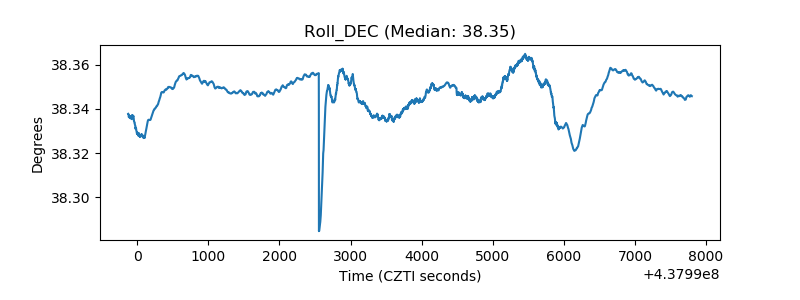 |
| _Roll_RA | 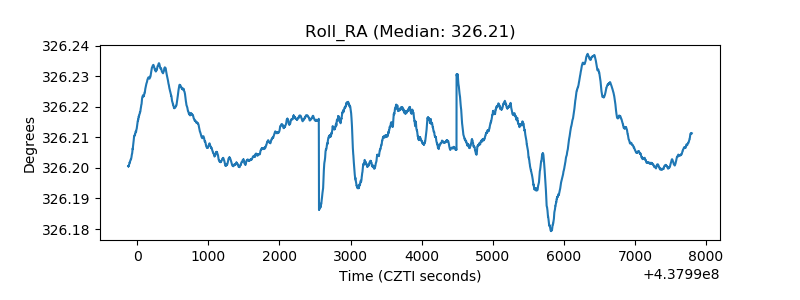 |
| Veto Counter | 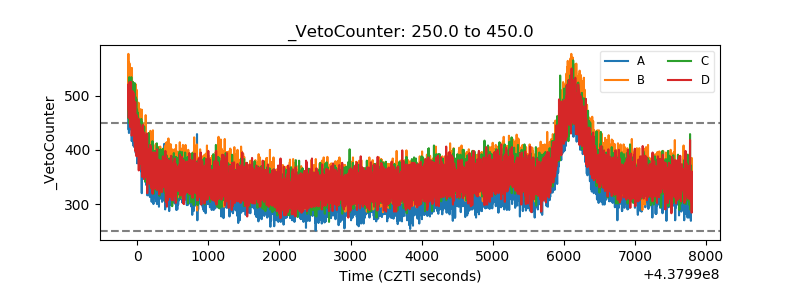 |