| Param | Original file | Final file |
|---|---|---|
| Filename | modeM0/AS1A13_037T01_9000005930_44016cztM0_level2.fits | modeM0/AS1A13_037T01_9000005930_44016cztM0_level2_quad_clean.evt |
| Size (bytes) | 484,093,440 | 115,315,200 |
| Size | 461.7 MB | 110.0 MB |
| Events in quadrant A | 4,929,001 | 752,281 |
| Events in quadrant B | 3,684,564 | 788,455 |
| Events in quadrant C | 4,156,324 | 762,503 |
| Events in quadrant D | 4,588,043 | 684,807 |
| Mode SS | |||
|---|---|---|---|
| Quadrant | BADHDUFLAG | Total packets | Discarded packets |
| A | 0 | 144 | 0 |
| B | 0 | 144 | 0 |
| C | 0 | 144 | 0 |
| D | 0 | 144 | 0 |
| Mode M0 | |||
|---|---|---|---|
| Quadrant | BADHDUFLAG | Total packets | Discarded packets |
| A | 0 | 20005 | 0 |
| B | 0 | 15841 | 0 |
| C | 0 | 17216 | 0 |
| D | 0 | 18423 | 0 |
| Quadrant | Total seconds | Saturated seconds | Saturation percentage |
|---|---|---|---|
| A | 7231 | 269 | 3.720094% |
| B | 7232 | 210 | 2.903761% |
| C | 7232 | 149 | 2.060288% |
| D | 7232 | 201 | 2.779314% |
Noise dominated data is calculated using 1-second bins in cleaned event files. If a bin has >2000 counts, and if more than 50% of those come from <1% of pixels, then it is considered to be noise-dominated and hence unusable.
| Quadrant | # 1 sec bins | Bins with >0 counts | Bins with >2000 counts | High rate bins dominated by noise | Noise dominated (total time) | Noise dominated (detector-on time) | Marked lightcurve |
|---|---|---|---|---|---|---|---|
| A | 7231 | 7231 | 73 | 73 | 1.01% | 1.01% | 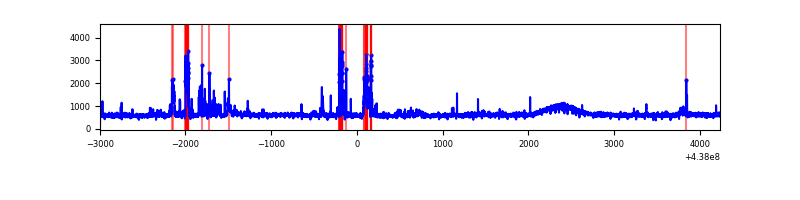 |
| B | 7232 | 7232 | 16 | 16 | 0.22% | 0.22% | 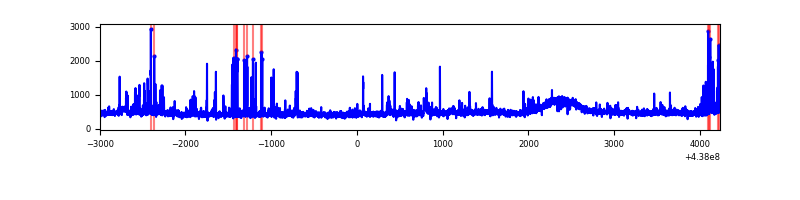 |
| C | 7232 | 7232 | 78 | 78 | 1.08% | 1.08% | 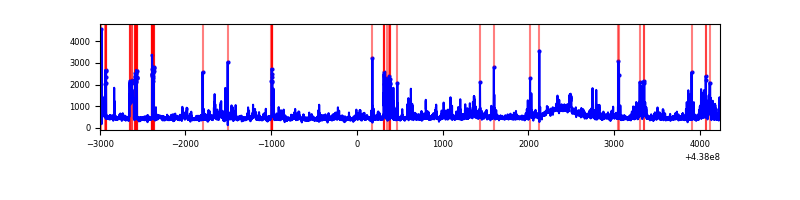 |
| D | 7232 | 7232 | 107 | 107 | 1.48% | 1.48% | 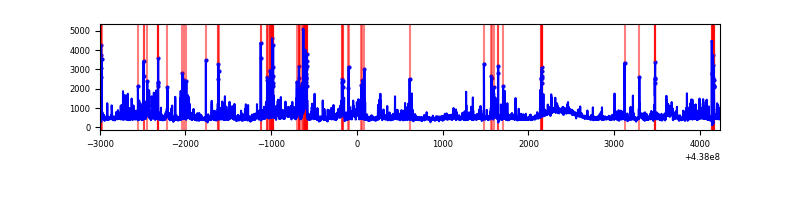 |
Top three noisy pixels from each quadrant. If the there are fewer than three noisy pixels in the level2.evt file, extra rows are filled as -1
| Pixel properties | Quadrant properties | ||||||
|---|---|---|---|---|---|---|---|
| Quadrant | DetID | PixID | Counts | Sigma | Mean | Median | Sigma |
| A | 10 | 83 | 1142609 | 6577.18 | 828 | 807 | 173.6 |
| A | 14 | 238 | 475555 | 2734.72 | 828 | 807 | 173.6 |
| A | 15 | 222 | 70097 | 399.13 | 828 | 807 | 173.6 |
| B | 15 | 36 | 125707 | 748.95 | 827 | 799 | 166.8 |
| B | 0 | 213 | 81353 | 483.0 | 827 | 799 | 166.8 |
| B | 4 | 171 | 62882 | 372.25 | 827 | 799 | 166.8 |
| C | 3 | 233 | 554667 | 2886.9 | 811 | 813 | 191.9 |
| C | 15 | 1 | 202432 | 1050.91 | 811 | 813 | 191.9 |
| C | 15 | 158 | 127343 | 659.52 | 811 | 813 | 191.9 |
| D | 1 | 52 | 632021 | 3087.22 | 811 | 787 | 204.5 |
| D | 13 | 249 | 161777 | 787.36 | 811 | 787 | 204.5 |
| D | 2 | 120 | 85203 | 412.86 | 811 | 787 | 204.5 |
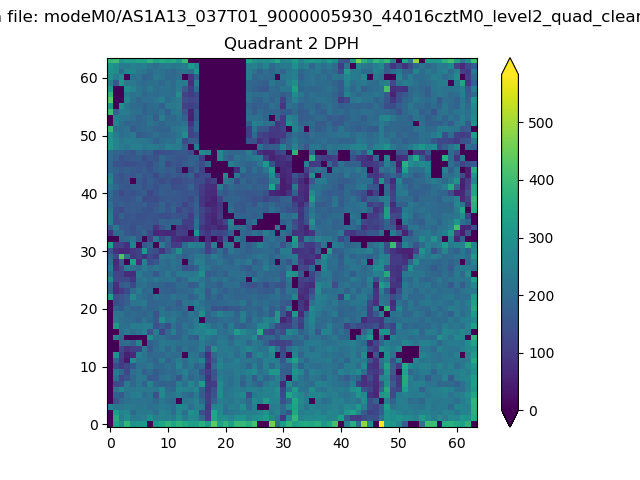
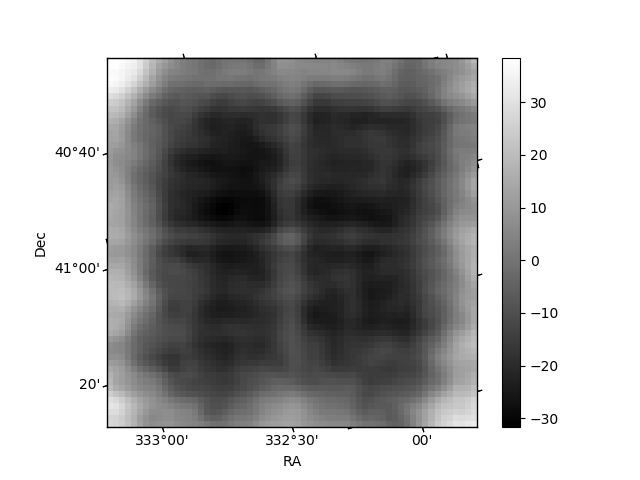
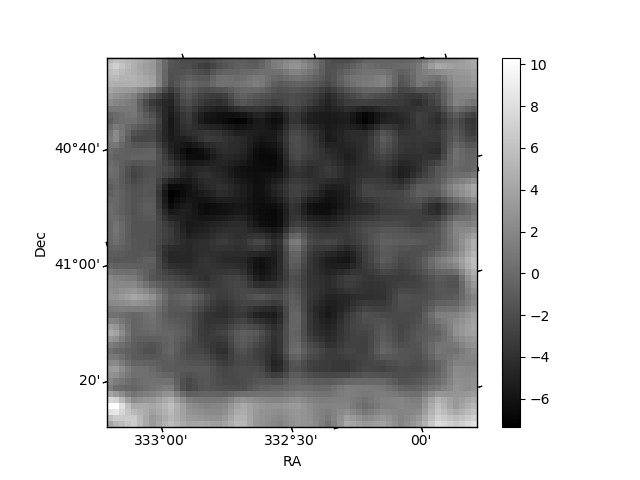
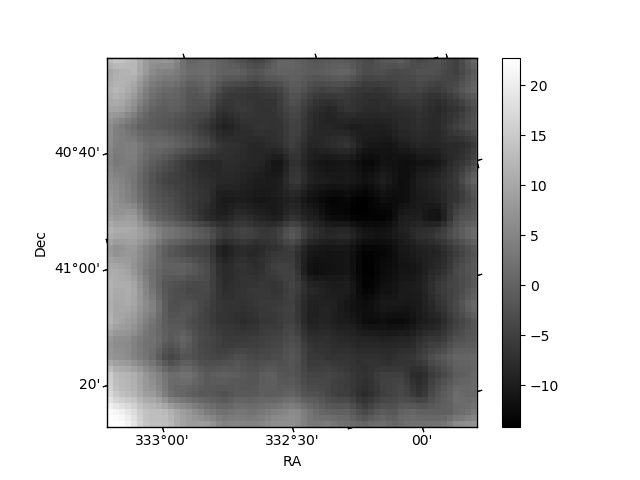
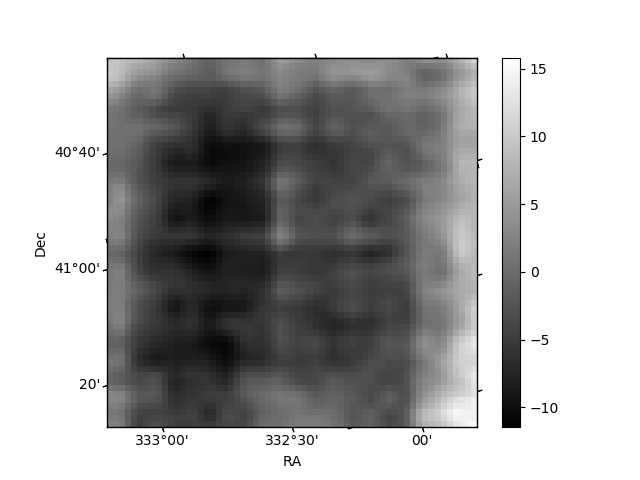
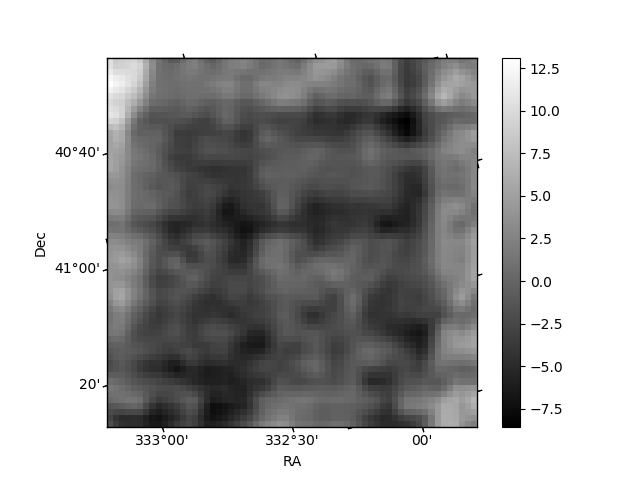
Histogram calculated using DETX and DETY for each event in the final _common_clean file
| Quadrant A | 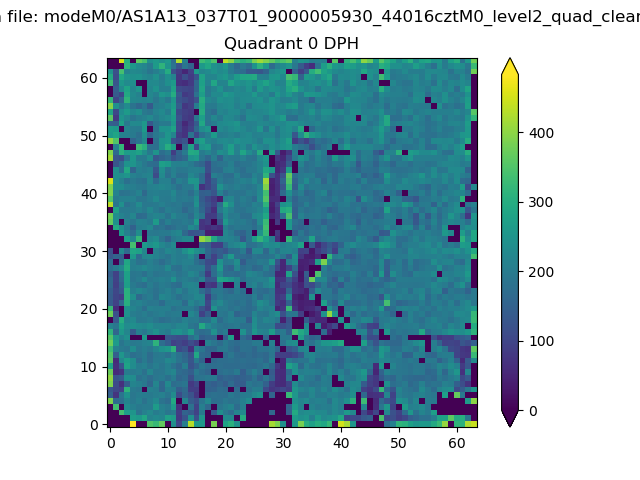 |
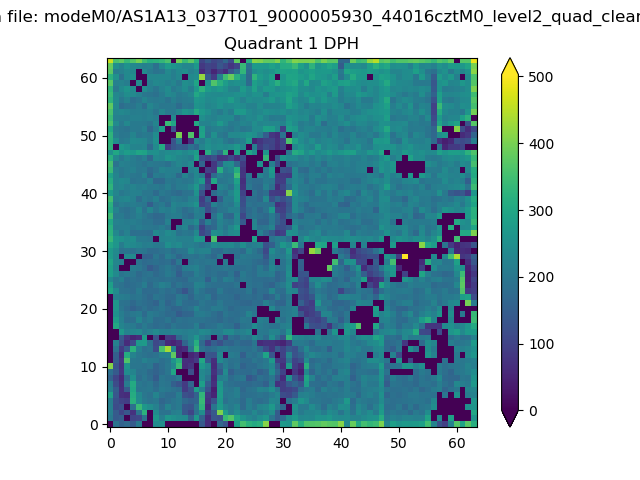 |
Quadrant B |
|---|---|---|---|
| Quadrant D | 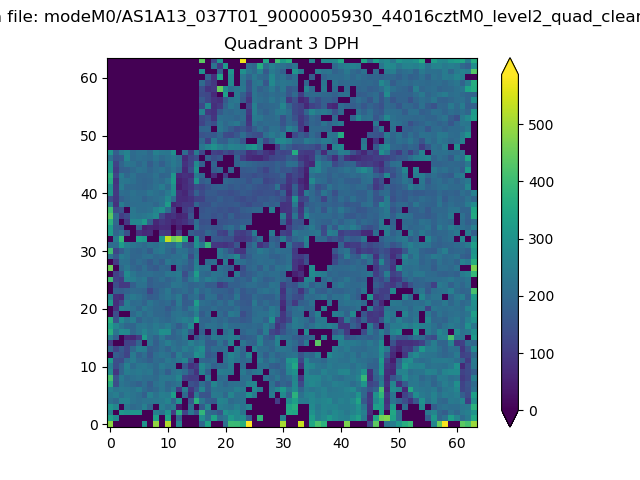 |
 |
Quadrant C |
| Plot type | Count rate plots | Images |
|---|---|---|
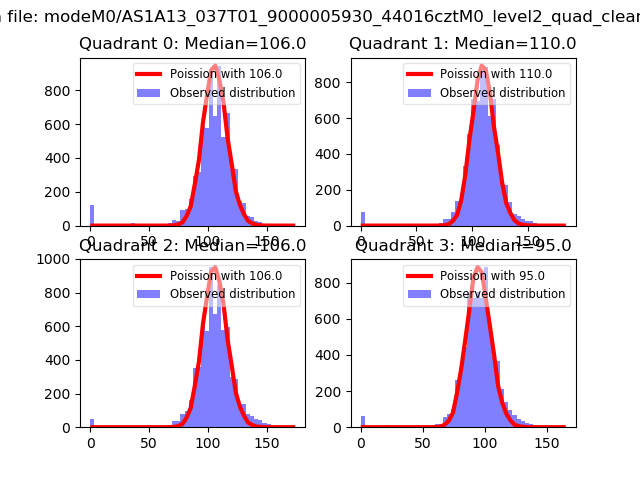
| Comparison with Poisson distribution Blue bars denote a histogram of data divided into 1 sec bins. Red curve is a Poisson curve with rate = median count rate of data. |
 |
 |
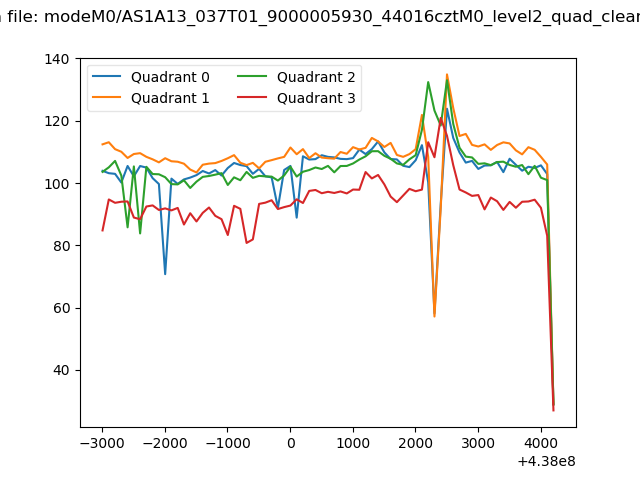
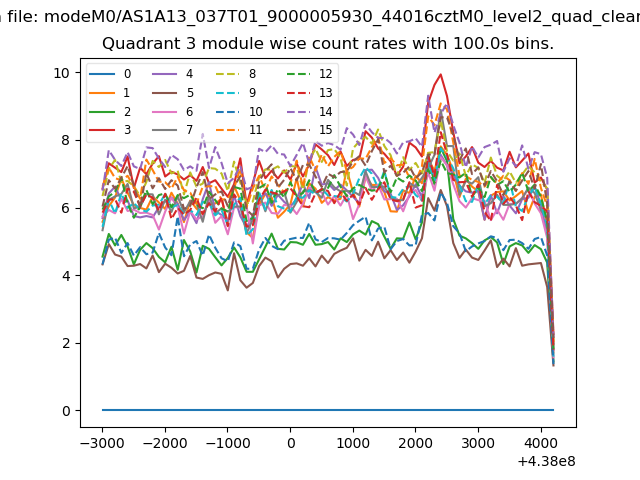
| Quadrant-wise count rates Data is divided into 100 sec bins |
 |
|
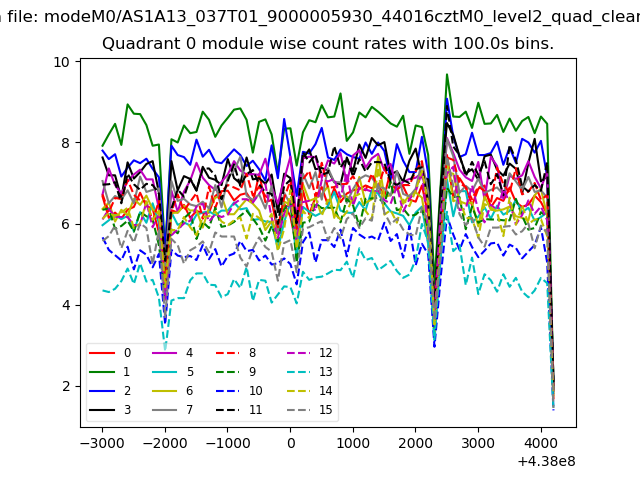
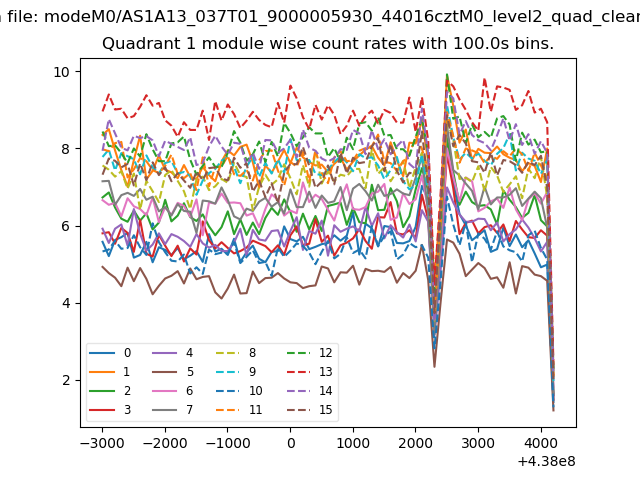
| Module-wise count rates for Quadrant A Data is divided into 100 sec bins |
 |
 |
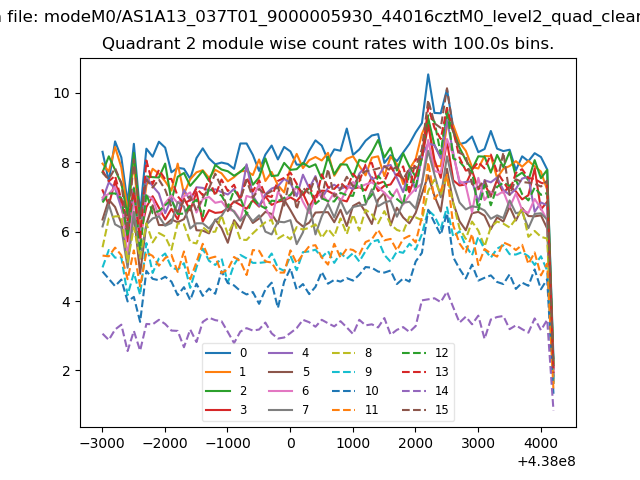
| Module-wise count rates for Quadrant B Data is divided into 100 sec bins |
 |
 |
| Module-wise count rates for Quadrant C Data is divided into 100 sec bins |
 |
 |
| Module-wise count rates for Quadrant D Data is divided into 100 sec bins |
 |
 |
| Parameter | Plot |
|---|---|
| CZT HV Monitor | 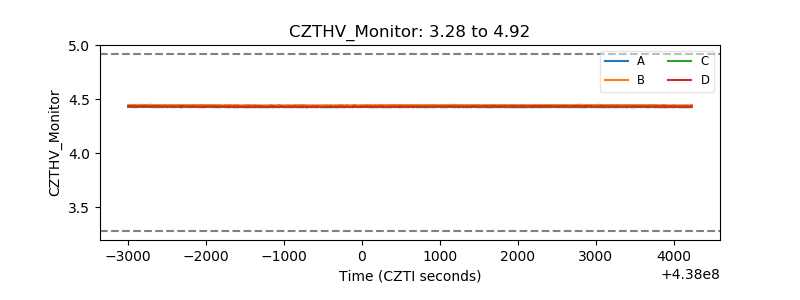 |
| D_VDD | 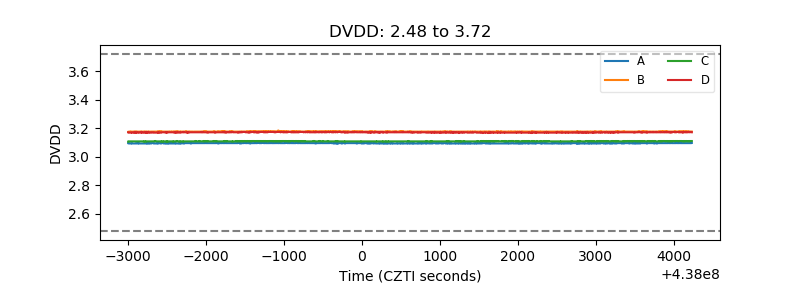 |
| Temperature 1 | 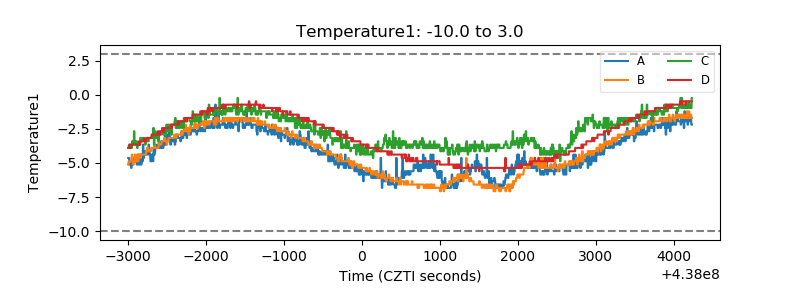 |
| Veto HV Monitor | 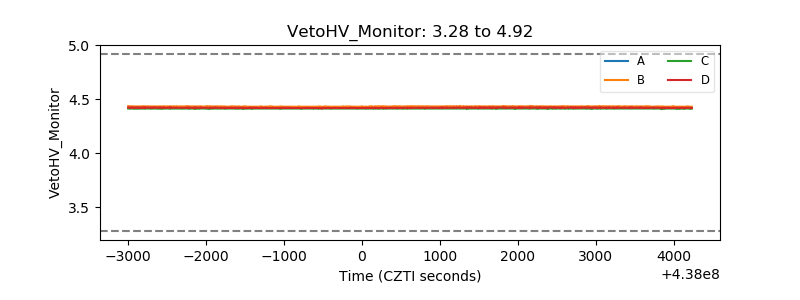 |
| Veto LLD | 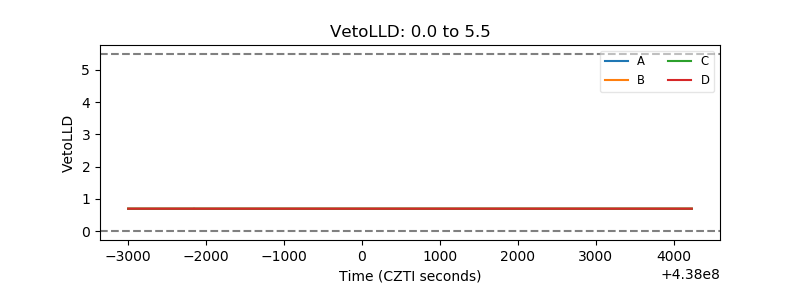 |
| Alpha Counter | 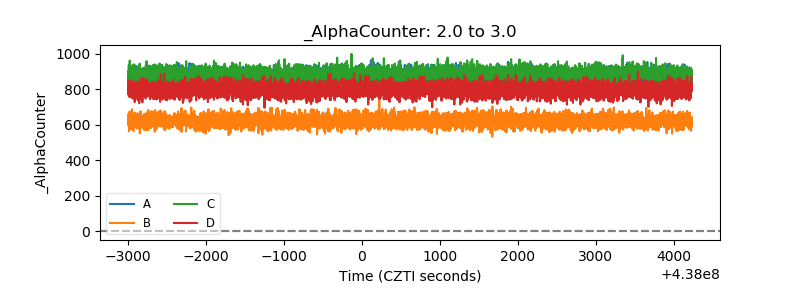 |
| _CPM_Rate | 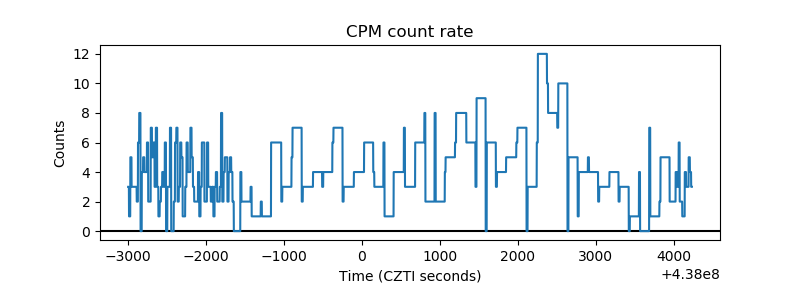 |
| CZT Counter | 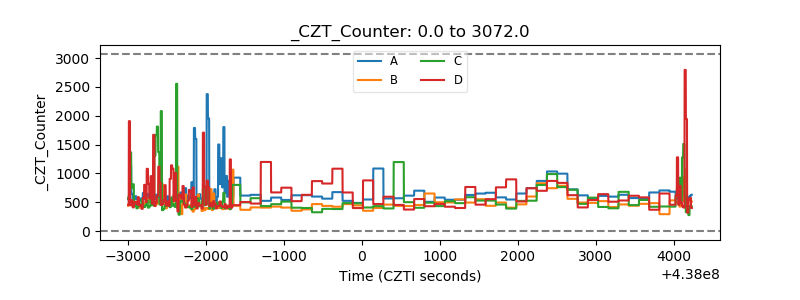 |
| +2.5 Volts monitor | 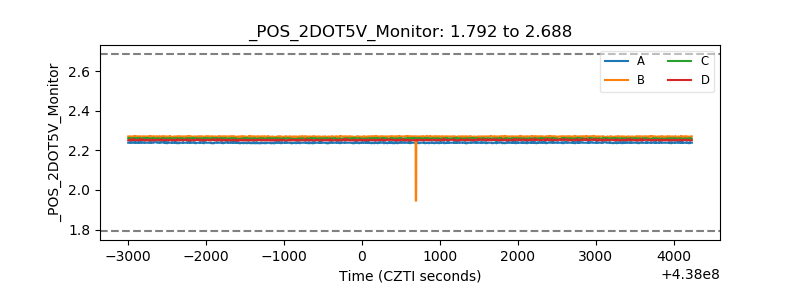 |
| +5 Volts monitor | 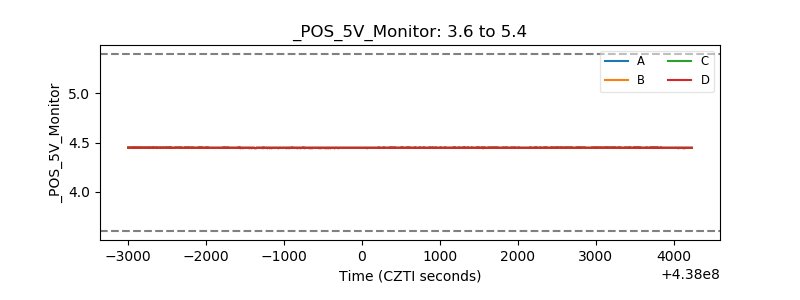 |
| _ROLL_ROT | 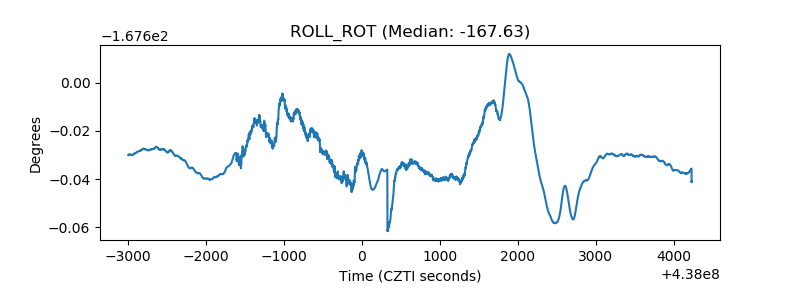 |
| _Roll_DEC | 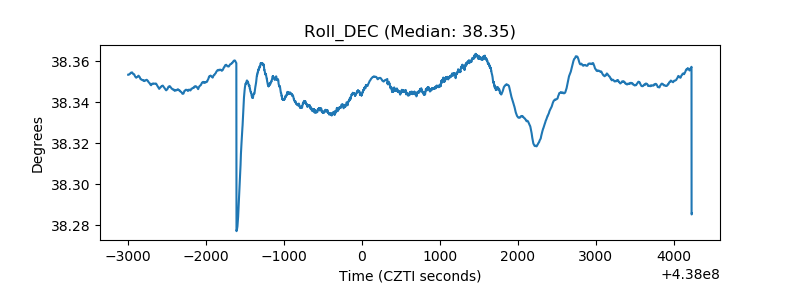 |
| _Roll_RA | 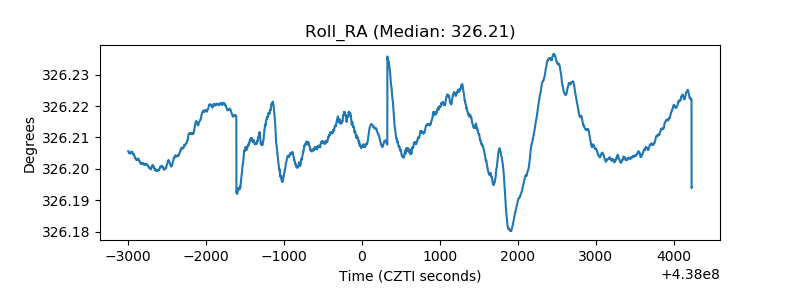 |
| Veto Counter | 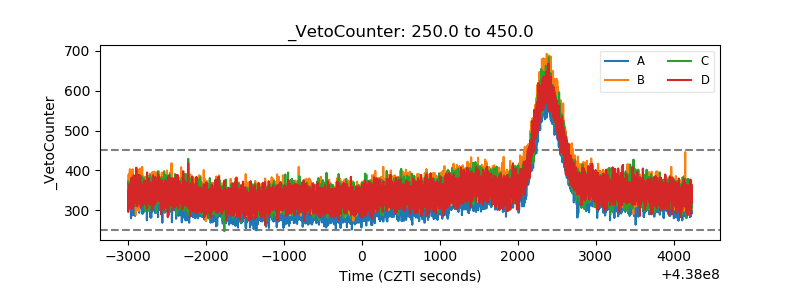 |