| Param | Original file | Final file |
|---|---|---|
| Filename | modeM0/AS1A13_037T01_9000005930_44019cztM0_level2.fits | modeM0/AS1A13_037T01_9000005930_44019cztM0_level2_quad_clean.evt |
| Size (bytes) | 570,237,120 | 117,316,800 |
| Size | 543.8 MB | 111.9 MB |
| Events in quadrant A | 5,301,994 | 778,323 |
| Events in quadrant B | 3,880,184 | 817,518 |
| Events in quadrant C | 5,030,439 | 777,701 |
| Events in quadrant D | 6,310,585 | 653,043 |
| Mode SS | |||
|---|---|---|---|
| Quadrant | BADHDUFLAG | Total packets | Discarded packets |
| A | 0 | 154 | 0 |
| B | 0 | 154 | 0 |
| C | 0 | 154 | 0 |
| D | 0 | 154 | 0 |
| Mode M0 | |||
|---|---|---|---|
| Quadrant | BADHDUFLAG | Total packets | Discarded packets |
| A | 0 | 21568 | 1 |
| B | 0 | 16491 | 1 |
| C | 0 | 20056 | 1 |
| D | 0 | 23827 | 1 |
| Mode M9 | |||
|---|---|---|---|
| Quadrant | BADHDUFLAG | Total packets | Discarded packets |
| A | 0 | 3 | 0 |
| B | 0 | 3 | 0 |
| C | 0 | 3 | 0 |
| D | 0 | 3 | 0 |
| Quadrant | Total seconds | Saturated seconds | Saturation percentage |
|---|---|---|---|
| A | 7544 | 266 | 3.525981% |
| B | 7545 | 161 | 2.133863% |
| C | 7545 | 194 | 2.571239% |
| D | 7545 | 786 | 10.417495% |
Noise dominated data is calculated using 1-second bins in cleaned event files. If a bin has >2000 counts, and if more than 50% of those come from <1% of pixels, then it is considered to be noise-dominated and hence unusable.
| Quadrant | # 1 sec bins | Bins with >0 counts | Bins with >2000 counts | High rate bins dominated by noise | Noise dominated (total time) | Noise dominated (detector-on time) | Marked lightcurve |
|---|---|---|---|---|---|---|---|
| A | 7914 | 7545 | 95 | 95 | 1.20% | 1.26% | 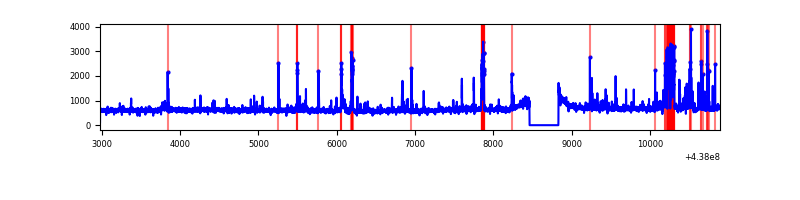 |
| B | 7915 | 7546 | 42 | 42 | 0.53% | 0.56% | 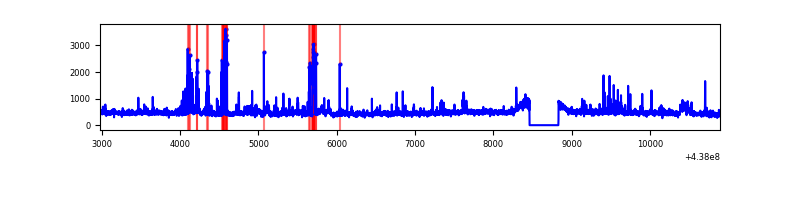 |
| C | 7915 | 7546 | 69 | 69 | 0.87% | 0.91% | 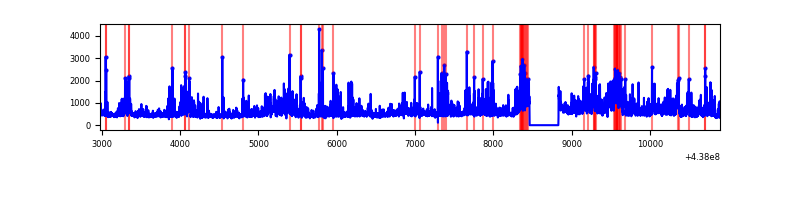 |
| D | 7915 | 7545 | 604 | 604 | 7.63% | 8.01% | 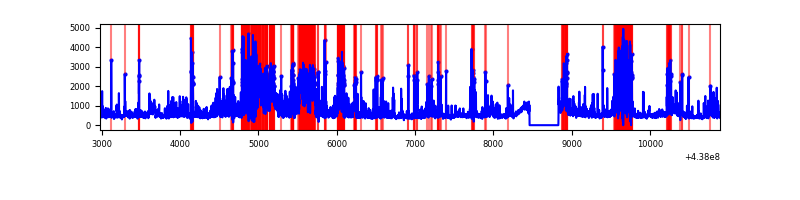 |
Top three noisy pixels from each quadrant. If the there are fewer than three noisy pixels in the level2.evt file, extra rows are filled as -1
| Pixel properties | Quadrant properties | ||||||
|---|---|---|---|---|---|---|---|
| Quadrant | DetID | PixID | Counts | Sigma | Mean | Median | Sigma |
| A | 10 | 83 | 1289856 | 7277.73 | 840 | 821 | 177.1 |
| A | 14 | 238 | 502183 | 2830.63 | 840 | 821 | 177.1 |
| A | 15 | 222 | 191155 | 1074.6 | 840 | 821 | 177.1 |
| B | 3 | 112 | 137537 | 811.83 | 841 | 813 | 168.4 |
| B | 2 | 2 | 129531 | 764.29 | 841 | 813 | 168.4 |
| B | 15 | 36 | 111097 | 654.84 | 841 | 813 | 168.4 |
| C | 3 | 233 | 1466070 | 7474.31 | 821 | 825 | 196.0 |
| C | 15 | 158 | 249439 | 1268.2 | 821 | 825 | 196.0 |
| C | 15 | 157 | 43718 | 218.8 | 821 | 825 | 196.0 |
| D | 5 | 222 | 658647 | 3214.32 | 802 | 775 | 204.7 |
| D | 7 | 80 | 583911 | 2849.16 | 802 | 775 | 204.7 |
| D | 13 | 138 | 580341 | 2831.72 | 802 | 775 | 204.7 |
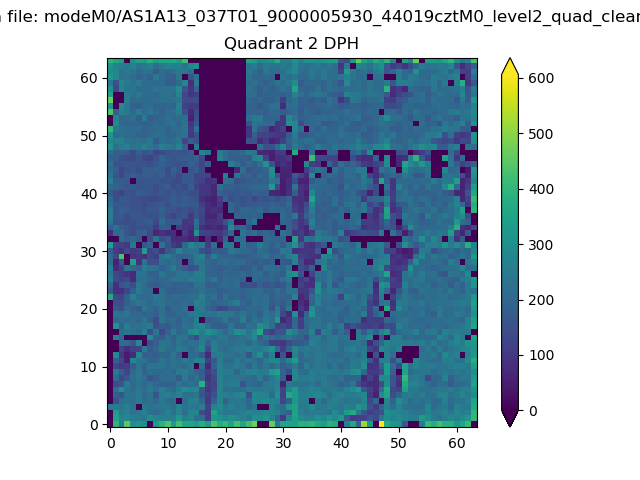
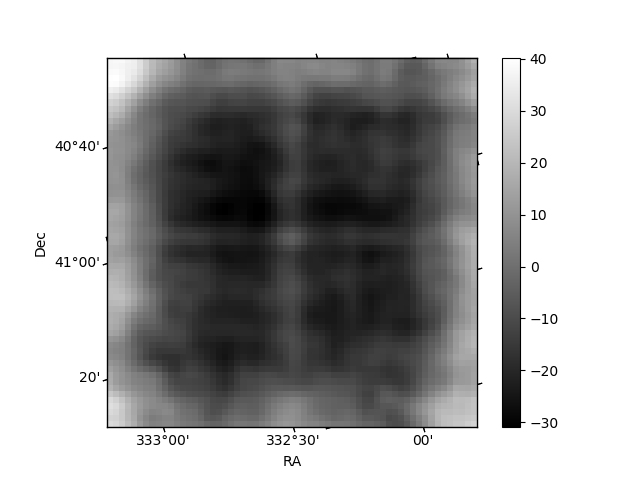
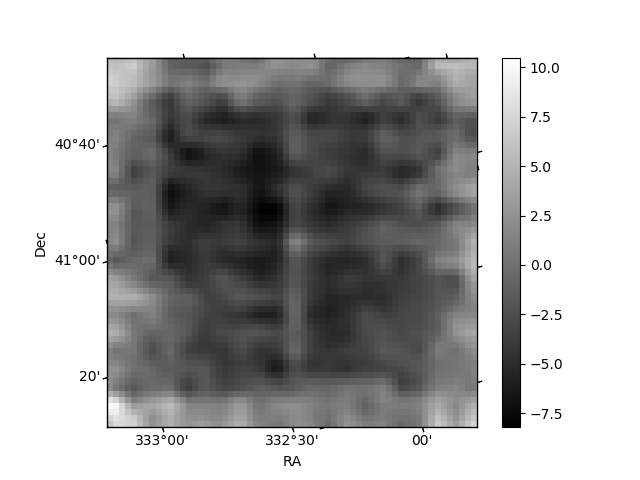
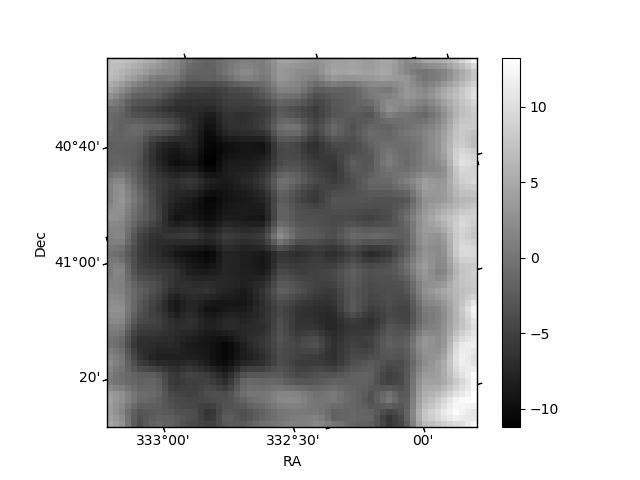
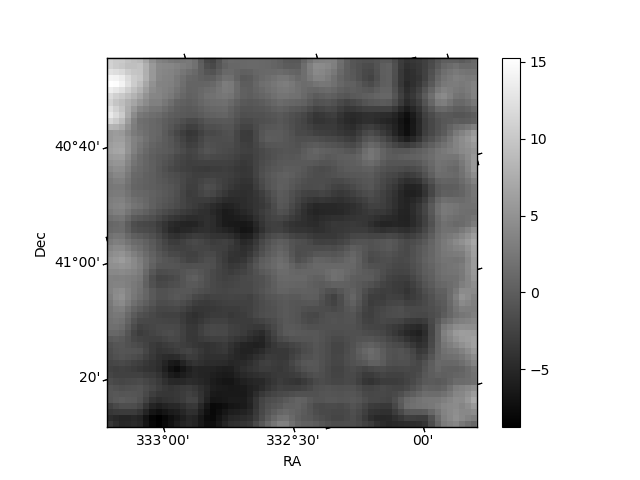
Histogram calculated using DETX and DETY for each event in the final _common_clean file
| Quadrant A | 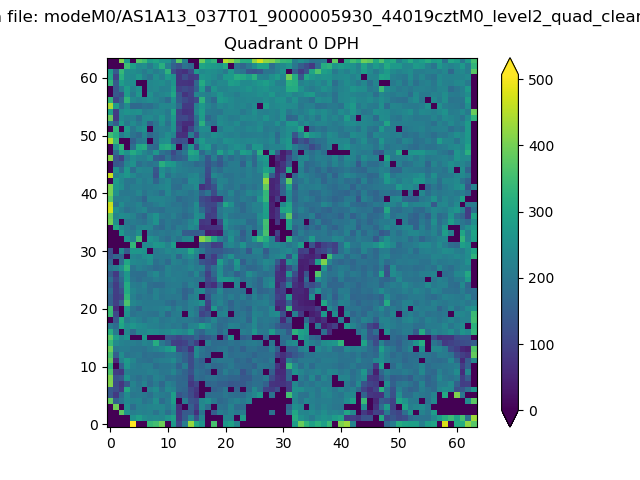 |
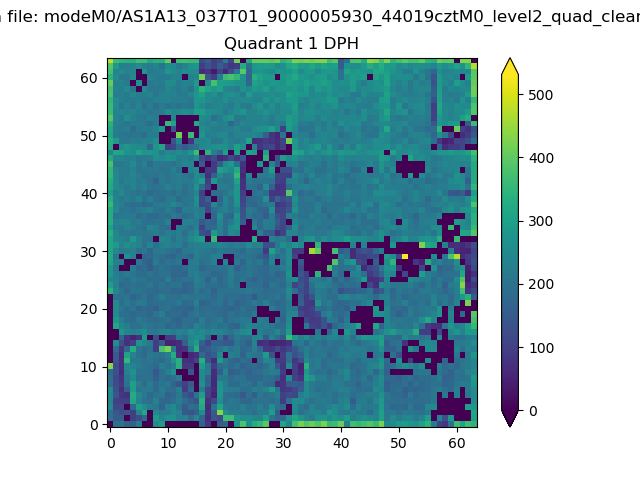 |
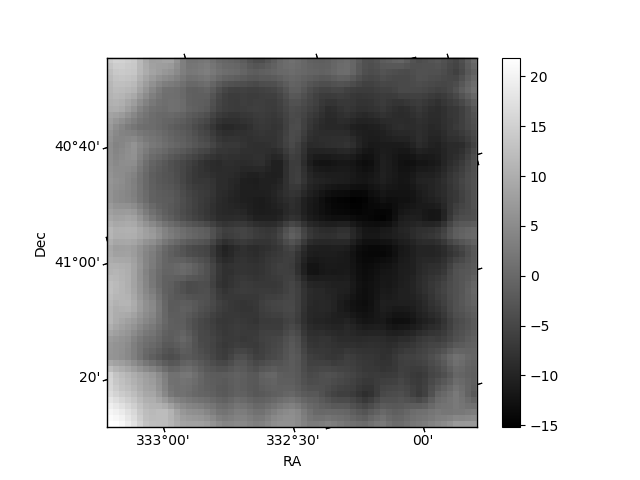
Quadrant B |
|---|---|---|---|
| Quadrant D | 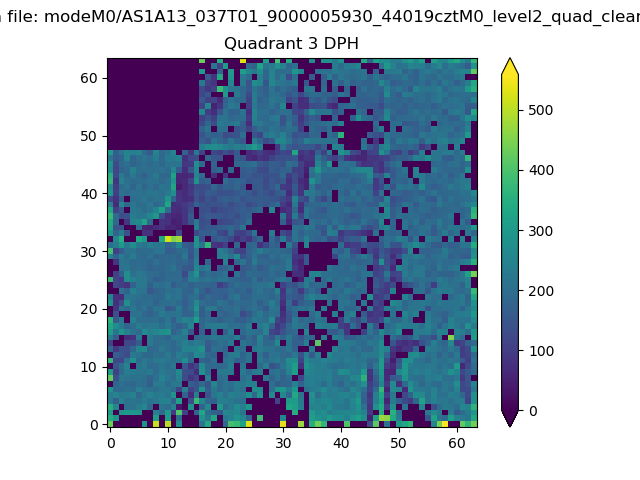 |
 |
Quadrant C |
| Plot type | Count rate plots | Images |
|---|---|---|
| Comparison with Poisson distribution Blue bars denote a histogram of data divided into 1 sec bins. Red curve is a Poisson curve with rate = median count rate of data. |
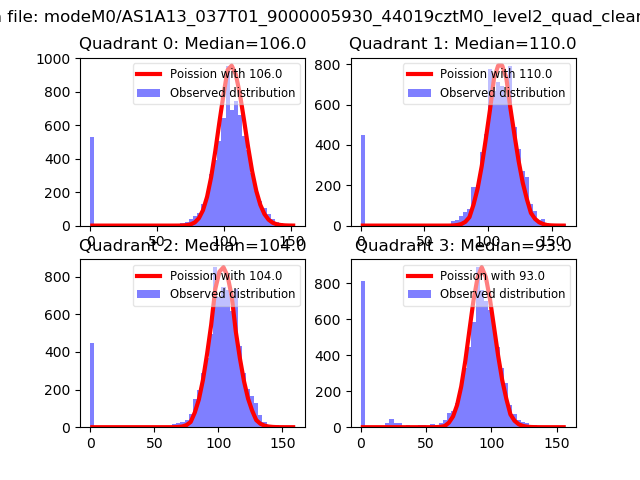 |
 |
| Quadrant-wise count rates Data is divided into 100 sec bins |
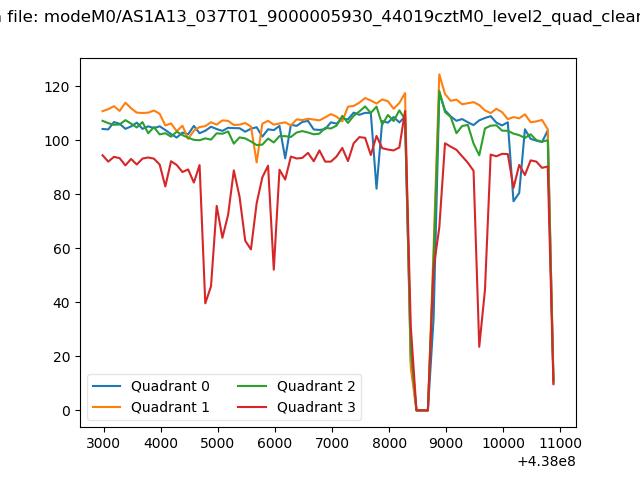 |
|
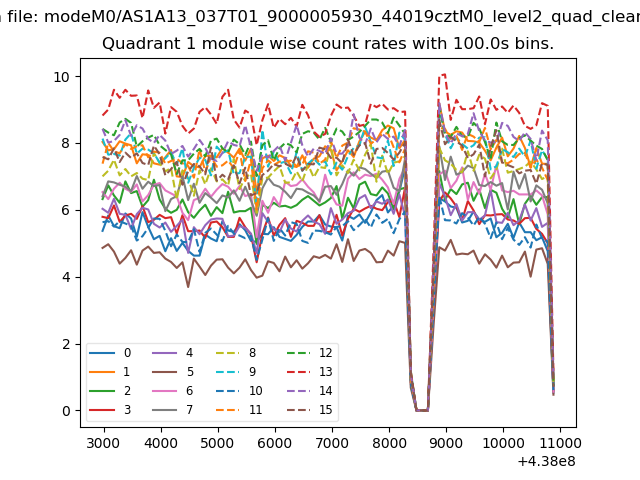
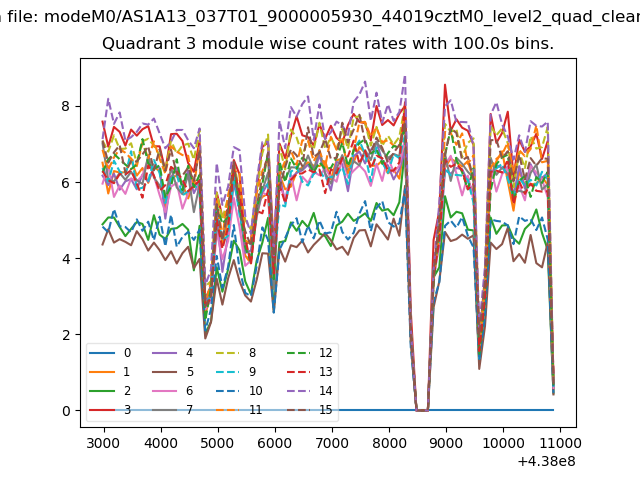
| Module-wise count rates for Quadrant A Data is divided into 100 sec bins |
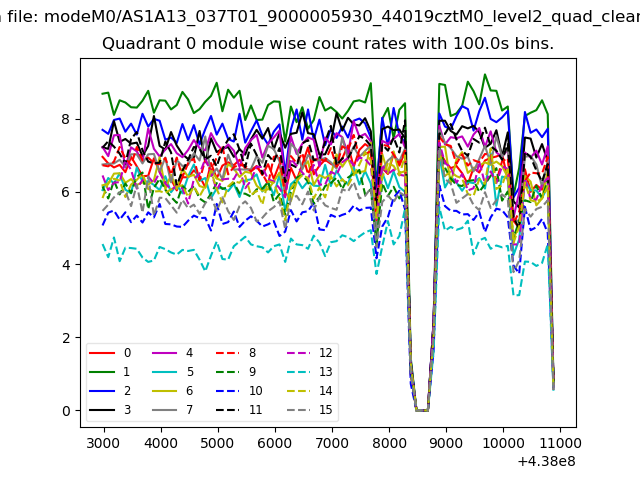 |
 |
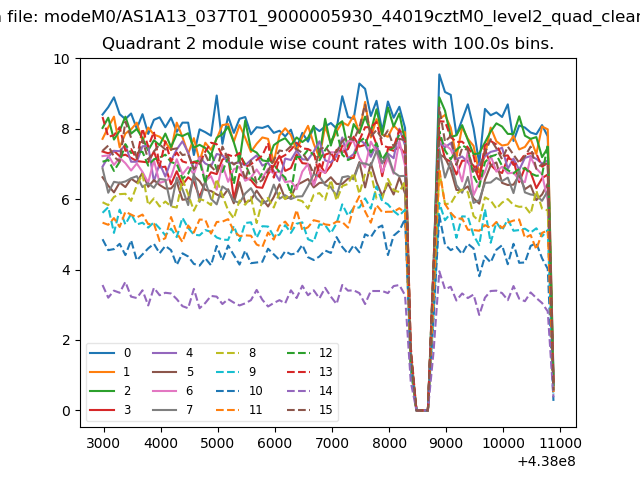
| Module-wise count rates for Quadrant B Data is divided into 100 sec bins |
 |
 |
| Module-wise count rates for Quadrant C Data is divided into 100 sec bins |
 |
 |
| Module-wise count rates for Quadrant D Data is divided into 100 sec bins |
 |
 |
| Parameter | Plot |
|---|---|
| CZT HV Monitor | 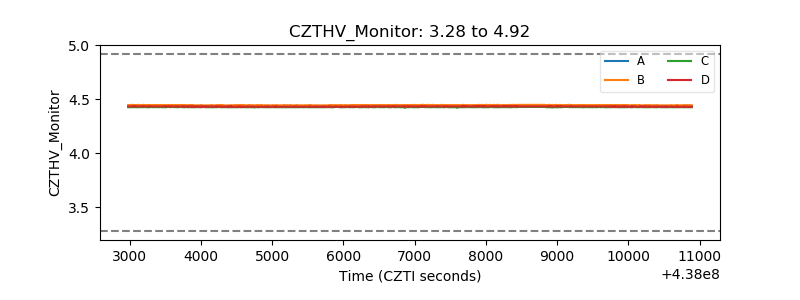 |
| D_VDD | 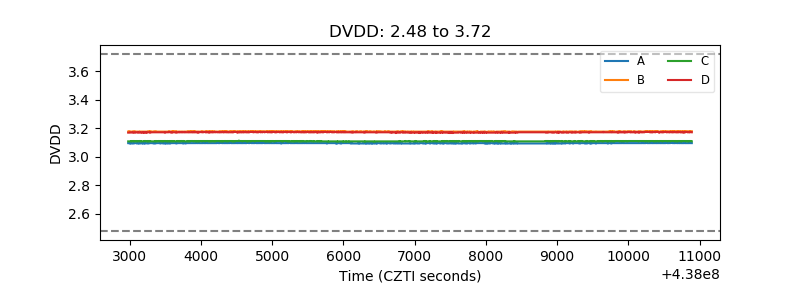 |
| Temperature 1 | 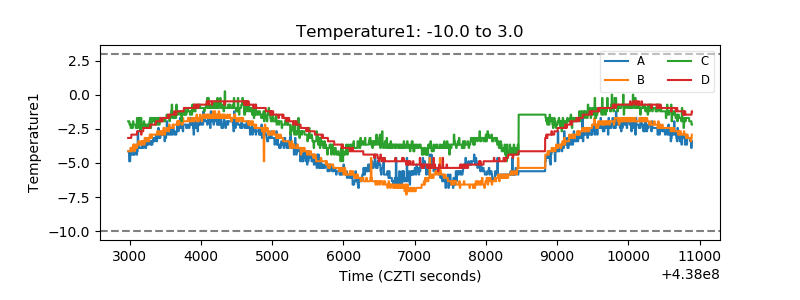 |
| Veto HV Monitor | 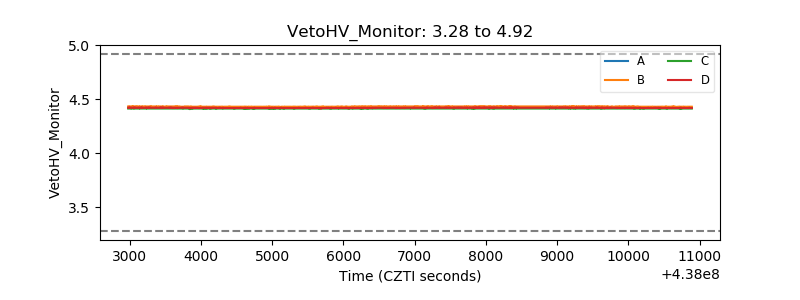 |
| Veto LLD | 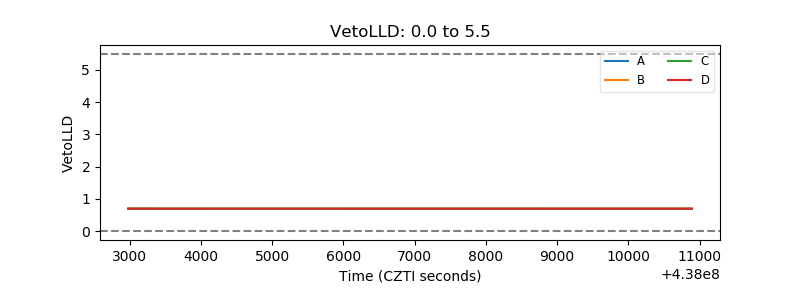 |
| Alpha Counter | 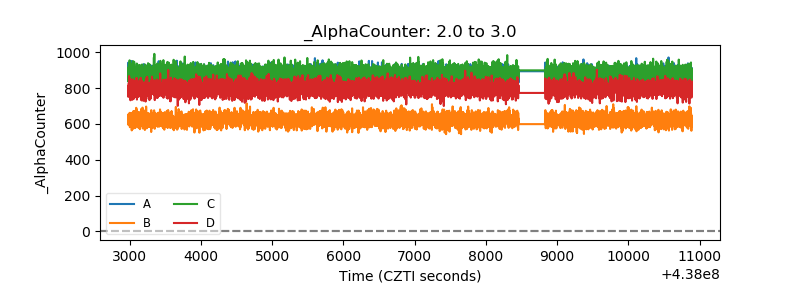 |
| _CPM_Rate | 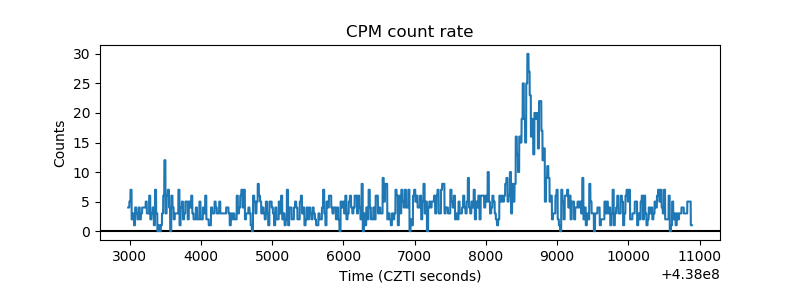 |
| CZT Counter | 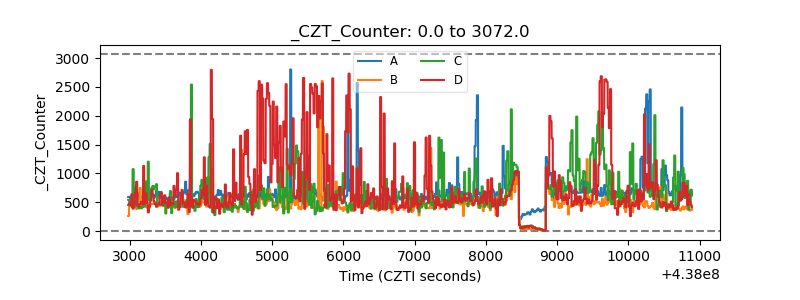 |
| +2.5 Volts monitor |  |
| +5 Volts monitor | 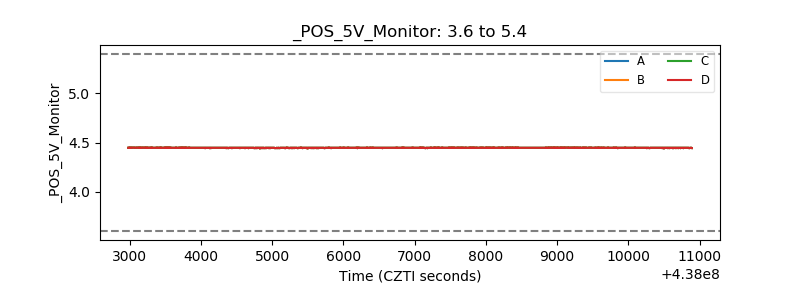 |
| _ROLL_ROT | 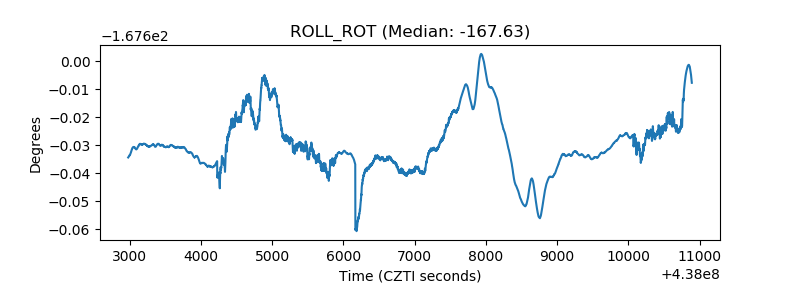 |
| _Roll_DEC | 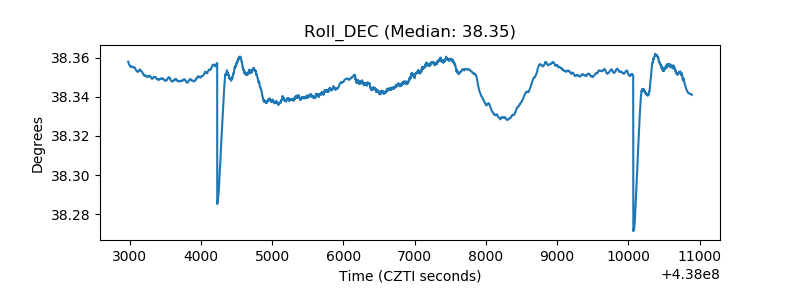 |
| _Roll_RA | 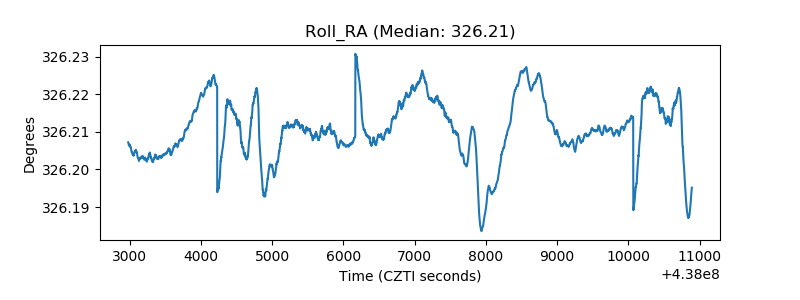 |
| Veto Counter | 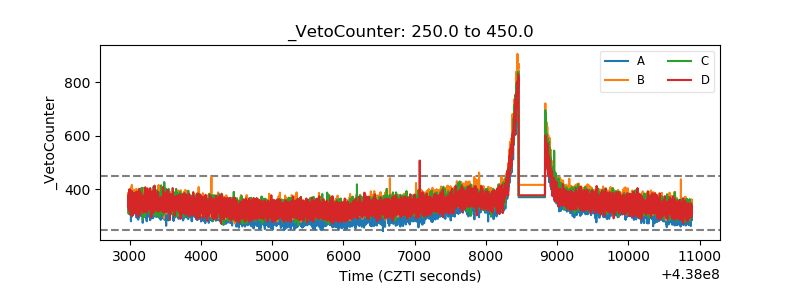 |