| Param | Original file | Final file |
|---|---|---|
| Filename | modeM0/AS1A13_023T01_9000005932_44019cztM0_level2.fits | modeM0/AS1A13_023T01_9000005932_44019cztM0_level2_quad_clean.evt |
| Size (bytes) | 671,915,520 | 155,367,360 |
| Size | 640.8 MB | 148.2 MB |
| Events in quadrant A | 6,790,619 | 1,036,913 |
| Events in quadrant B | 4,917,745 | 1,073,228 |
| Events in quadrant C | 5,671,615 | 1,022,699 |
| Events in quadrant D | 6,736,512 | 895,424 |
| Mode M9 | |||
|---|---|---|---|
| Quadrant | BADHDUFLAG | Total packets | Discarded packets |
| A | 0 | 15 | 0 |
| B | 0 | 15 | 0 |
| C | 0 | 15 | 0 |
| D | 0 | 15 | 0 |
| Mode SS | |||
|---|---|---|---|
| Quadrant | BADHDUFLAG | Total packets | Discarded packets |
| A | 0 | 198 | 0 |
| B | 0 | 198 | 0 |
| C | 0 | 198 | 0 |
| D | 0 | 198 | 0 |
| Mode M0 | |||
|---|---|---|---|
| Quadrant | BADHDUFLAG | Total packets | Discarded packets |
| A | 0 | 27445 | 2 |
| B | 0 | 20940 | 2 |
| C | 0 | 23513 | 3 |
| D | 0 | 26667 | 2 |
| Quadrant | Total seconds | Saturated seconds | Saturation percentage |
|---|---|---|---|
| A | 9750 | 236 | 2.420513% |
| B | 9750 | 133 | 1.364103% |
| C | 9749 | 108 | 1.107806% |
| D | 9749 | 548 | 5.621089% |
Noise dominated data is calculated using 1-second bins in cleaned event files. If a bin has >2000 counts, and if more than 50% of those come from <1% of pixels, then it is considered to be noise-dominated and hence unusable.
| Quadrant | # 1 sec bins | Bins with >0 counts | Bins with >2000 counts | High rate bins dominated by noise | Noise dominated (total time) | Noise dominated (detector-on time) | Marked lightcurve |
|---|---|---|---|---|---|---|---|
| A | 11150 | 9752 | 58 | 58 | 0.52% | 0.59% | 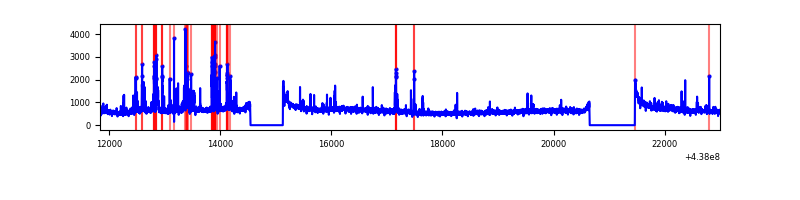 |
| B | 11150 | 9752 | 6 | 6 | 0.05% | 0.06% | 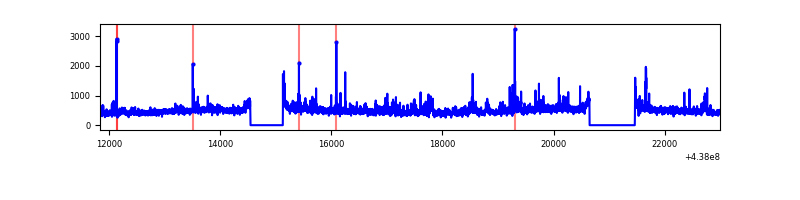 |
| C | 11149 | 9751 | 53 | 53 | 0.48% | 0.54% | 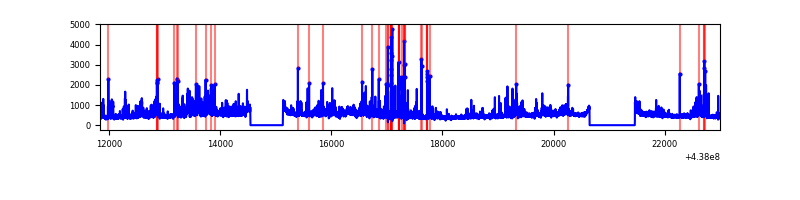 |
| D | 11149 | 9751 | 426 | 426 | 3.82% | 4.37% | 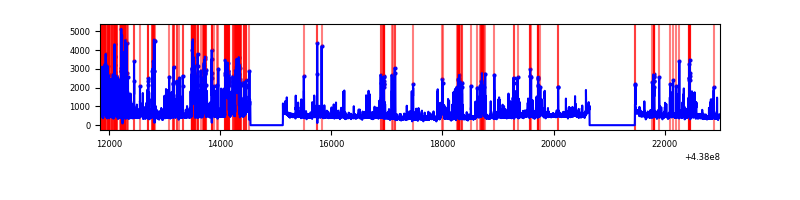 |
Top three noisy pixels from each quadrant. If the there are fewer than three noisy pixels in the level2.evt file, extra rows are filled as -1
| Pixel properties | Quadrant properties | ||||||
|---|---|---|---|---|---|---|---|
| Quadrant | DetID | PixID | Counts | Sigma | Mean | Median | Sigma |
| A | 10 | 83 | 1703102 | 7428.05 | 1101 | 1075 | 229.1 |
| A | 14 | 238 | 465672 | 2027.61 | 1101 | 1075 | 229.1 |
| A | 15 | 222 | 305902 | 1330.34 | 1101 | 1075 | 229.1 |
| B | 2 | 2 | 243319 | 1113.12 | 1104 | 1069 | 217.6 |
| B | 3 | 112 | 145274 | 662.61 | 1104 | 1069 | 217.6 |
| B | 4 | 171 | 63722 | 287.88 | 1104 | 1069 | 217.6 |
| C | 3 | 233 | 1000266 | 3925.91 | 1078 | 1082 | 254.5 |
| C | 14 | 254 | 393779 | 1542.95 | 1078 | 1082 | 254.5 |
| C | 15 | 1 | 51102 | 196.53 | 1078 | 1082 | 254.5 |
| D | 1 | 52 | 953015 | 3611.84 | 1049 | 1015 | 263.6 |
| D | 13 | 249 | 548380 | 2076.68 | 1049 | 1015 | 263.6 |
| D | 12 | 18 | 357472 | 1352.38 | 1049 | 1015 | 263.6 |
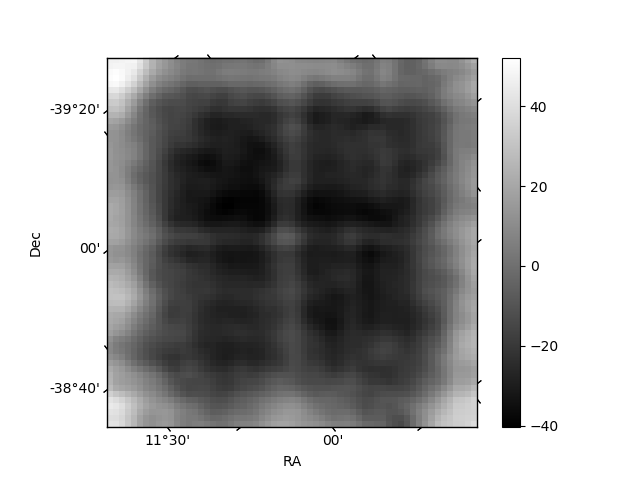
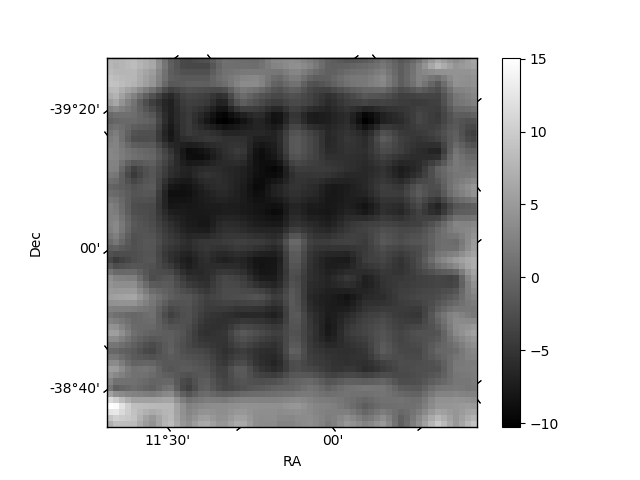
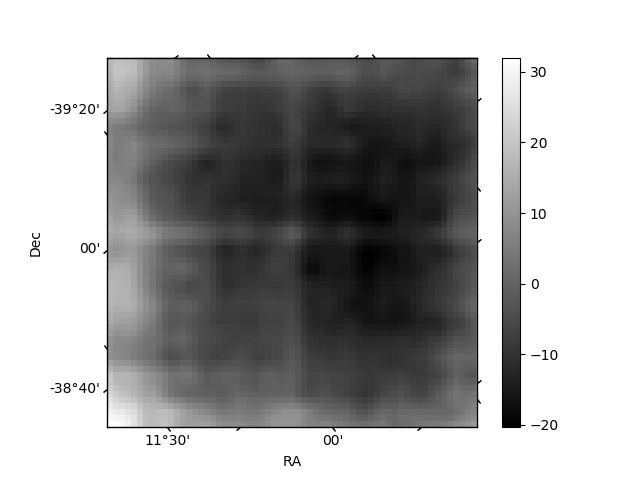
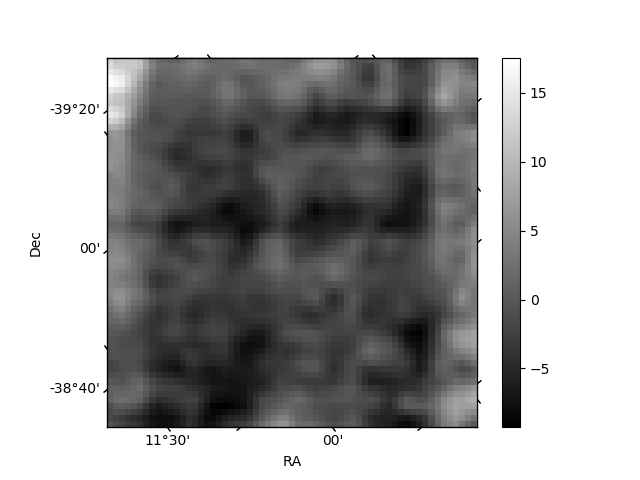
Histogram calculated using DETX and DETY for each event in the final _common_clean file
| Quadrant A | 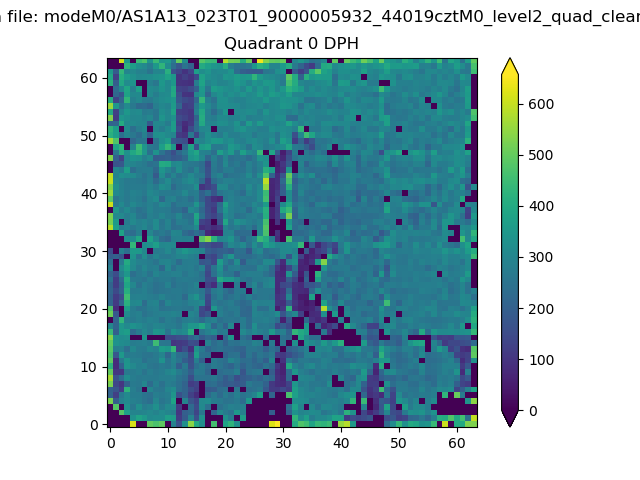 |
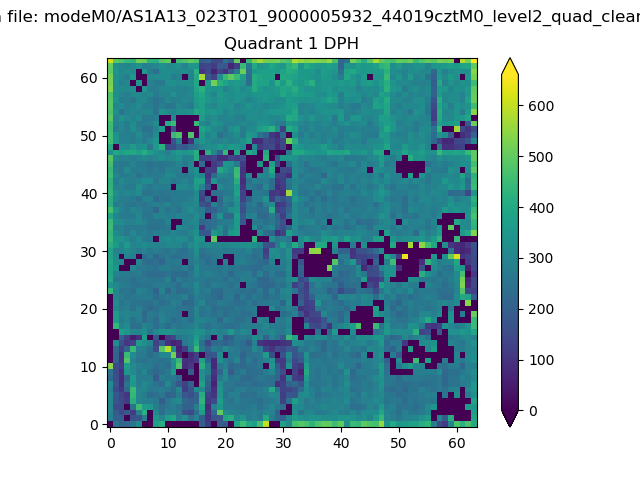 |
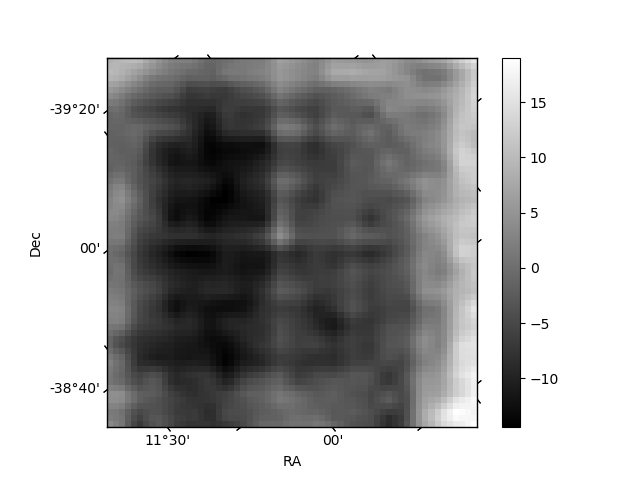
Quadrant B |
|---|---|---|---|
| Quadrant D | 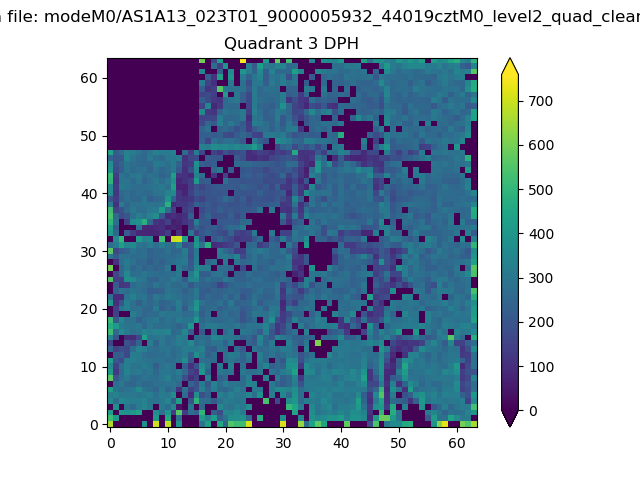 |
 |
Quadrant C |
| Plot type | Count rate plots | Images |
|---|---|---|
| Comparison with Poisson distribution Blue bars denote a histogram of data divided into 1 sec bins. Red curve is a Poisson curve with rate = median count rate of data. |
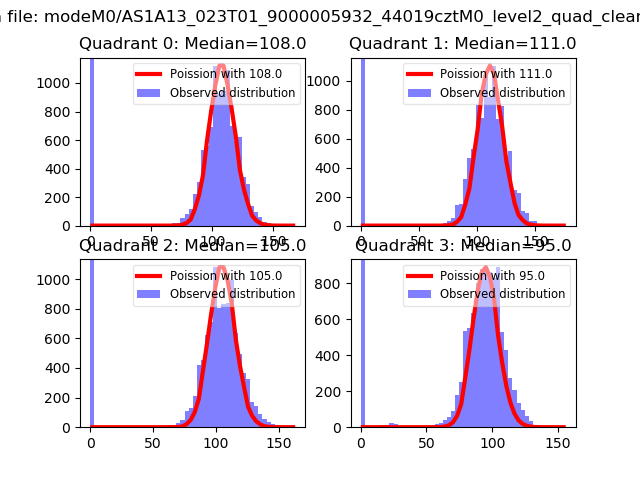 |
 |
| Quadrant-wise count rates Data is divided into 100 sec bins |
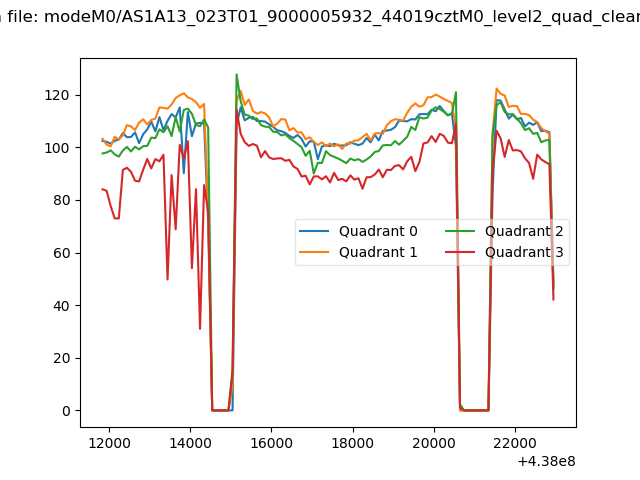 |
|
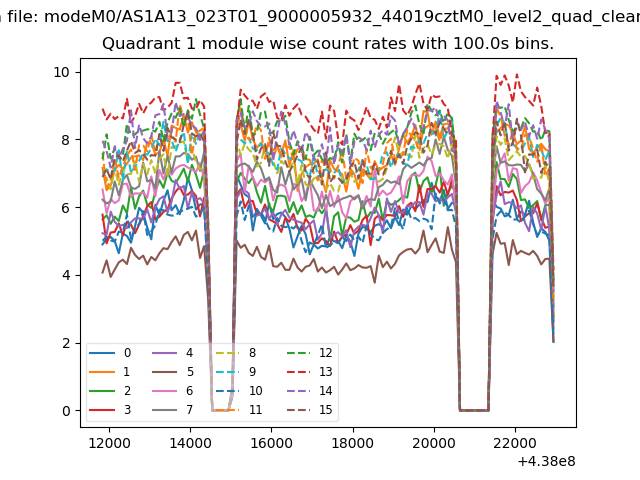
| Module-wise count rates for Quadrant A Data is divided into 100 sec bins |
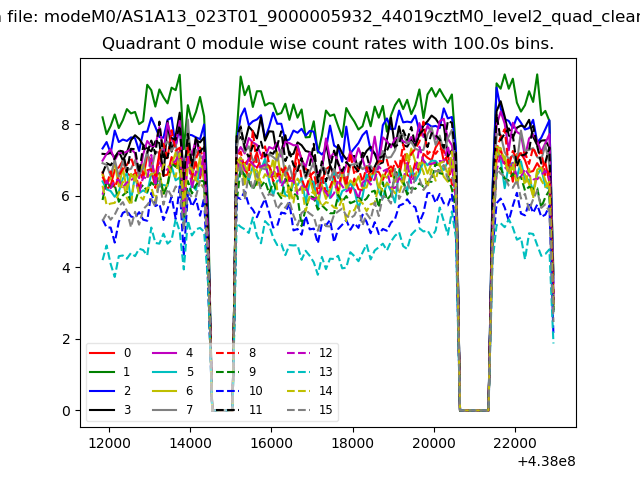 |
 |
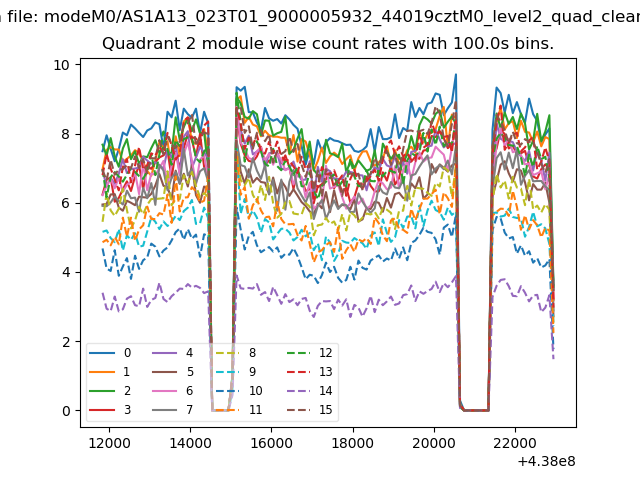
| Module-wise count rates for Quadrant B Data is divided into 100 sec bins |
 |
 |
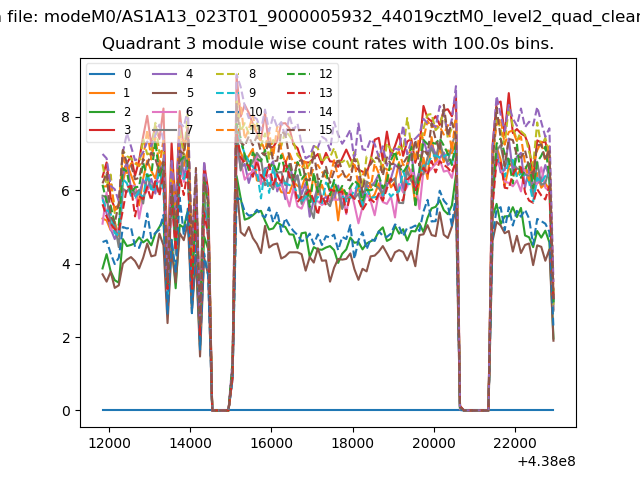
| Module-wise count rates for Quadrant C Data is divided into 100 sec bins |
 |
 |
| Module-wise count rates for Quadrant D Data is divided into 100 sec bins |
 |
 |
| Parameter | Plot |
|---|---|
| CZT HV Monitor |  |
| D_VDD | 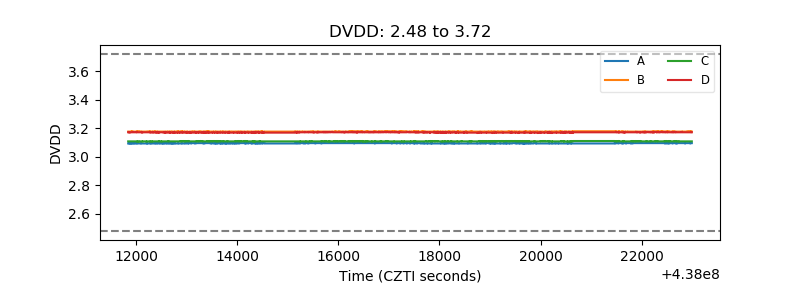 |
| Temperature 1 | 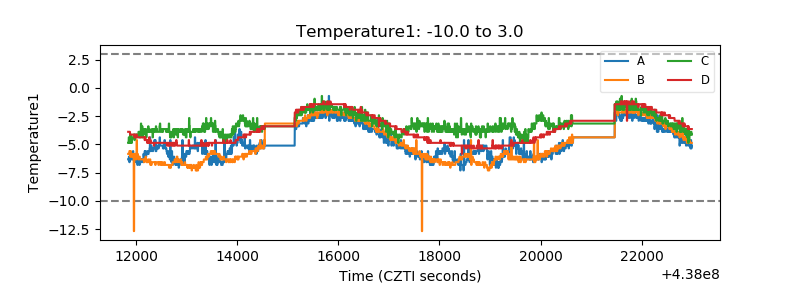 |
| Veto HV Monitor | 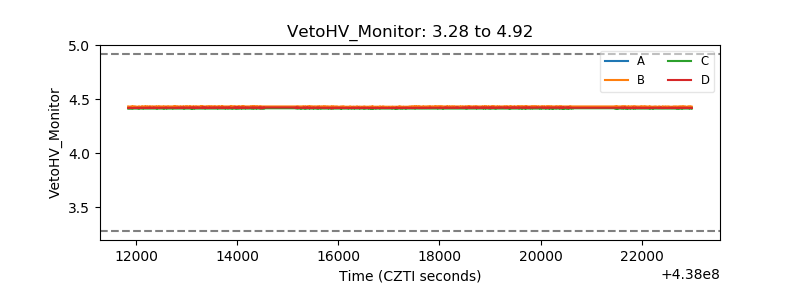 |
| Veto LLD | 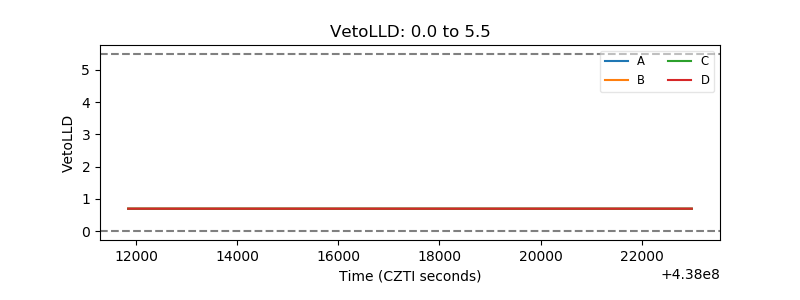 |
| Alpha Counter | 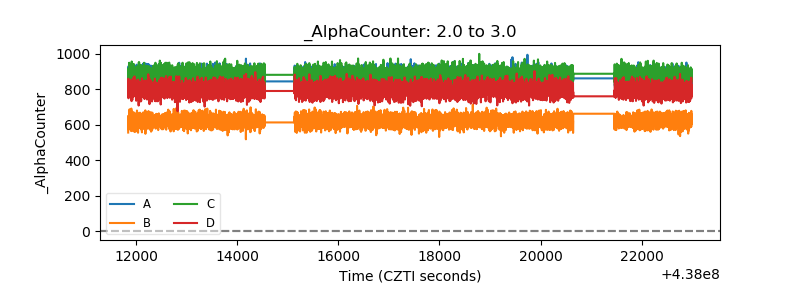 |
| _CPM_Rate | 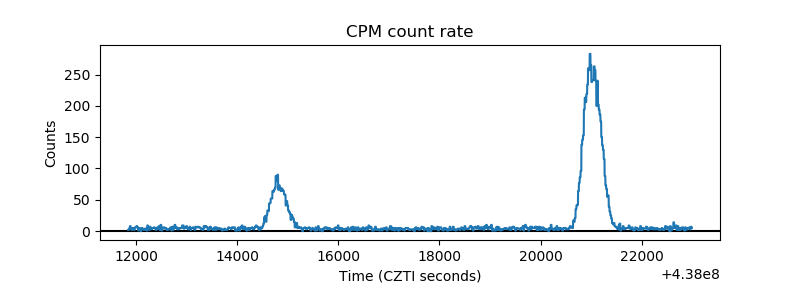 |
| CZT Counter |  |
| +2.5 Volts monitor | 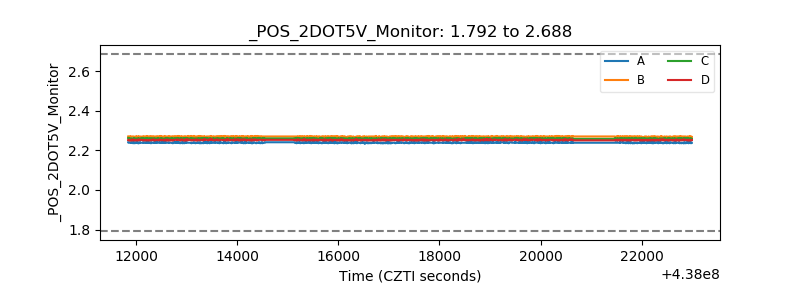 |
| +5 Volts monitor | 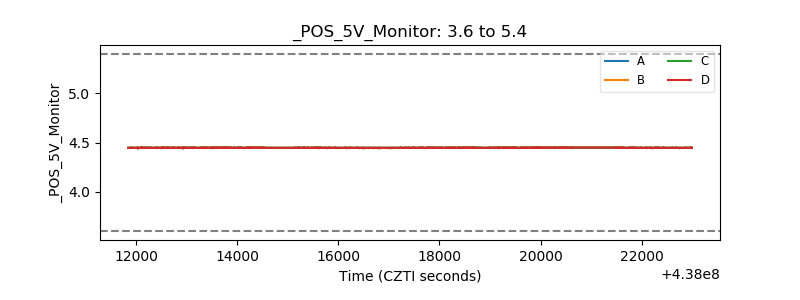 |
| _ROLL_ROT | 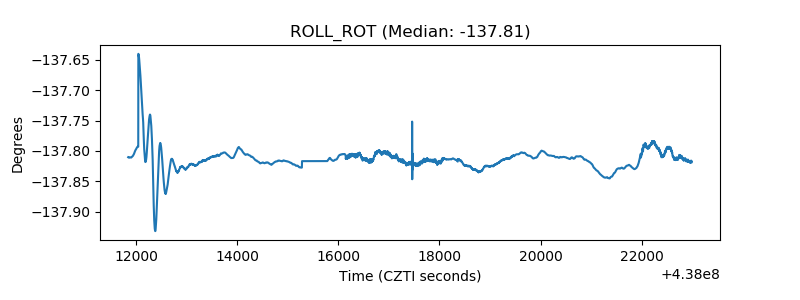 |
| _Roll_DEC | 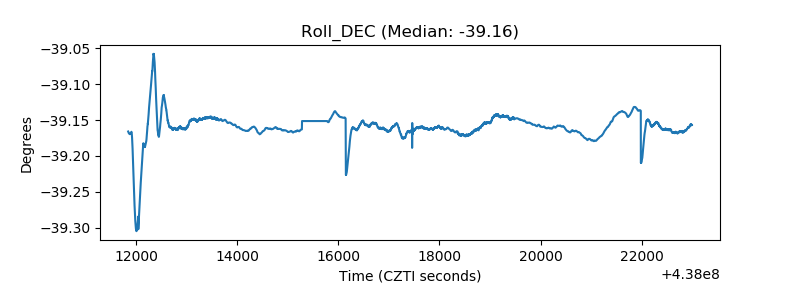 |
| _Roll_RA | 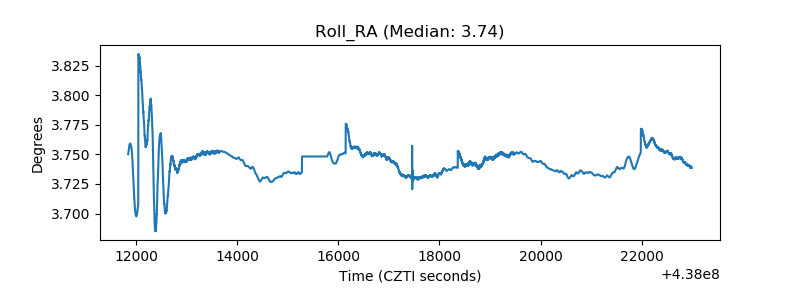 |
| Veto Counter | 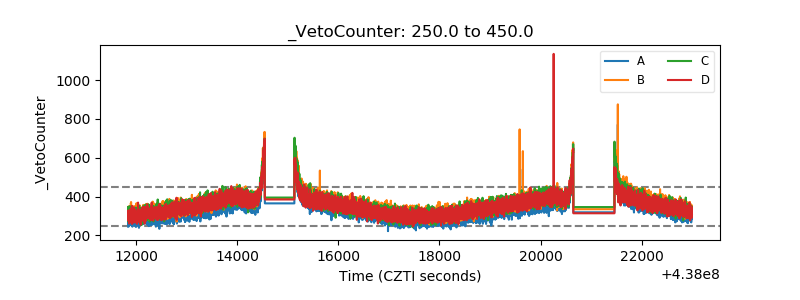 |