| Param | Original file | Final file |
|---|---|---|
| Filename | modeM0/AS1A13_023T01_9000005932_44020cztM0_level2.fits | modeM0/AS1A13_023T01_9000005932_44020cztM0_level2_quad_clean.evt |
| Size (bytes) | 454,098,240 | 108,227,520 |
| Size | 433.1 MB | 103.2 MB |
| Events in quadrant A | 4,401,298 | 729,937 |
| Events in quadrant B | 3,442,248 | 749,449 |
| Events in quadrant C | 3,379,303 | 712,898 |
| Events in quadrant D | 5,065,540 | 617,012 |
| Mode M9 | |||
|---|---|---|---|
| Quadrant | BADHDUFLAG | Total packets | Discarded packets |
| A | 0 | 9 | 0 |
| B | 0 | 9 | 0 |
| C | 0 | 9 | 0 |
| D | 0 | 9 | 0 |
| Mode SS | |||
|---|---|---|---|
| Quadrant | BADHDUFLAG | Total packets | Discarded packets |
| A | 0 | 138 | 0 |
| B | 0 | 138 | 0 |
| C | 0 | 138 | 0 |
| D | 0 | 138 | 0 |
| Mode M0 | |||
|---|---|---|---|
| Quadrant | BADHDUFLAG | Total packets | Discarded packets |
| A | 0 | 17881 | 2 |
| B | 0 | 14750 | 3 |
| C | 0 | 14651 | 2 |
| D | 0 | 19705 | 2 |
| Quadrant | Total seconds | Saturated seconds | Saturation percentage |
|---|---|---|---|
| A | 6703 | 72 | 1.074146% |
| B | 6702 | 70 | 1.044464% |
| C | 6702 | 33 | 0.492390% |
| D | 6703 | 525 | 7.832314% |
Noise dominated data is calculated using 1-second bins in cleaned event files. If a bin has >2000 counts, and if more than 50% of those come from <1% of pixels, then it is considered to be noise-dominated and hence unusable.
| Quadrant | # 1 sec bins | Bins with >0 counts | Bins with >2000 counts | High rate bins dominated by noise | Noise dominated (total time) | Noise dominated (detector-on time) | Marked lightcurve |
|---|---|---|---|---|---|---|---|
| A | 7668 | 6704 | 9 | 9 | 0.12% | 0.13% | 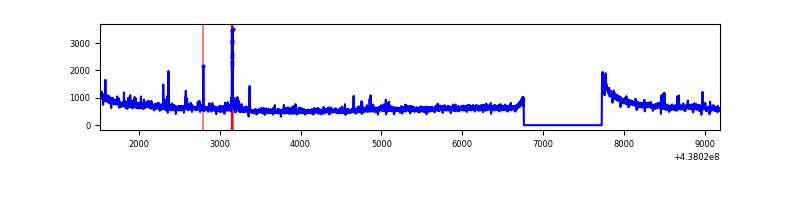 |
| B | 7667 | 6703 | 34 | 34 | 0.44% | 0.51% | 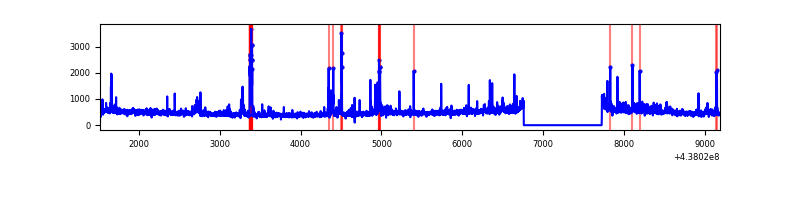 |
| C | 7667 | 6703 | 20 | 20 | 0.26% | 0.30% | 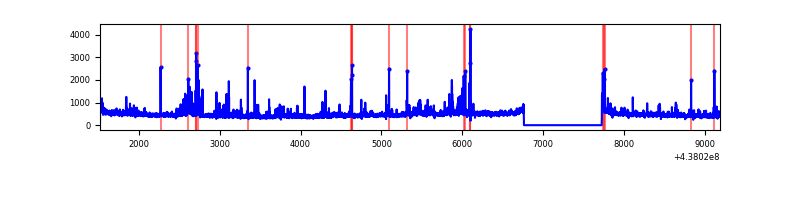 |
| D | 7668 | 6704 | 432 | 432 | 5.63% | 6.44% | 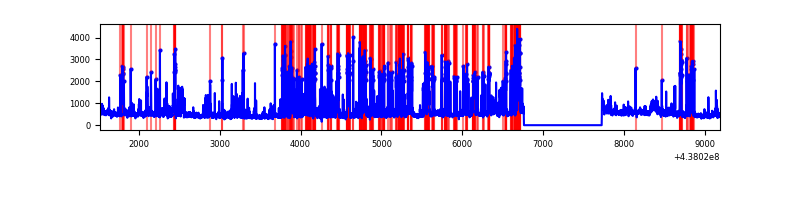 |
Top three noisy pixels from each quadrant. If the there are fewer than three noisy pixels in the level2.evt file, extra rows are filled as -1
| Pixel properties | Quadrant properties | ||||||
|---|---|---|---|---|---|---|---|
| Quadrant | DetID | PixID | Counts | Sigma | Mean | Median | Sigma |
| A | 10 | 83 | 1245216 | 7908.09 | 752 | 736 | 157.4 |
| A | 15 | 222 | 192785 | 1220.38 | 752 | 736 | 157.4 |
| A | 7 | 3 | 25237 | 155.69 | 752 | 736 | 157.4 |
| B | 0 | 213 | 130103 | 873.9 | 750 | 727 | 148.0 |
| B | 3 | 112 | 90491 | 606.33 | 750 | 727 | 148.0 |
| B | 2 | 2 | 79710 | 533.51 | 750 | 727 | 148.0 |
| C | 3 | 233 | 316064 | 1828.6 | 729 | 733 | 172.4 |
| C | 14 | 254 | 202197 | 1168.29 | 729 | 733 | 172.4 |
| C | 15 | 208 | 15994 | 88.5 | 729 | 733 | 172.4 |
| D | 5 | 222 | 1114233 | 6206.84 | 708 | 684 | 179.4 |
| D | 2 | 249 | 378963 | 2108.5 | 708 | 684 | 179.4 |
| D | 1 | 52 | 339656 | 1889.4 | 708 | 684 | 179.4 |
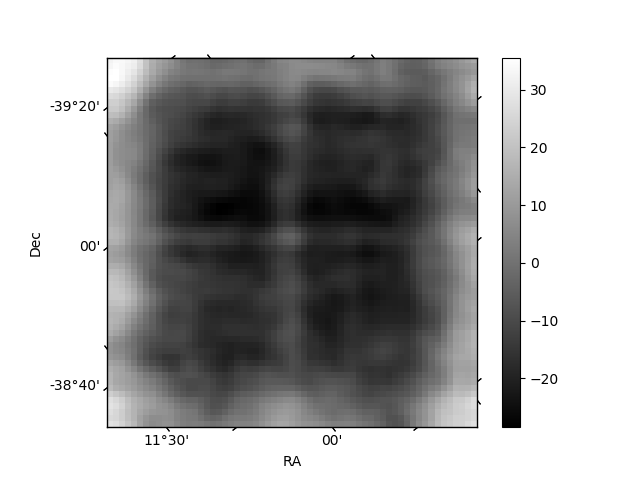
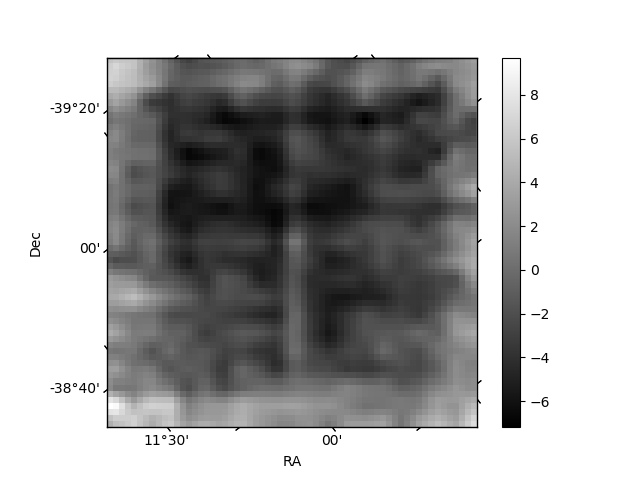
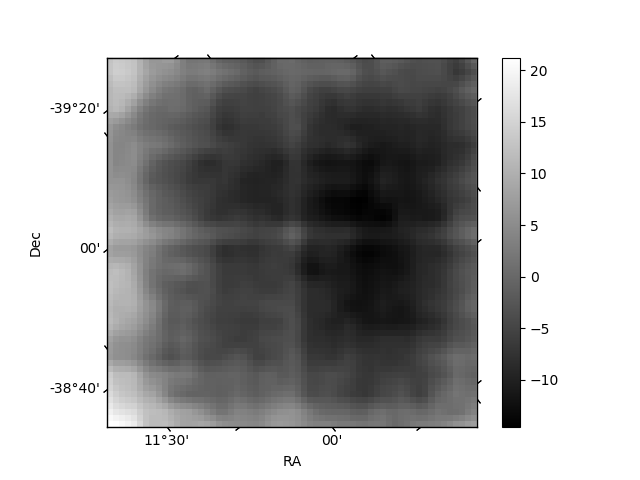
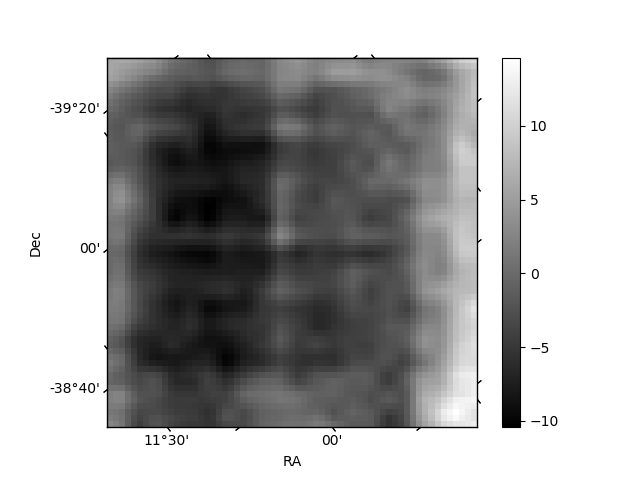
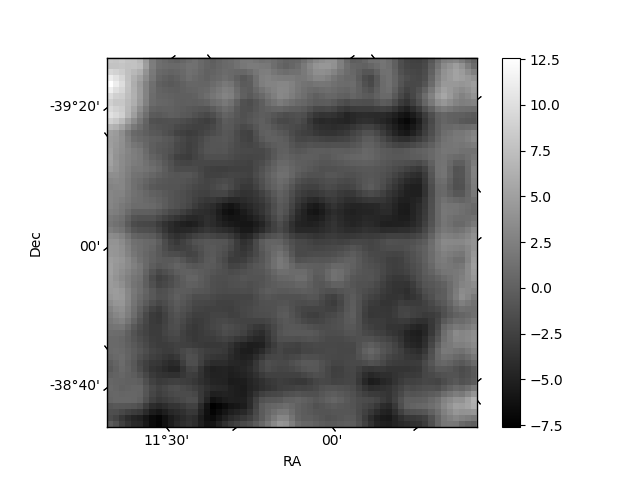
Histogram calculated using DETX and DETY for each event in the final _common_clean file
| Quadrant A | 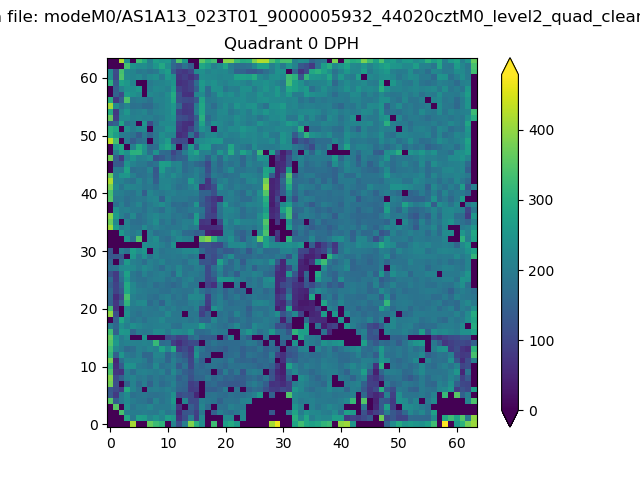 |
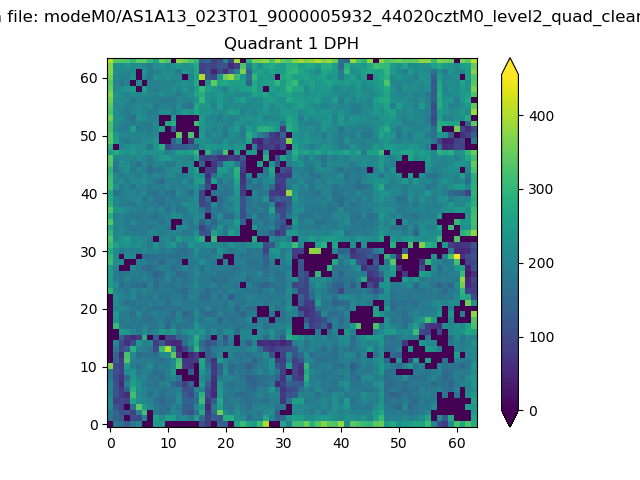 |
Quadrant B |
|---|---|---|---|
| Quadrant D | 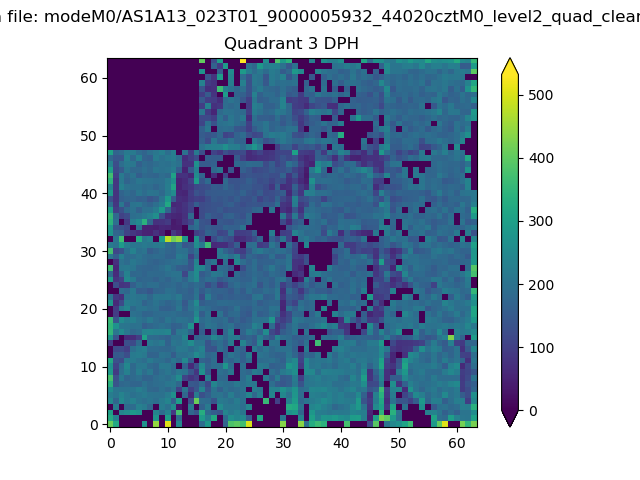 |
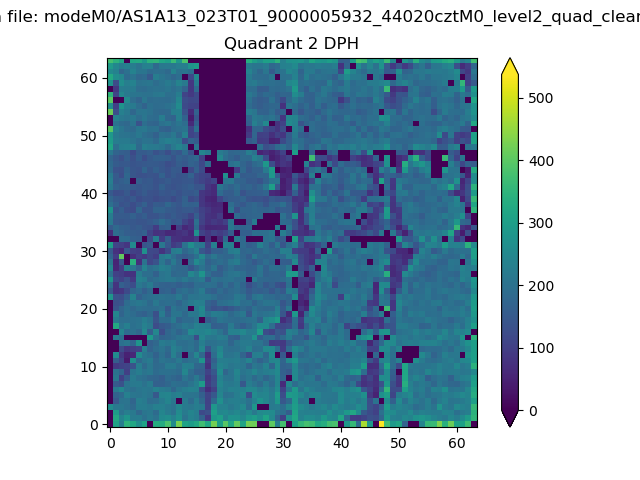 |
Quadrant C |
| Plot type | Count rate plots | Images |
|---|---|---|
| Comparison with Poisson distribution Blue bars denote a histogram of data divided into 1 sec bins. Red curve is a Poisson curve with rate = median count rate of data. |
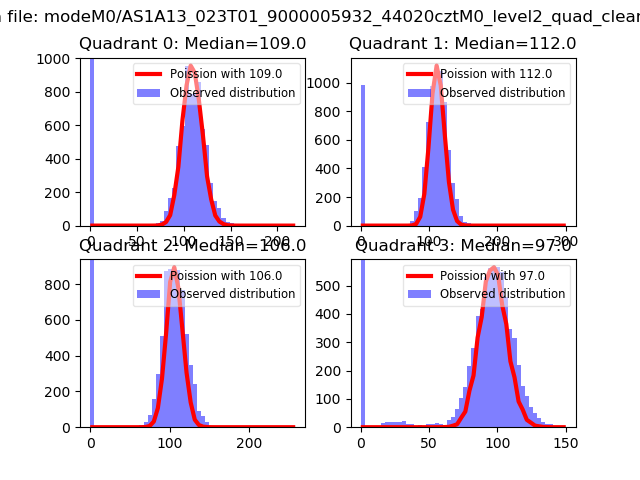 |
 |
| Quadrant-wise count rates Data is divided into 100 sec bins |
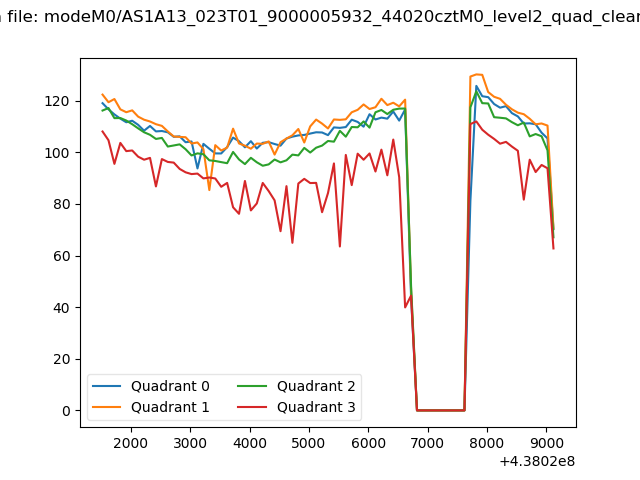 |
|
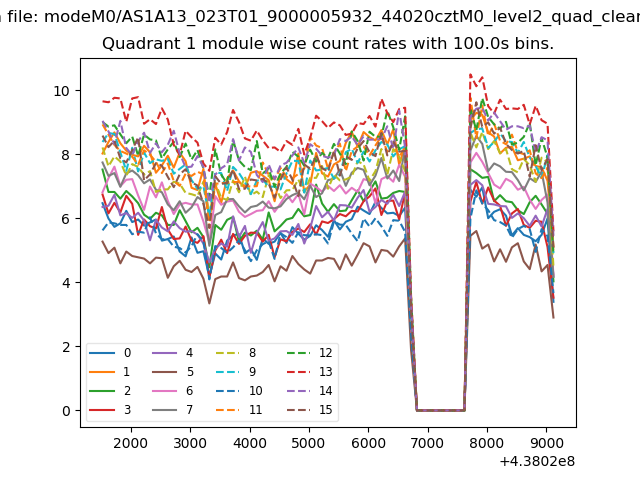
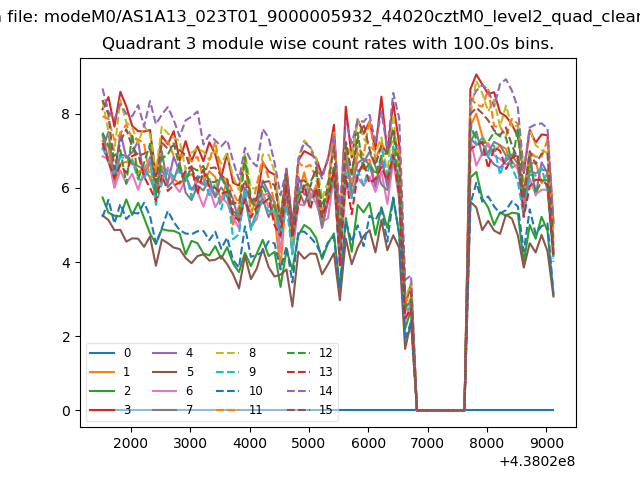
| Module-wise count rates for Quadrant A Data is divided into 100 sec bins |
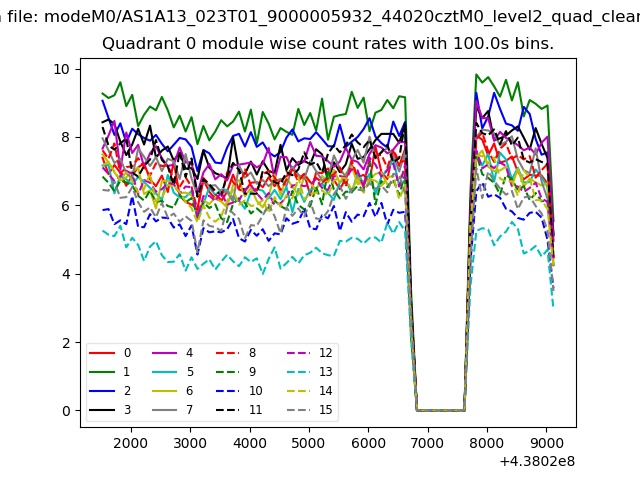 |
 |
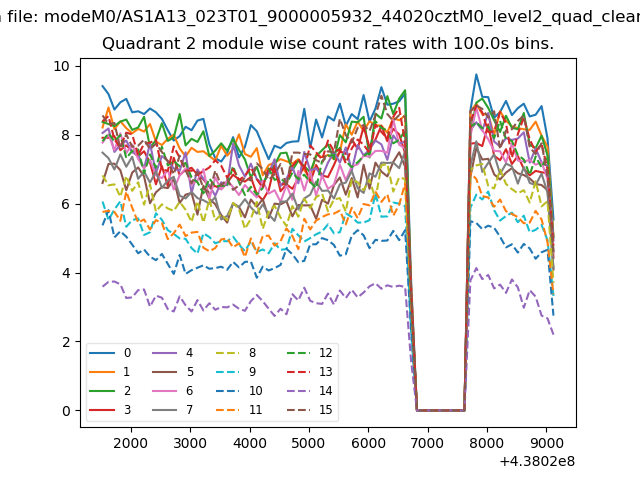
| Module-wise count rates for Quadrant B Data is divided into 100 sec bins |
 |
 |
| Module-wise count rates for Quadrant C Data is divided into 100 sec bins |
 |
 |
| Module-wise count rates for Quadrant D Data is divided into 100 sec bins |
 |
 |
| Parameter | Plot |
|---|---|
| CZT HV Monitor | 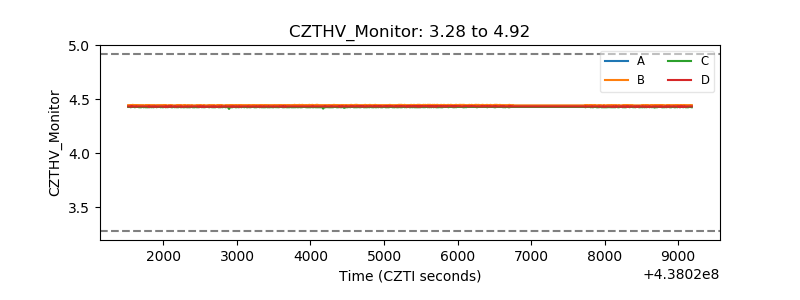 |
| D_VDD | 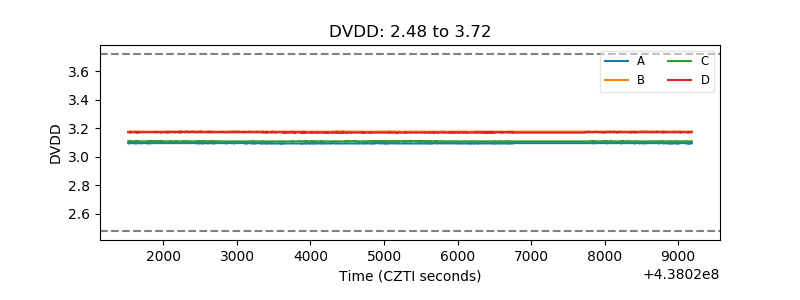 |
| Temperature 1 | 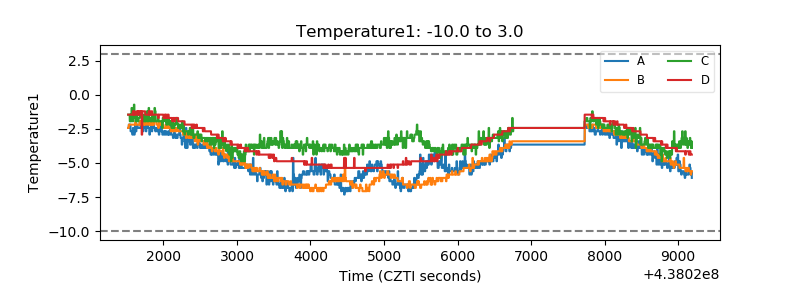 |
| Veto HV Monitor |  |
| Veto LLD | 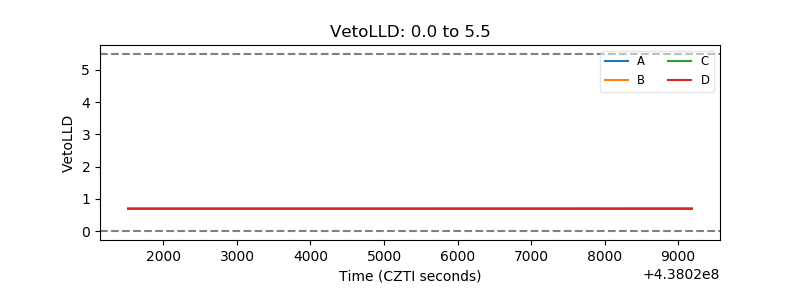 |
| Alpha Counter | 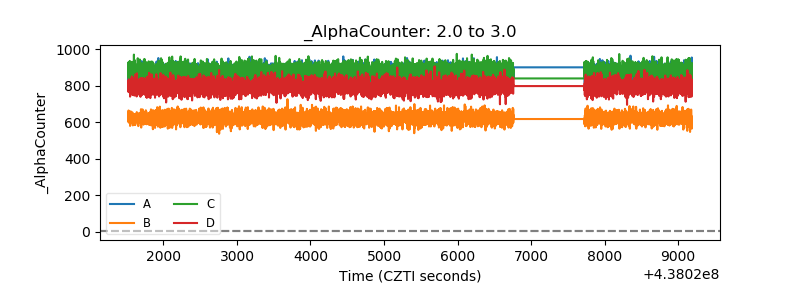 |
| _CPM_Rate | 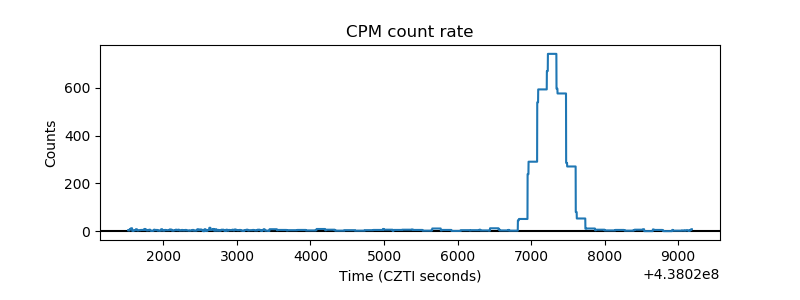 |
| CZT Counter | 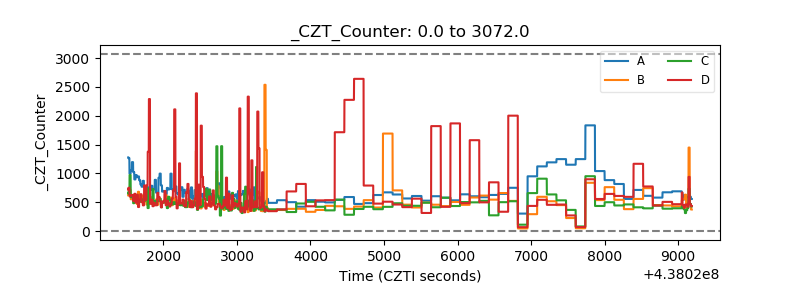 |
| +2.5 Volts monitor | 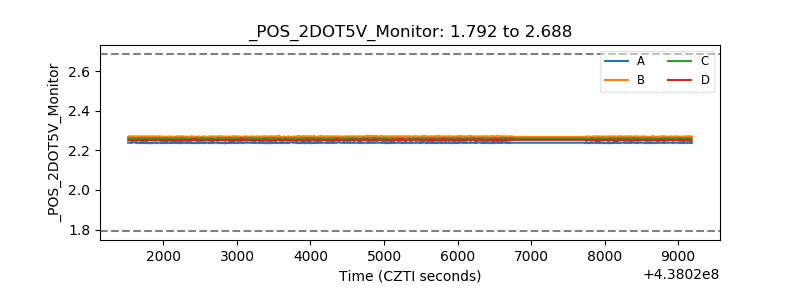 |
| +5 Volts monitor | 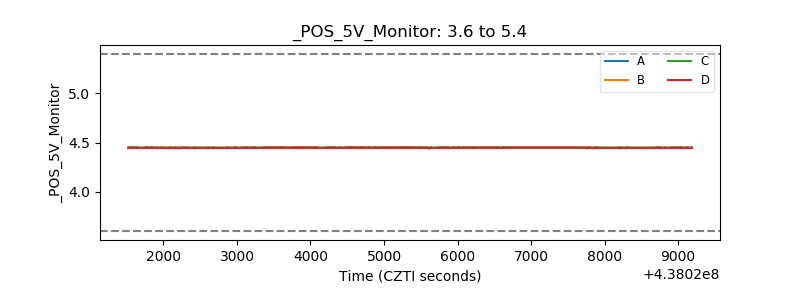 |
| _ROLL_ROT | 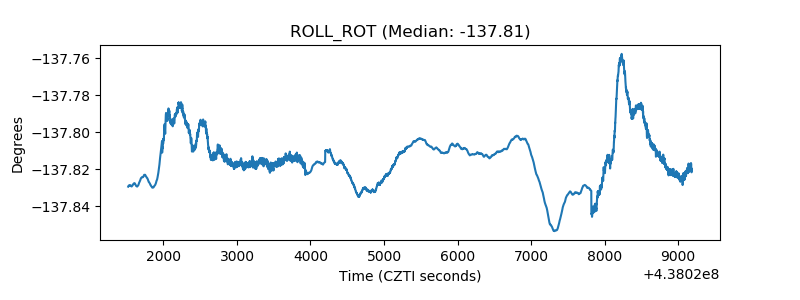 |
| _Roll_DEC | 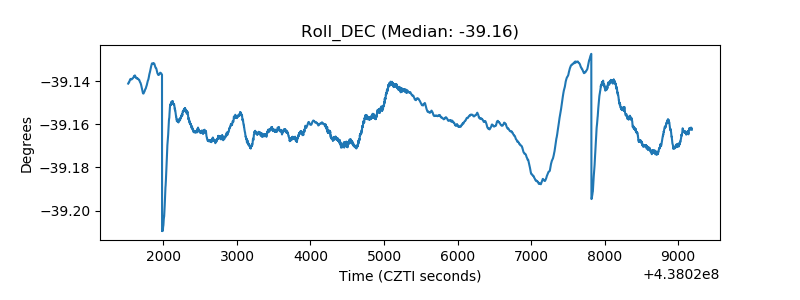 |
| _Roll_RA | 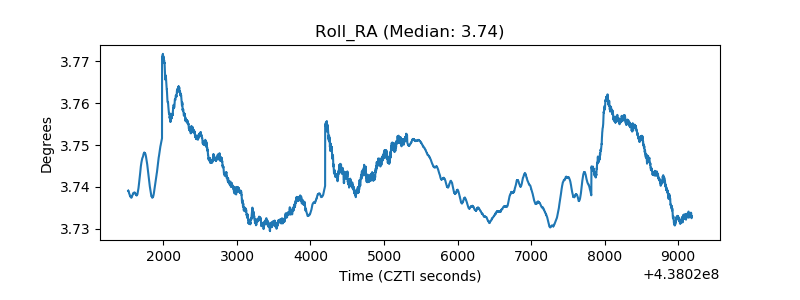 |
| Veto Counter | 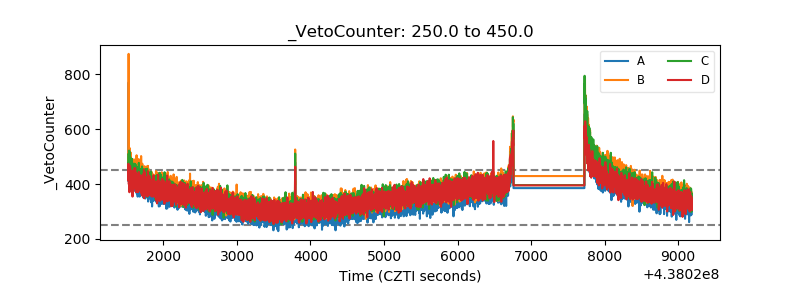 |