| Param | Original file | Final file |
|---|---|---|
| Filename | modeM0/AS1A13_023T03_9000005934_44023cztM0_level2.fits | modeM0/AS1A13_023T03_9000005934_44023cztM0_level2_quad_clean.evt |
| Size (bytes) | 311,685,120 | 79,225,920 |
| Size | 297.2 MB | 75.6 MB |
| Events in quadrant A | 2,980,987 | 531,938 |
| Events in quadrant B | 2,307,758 | 560,581 |
| Events in quadrant C | 2,327,368 | 528,032 |
| Events in quadrant D | 3,561,999 | 453,996 |
| Mode SS | |||
|---|---|---|---|
| Quadrant | BADHDUFLAG | Total packets | Discarded packets |
| A | 0 | 96 | 0 |
| B | 0 | 96 | 0 |
| C | 0 | 96 | 0 |
| D | 0 | 96 | 0 |
| Mode M9 | |||
|---|---|---|---|
| Quadrant | BADHDUFLAG | Total packets | Discarded packets |
| A | 0 | 11 | 0 |
| B | 0 | 11 | 0 |
| C | 0 | 11 | 0 |
| D | 0 | 11 | 0 |
| Mode M0 | |||
|---|---|---|---|
| Quadrant | BADHDUFLAG | Total packets | Discarded packets |
| A | 0 | 12076 | 2 |
| B | 0 | 9783 | 1 |
| C | 0 | 9922 | 1 |
| D | 0 | 13718 | 1 |
| Quadrant | Total seconds | Saturated seconds | Saturation percentage |
|---|---|---|---|
| A | 4610 | 71 | 1.540130% |
| B | 4610 | 41 | 0.889371% |
| C | 4610 | 11 | 0.238612% |
| D | 4610 | 345 | 7.483731% |
Noise dominated data is calculated using 1-second bins in cleaned event files. If a bin has >2000 counts, and if more than 50% of those come from <1% of pixels, then it is considered to be noise-dominated and hence unusable.
| Quadrant | # 1 sec bins | Bins with >0 counts | Bins with >2000 counts | High rate bins dominated by noise | Noise dominated (total time) | Noise dominated (detector-on time) | Marked lightcurve |
|---|---|---|---|---|---|---|---|
| A | 5775 | 4611 | 3 | 3 | 0.05% | 0.07% | 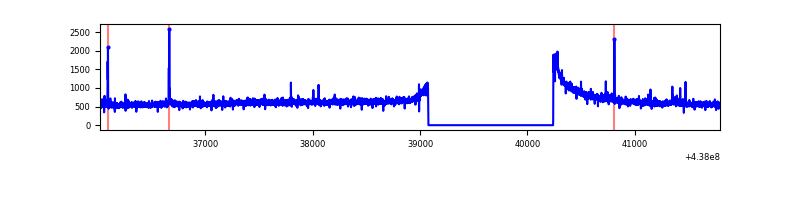 |
| B | 5775 | 4611 | 3 | 3 | 0.05% | 0.07% | 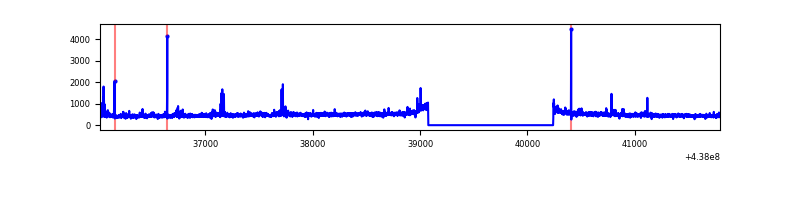 |
| C | 5775 | 4611 | 5 | 5 | 0.09% | 0.11% | 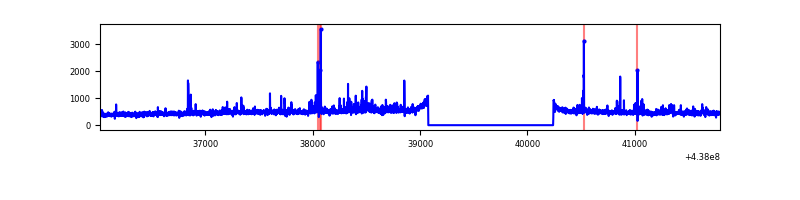 |
| D | 5775 | 4611 | 258 | 258 | 4.47% | 5.60% | 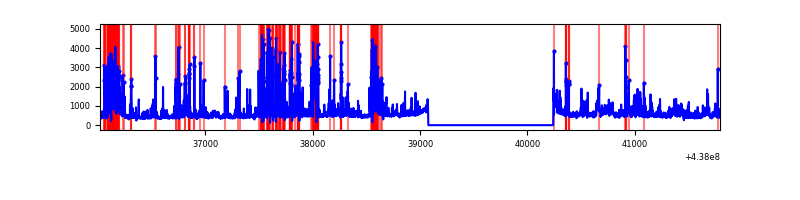 |
Top three noisy pixels from each quadrant. If the there are fewer than three noisy pixels in the level2.evt file, extra rows are filled as -1
| Pixel properties | Quadrant properties | ||||||
|---|---|---|---|---|---|---|---|
| Quadrant | DetID | PixID | Counts | Sigma | Mean | Median | Sigma |
| A | 10 | 83 | 806387 | 7121.81 | 543 | 532 | 113.2 |
| A | 14 | 238 | 26816 | 232.29 | 543 | 532 | 113.2 |
| A | 15 | 222 | 18585 | 159.54 | 543 | 532 | 113.2 |
| B | 0 | 213 | 60507 | 554.93 | 547 | 529 | 108.1 |
| B | 2 | 2 | 31942 | 290.64 | 547 | 529 | 108.1 |
| B | 3 | 112 | 20868 | 188.18 | 547 | 529 | 108.1 |
| C | 3 | 233 | 162851 | 1286.46 | 535 | 539 | 126.2 |
| C | 14 | 254 | 68596 | 539.41 | 535 | 539 | 126.2 |
| C | 1 | 241 | 10523 | 79.13 | 535 | 539 | 126.2 |
| D | 1 | 52 | 760148 | 5824.97 | 511 | 495 | 130.4 |
| D | 2 | 249 | 305455 | 2338.41 | 511 | 495 | 130.4 |
| D | 8 | 48 | 264218 | 2022.21 | 511 | 495 | 130.4 |
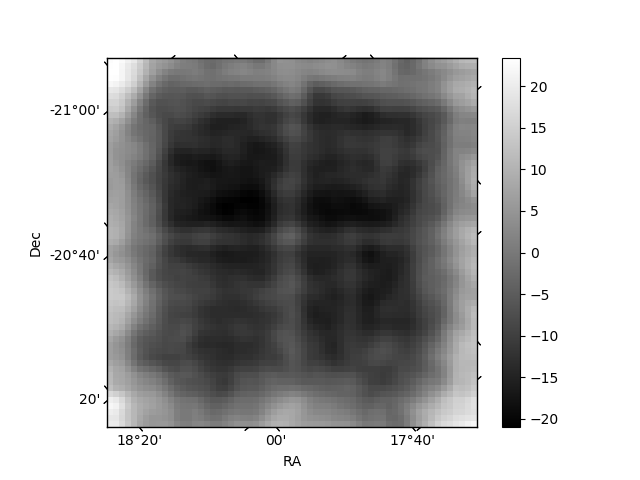
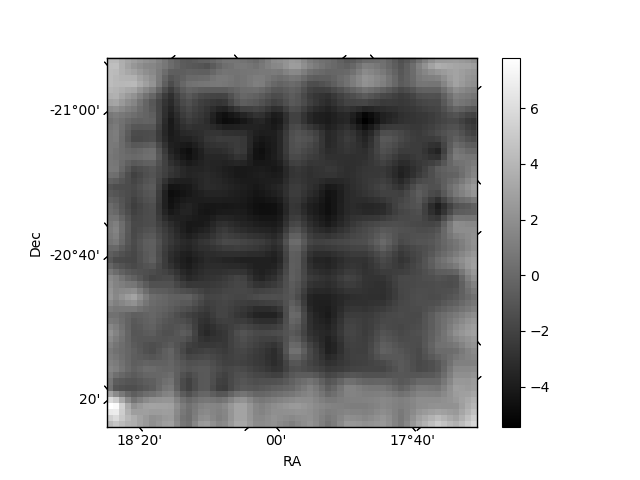
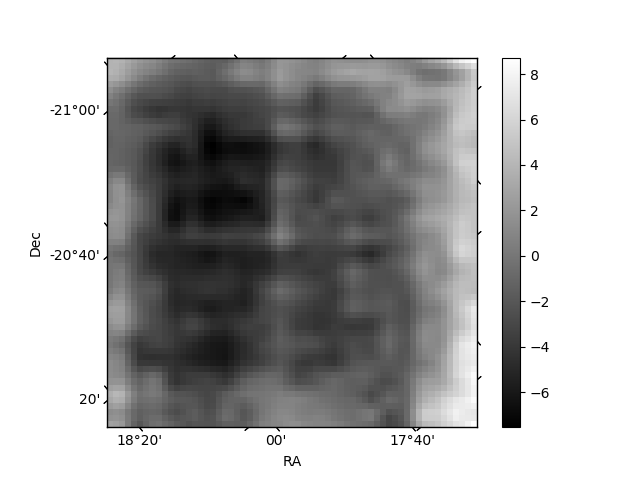
Histogram calculated using DETX and DETY for each event in the final _common_clean file
| Quadrant A | 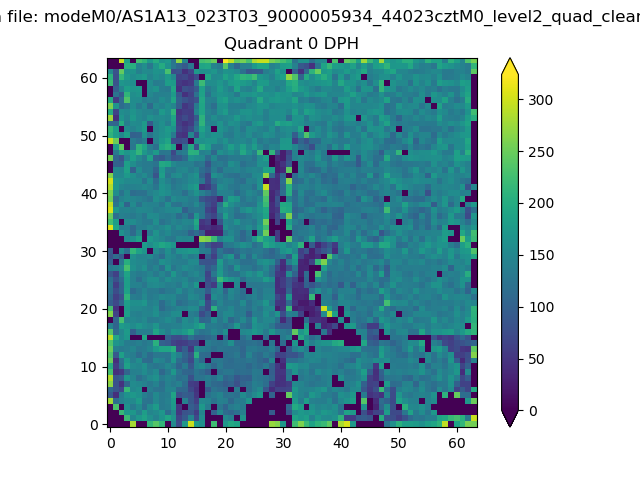 |
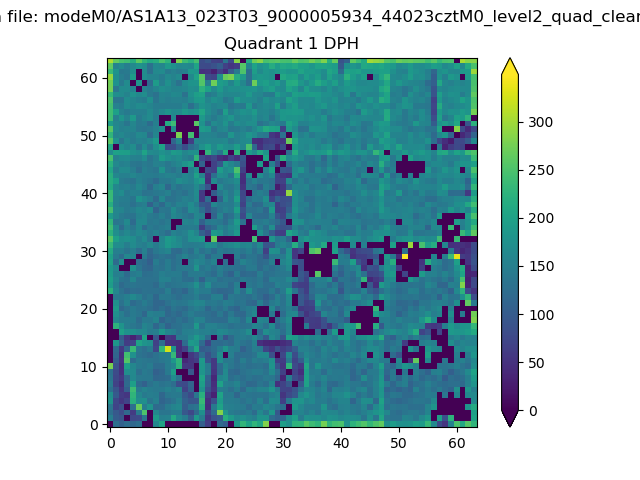 |
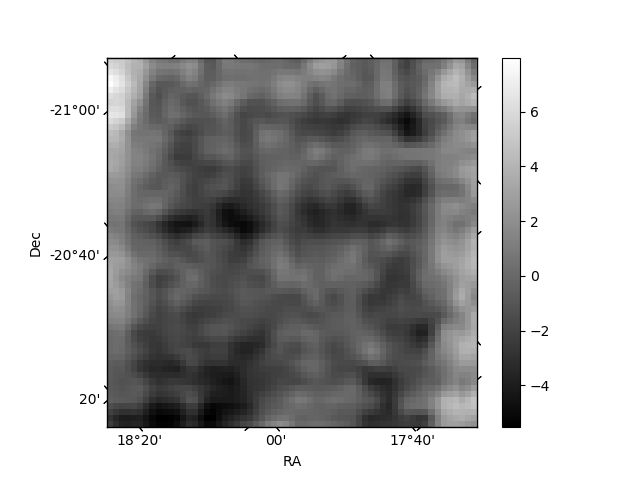
Quadrant B |
|---|---|---|---|
| Quadrant D | 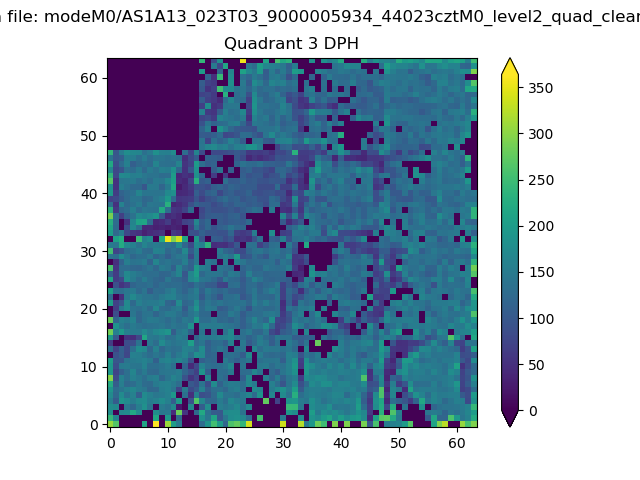 |
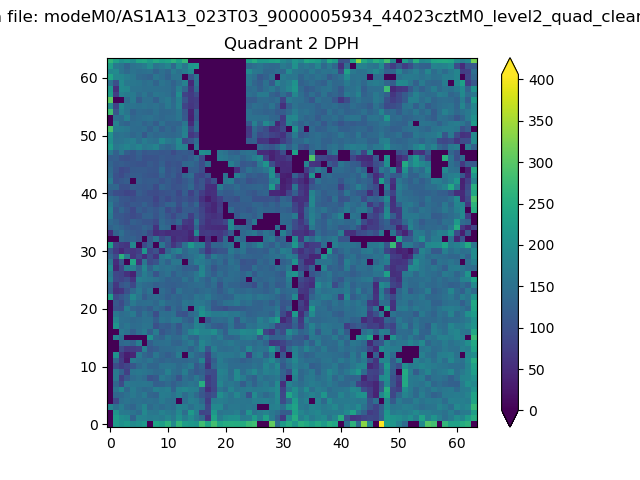 |
Quadrant C |
| Plot type | Count rate plots | Images |
|---|---|---|
| Comparison with Poisson distribution Blue bars denote a histogram of data divided into 1 sec bins. Red curve is a Poisson curve with rate = median count rate of data. |
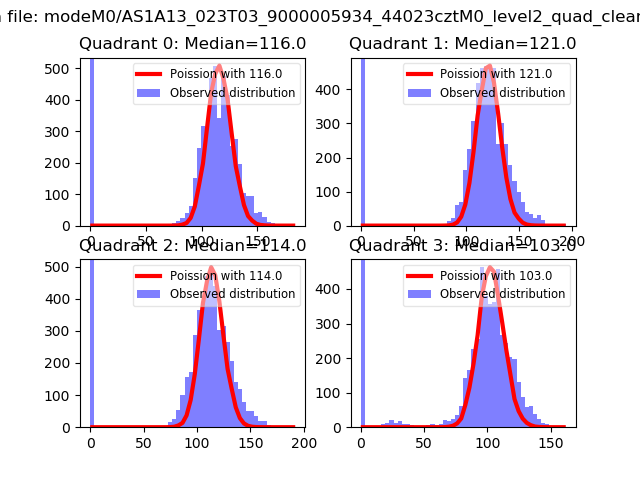 |
 |
| Quadrant-wise count rates Data is divided into 100 sec bins |
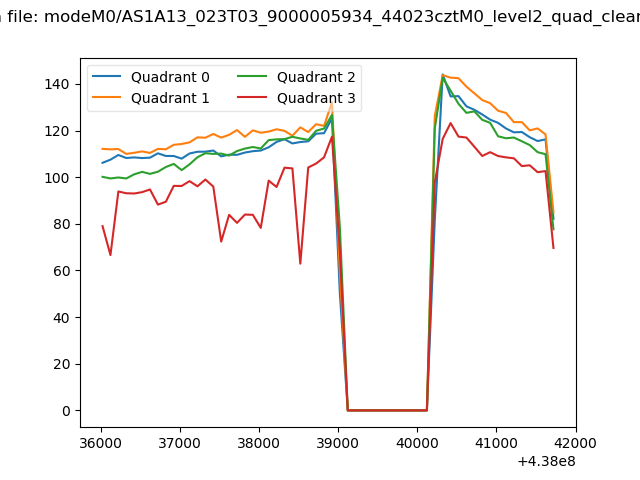 |
|
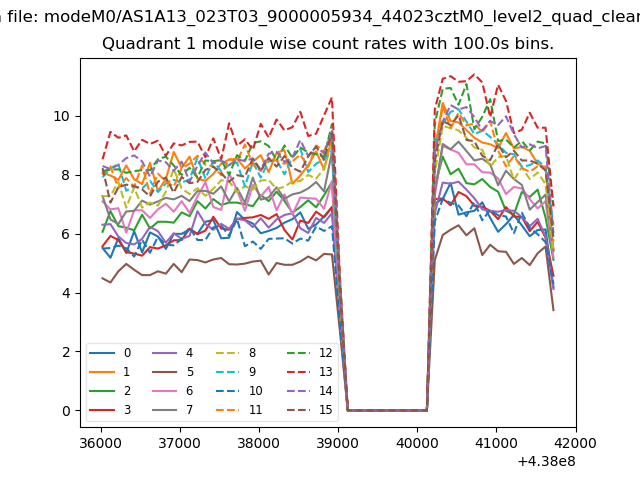
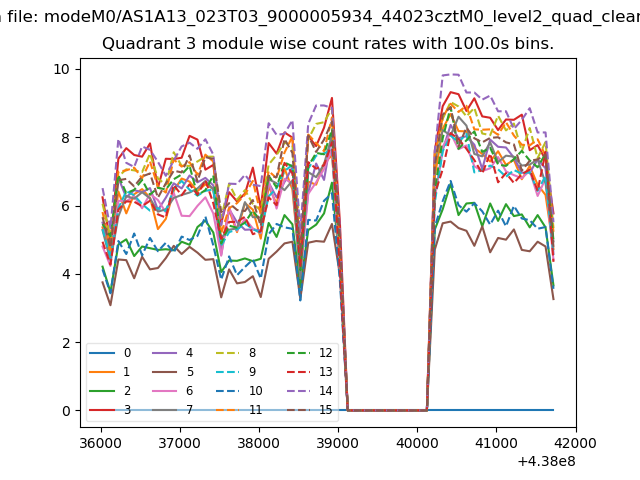
| Module-wise count rates for Quadrant A Data is divided into 100 sec bins |
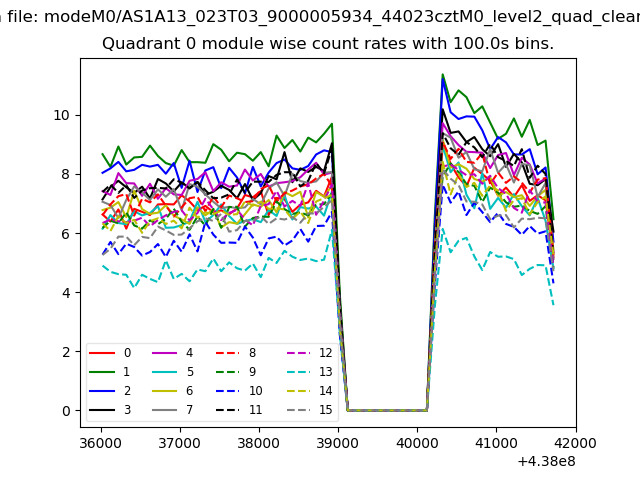 |
 |
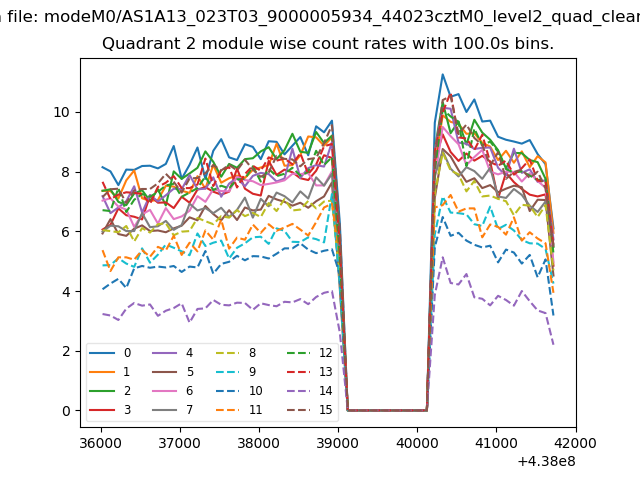
| Module-wise count rates for Quadrant B Data is divided into 100 sec bins |
 |
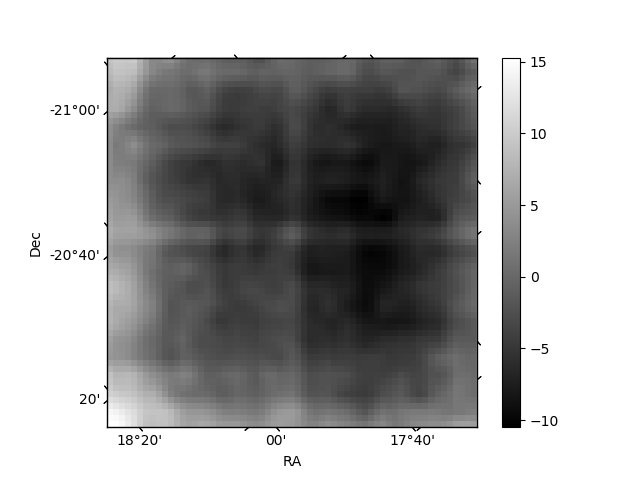 |
| Module-wise count rates for Quadrant C Data is divided into 100 sec bins |
 |
 |
| Module-wise count rates for Quadrant D Data is divided into 100 sec bins |
 |
 |
| Parameter | Plot |
|---|---|
| CZT HV Monitor | 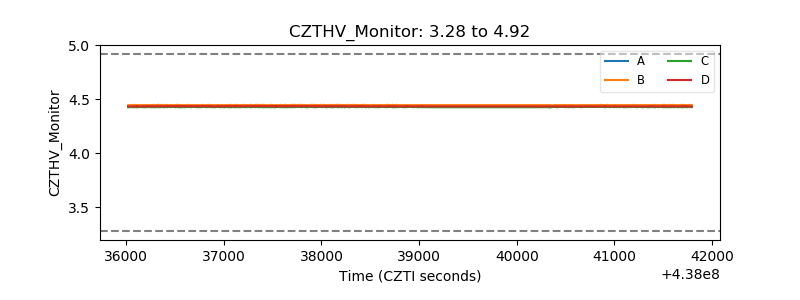 |
| D_VDD | 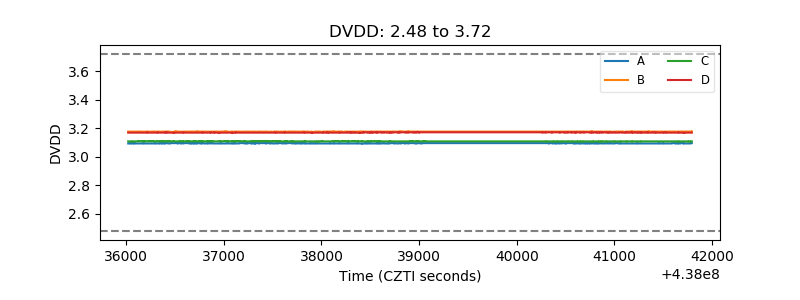 |
| Temperature 1 | 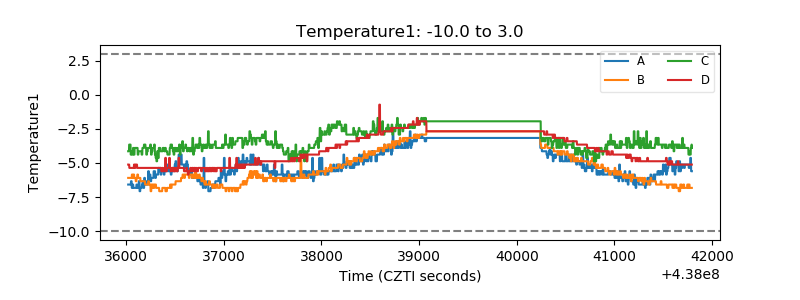 |
| Veto HV Monitor | 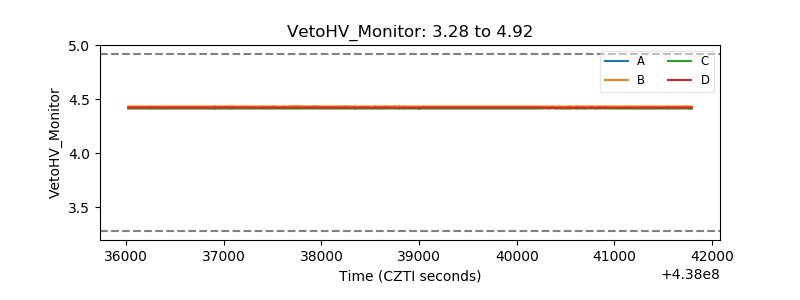 |
| Veto LLD | 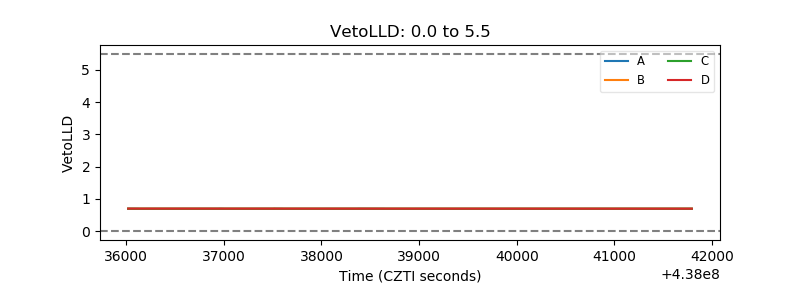 |
| Alpha Counter | 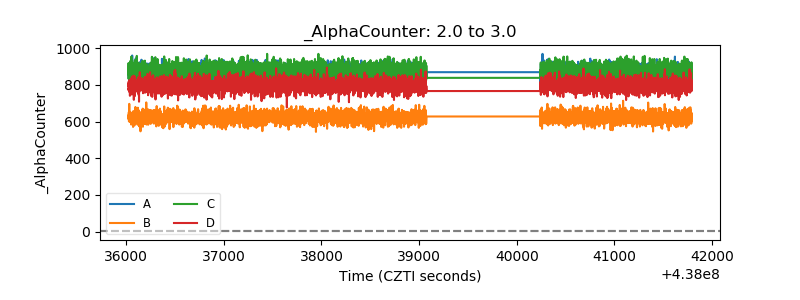 |
| _CPM_Rate | 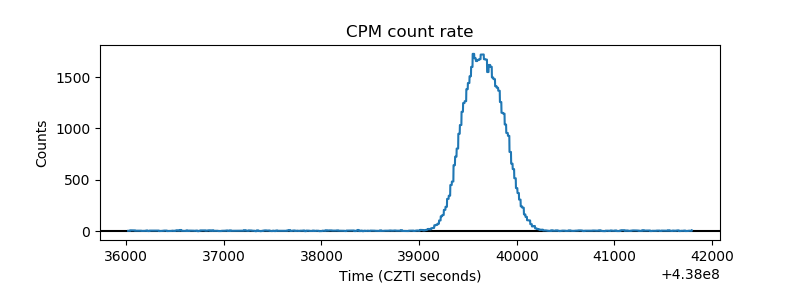 |
| CZT Counter |  |
| +2.5 Volts monitor | 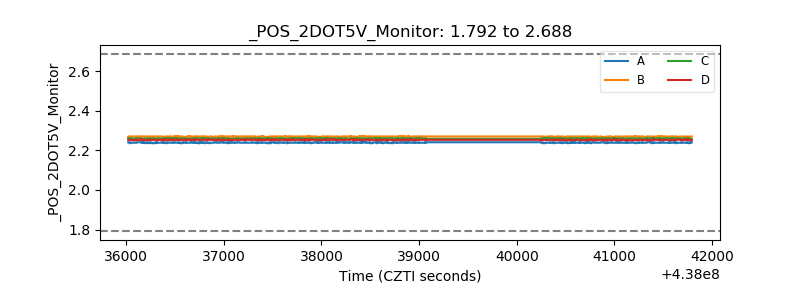 |
| +5 Volts monitor | 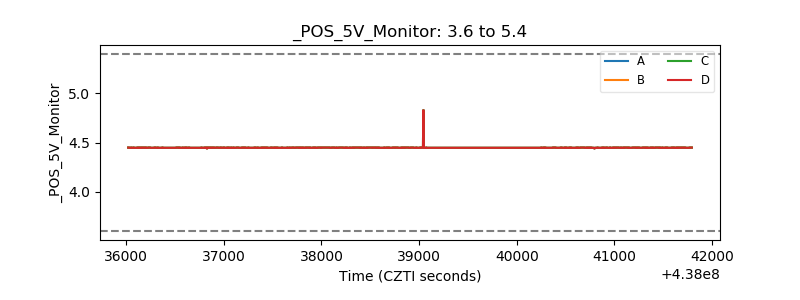 |
| _ROLL_ROT | 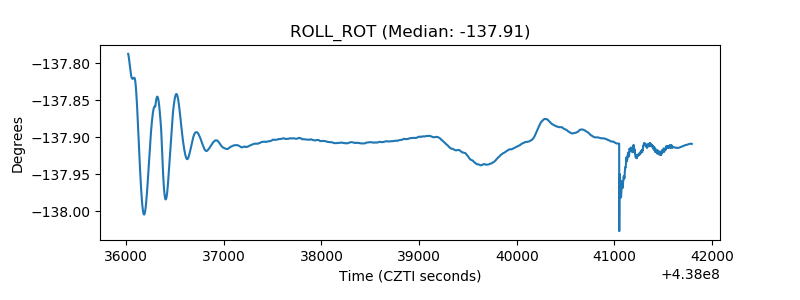 |
| _Roll_DEC | 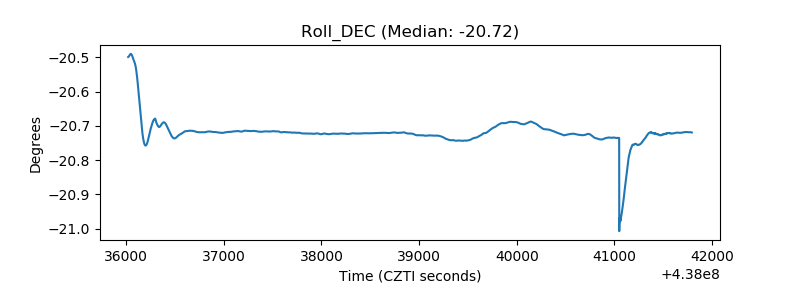 |
| _Roll_RA | 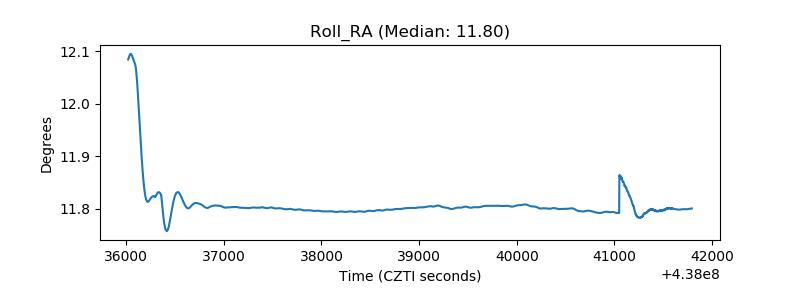 |
| Veto Counter | 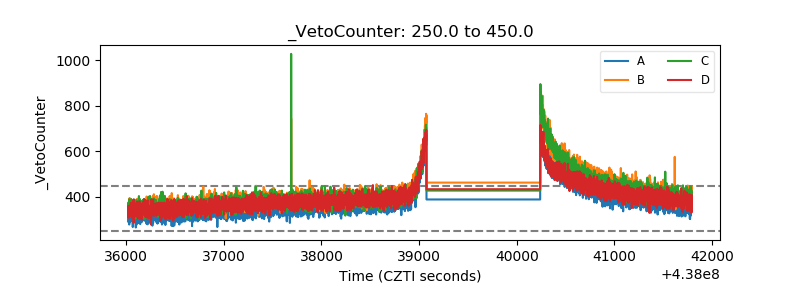 |