| Param | Original file | Final file |
|---|---|---|
| Filename | modeM0/AS1A13_023T03_9000005934_44025cztM0_level2.fits | modeM0/AS1A13_023T03_9000005934_44025cztM0_level2_quad_clean.evt |
| Size (bytes) | 832,824,000 | 200,427,840 |
| Size | 794.2 MB | 191.1 MB |
| Events in quadrant A | 7,938,974 | 1,362,967 |
| Events in quadrant B | 5,782,950 | 1,430,762 |
| Events in quadrant C | 5,777,664 | 1,351,444 |
| Events in quadrant D | 10,430,095 | 1,121,273 |
| Mode SS | |||
|---|---|---|---|
| Quadrant | BADHDUFLAG | Total packets | Discarded packets |
| A | 0 | 234 | 0 |
| B | 0 | 234 | 0 |
| C | 0 | 234 | 0 |
| D | 0 | 234 | 0 |
| Mode M9 | |||
|---|---|---|---|
| Quadrant | BADHDUFLAG | Total packets | Discarded packets |
| A | 0 | 25 | 0 |
| B | 0 | 25 | 0 |
| C | 0 | 25 | 0 |
| D | 0 | 25 | 0 |
| Mode M0 | |||
|---|---|---|---|
| Quadrant | BADHDUFLAG | Total packets | Discarded packets |
| A | 0 | 31724 | 2 |
| B | 0 | 24576 | 2 |
| C | 0 | 24532 | 2 |
| D | 0 | 38759 | 4 |
| Quadrant | Total seconds | Saturated seconds | Saturation percentage |
|---|---|---|---|
| A | 11612 | 165 | 1.420944% |
| B | 11612 | 89 | 0.766449% |
| C | 11613 | 32 | 0.275553% |
| D | 11612 | 1117 | 9.619359% |
Noise dominated data is calculated using 1-second bins in cleaned event files. If a bin has >2000 counts, and if more than 50% of those come from <1% of pixels, then it is considered to be noise-dominated and hence unusable.
| Quadrant | # 1 sec bins | Bins with >0 counts | Bins with >2000 counts | High rate bins dominated by noise | Noise dominated (total time) | Noise dominated (detector-on time) | Marked lightcurve |
|---|---|---|---|---|---|---|---|
| A | 14052 | 11614 | 24 | 24 | 0.17% | 0.21% | 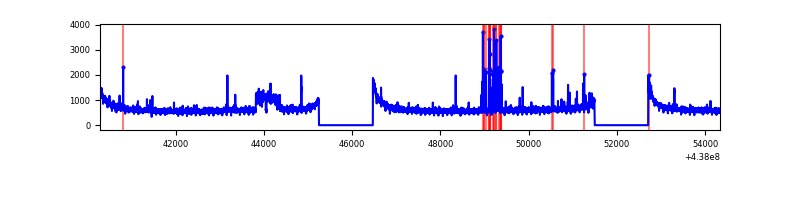 |
| B | 14052 | 11614 | 15 | 15 | 0.11% | 0.13% | 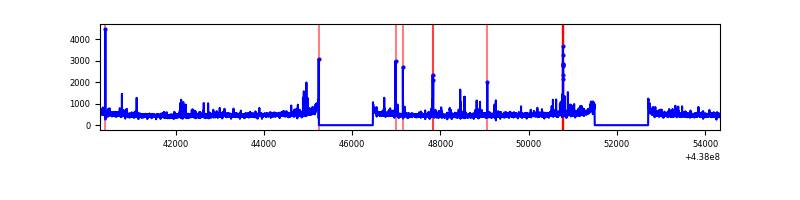 |
| C | 14053 | 11615 | 6 | 6 | 0.04% | 0.05% | 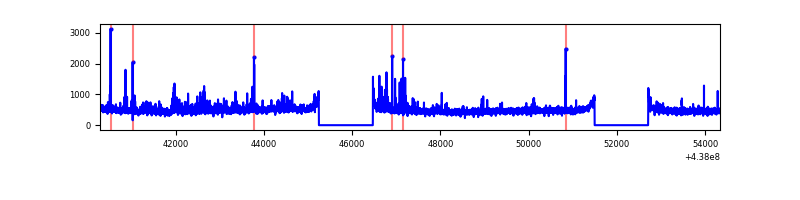 |
| D | 14052 | 11614 | 1059 | 1059 | 7.54% | 9.12% | 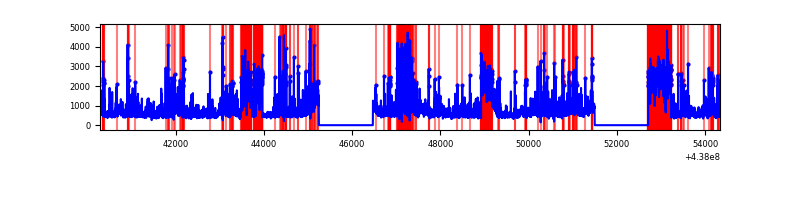 |
Top three noisy pixels from each quadrant. If the there are fewer than three noisy pixels in the level2.evt file, extra rows are filled as -1
| Pixel properties | Quadrant properties | ||||||
|---|---|---|---|---|---|---|---|
| Quadrant | DetID | PixID | Counts | Sigma | Mean | Median | Sigma |
| A | 10 | 83 | 2070962 | 7392.83 | 1368 | 1343 | 279.9 |
| A | 15 | 222 | 470981 | 1677.58 | 1368 | 1343 | 279.9 |
| A | 15 | 223 | 36246 | 124.68 | 1368 | 1343 | 279.9 |
| B | 0 | 213 | 102789 | 379.96 | 1380 | 1340 | 267.0 |
| B | 2 | 2 | 67419 | 247.49 | 1380 | 1340 | 267.0 |
| B | 3 | 112 | 48194 | 175.48 | 1380 | 1340 | 267.0 |
| C | 3 | 233 | 311158 | 969.7 | 1360 | 1370 | 319.5 |
| C | 14 | 254 | 124976 | 386.91 | 1360 | 1370 | 319.5 |
| C | 1 | 241 | 38855 | 117.34 | 1360 | 1370 | 319.5 |
| D | 8 | 48 | 3373149 | 10410.86 | 1296 | 1260 | 323.9 |
| D | 1 | 52 | 795641 | 2452.69 | 1296 | 1260 | 323.9 |
| D | 2 | 120 | 305946 | 940.73 | 1296 | 1260 | 323.9 |
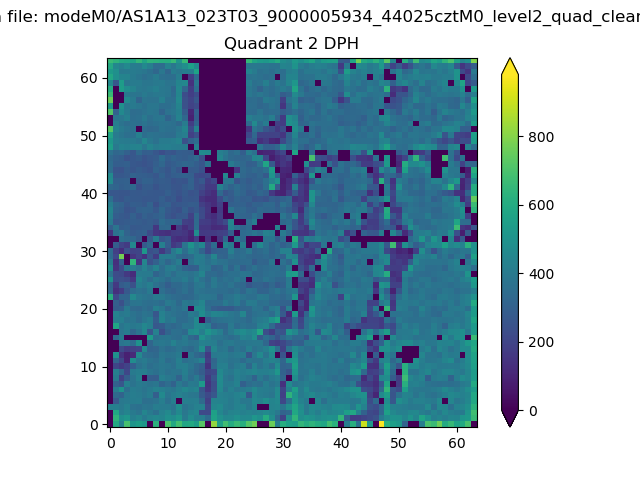
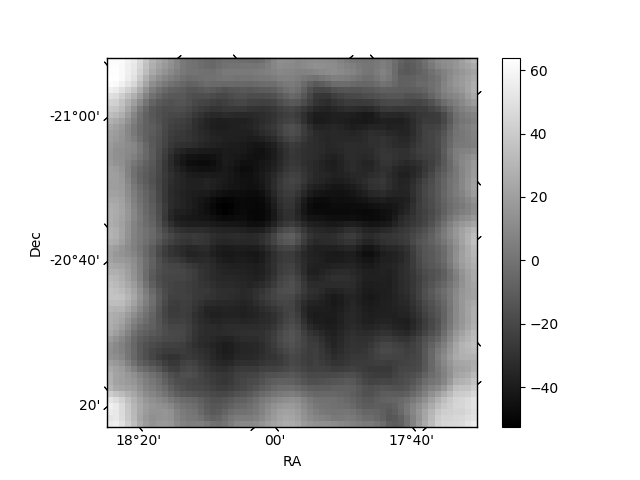
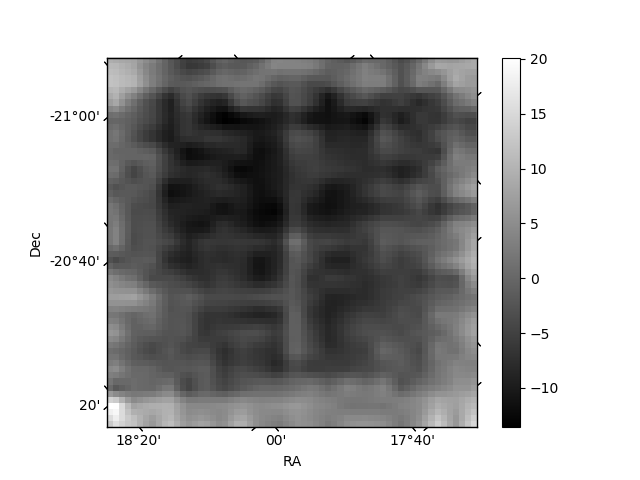
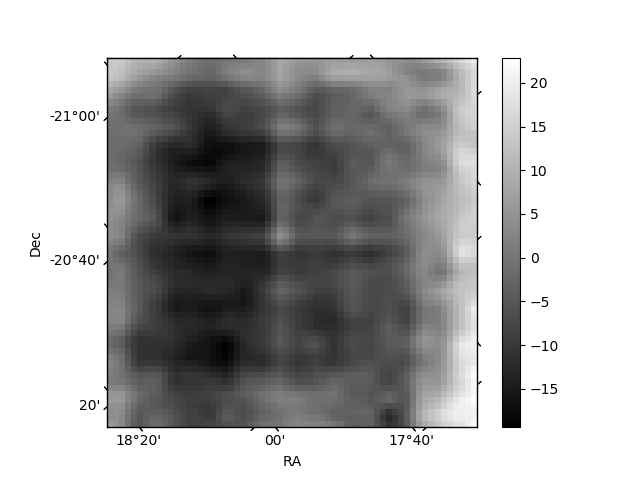
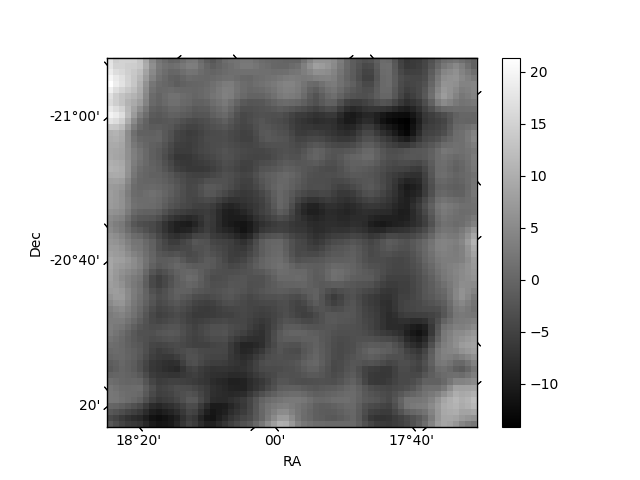
Histogram calculated using DETX and DETY for each event in the final _common_clean file
| Quadrant A | 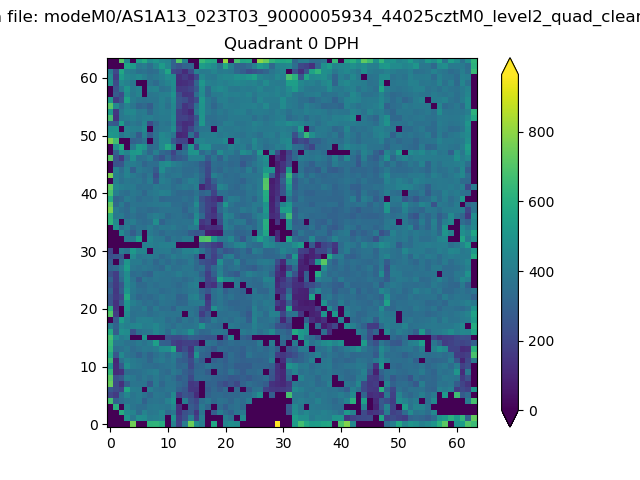 |
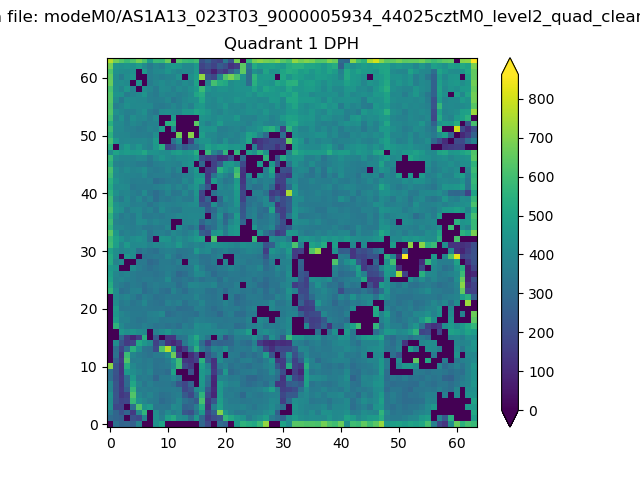 |
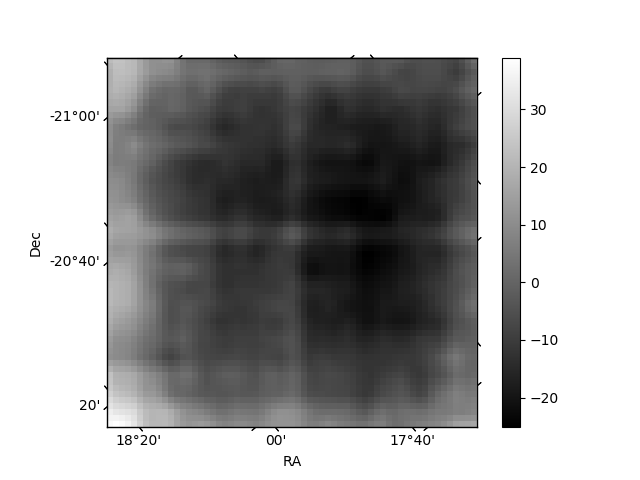
Quadrant B |
|---|---|---|---|
| Quadrant D | 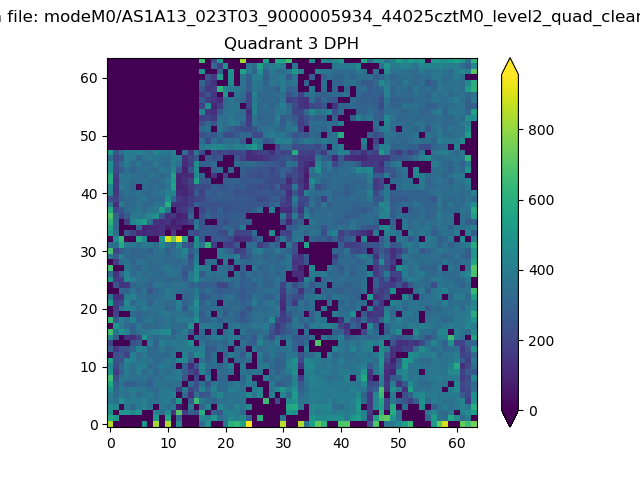 |
 |
Quadrant C |
| Plot type | Count rate plots | Images |
|---|---|---|
| Comparison with Poisson distribution Blue bars denote a histogram of data divided into 1 sec bins. Red curve is a Poisson curve with rate = median count rate of data. |
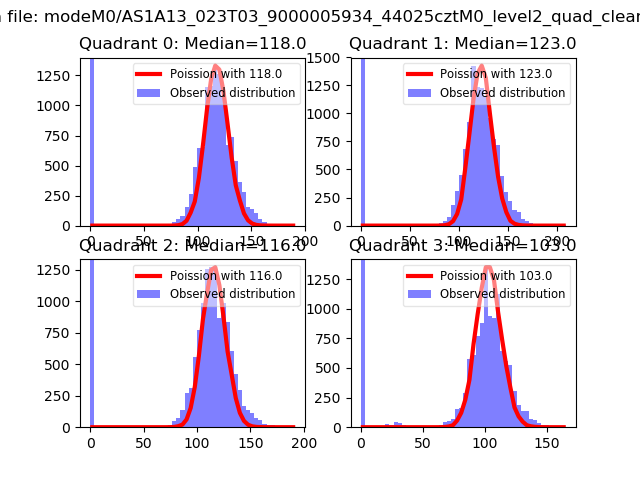 |
 |
| Quadrant-wise count rates Data is divided into 100 sec bins |
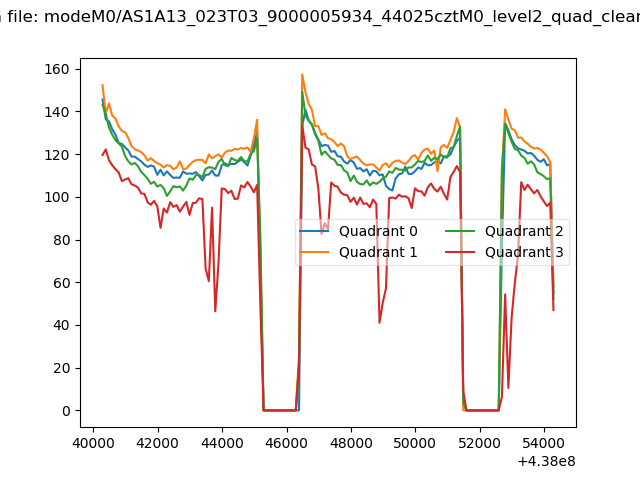 |
|
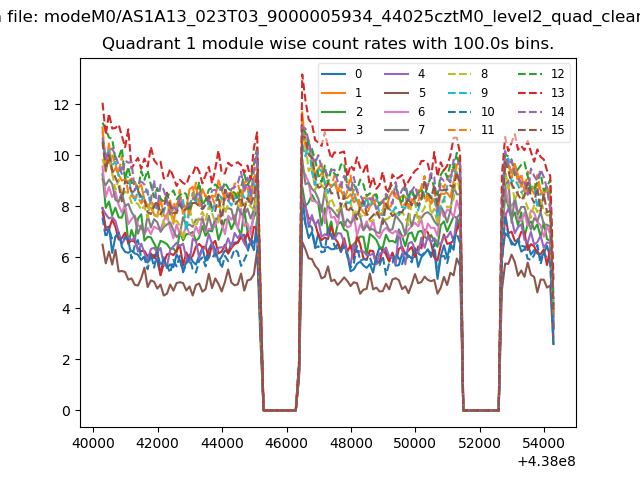
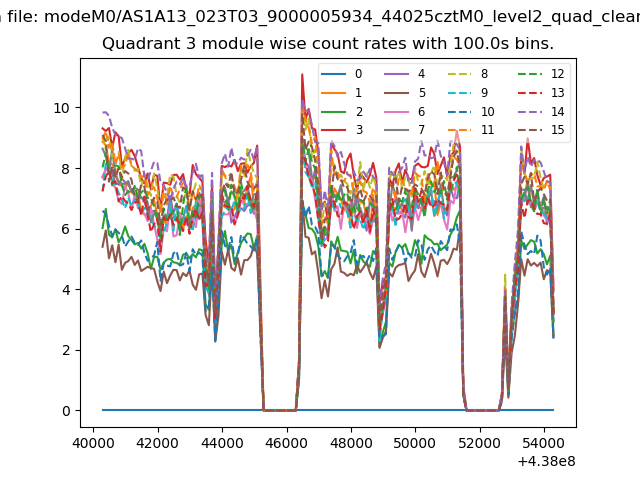
| Module-wise count rates for Quadrant A Data is divided into 100 sec bins |
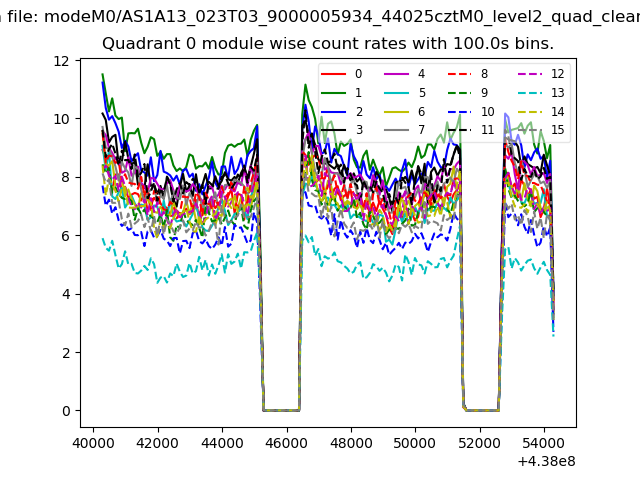 |
 |
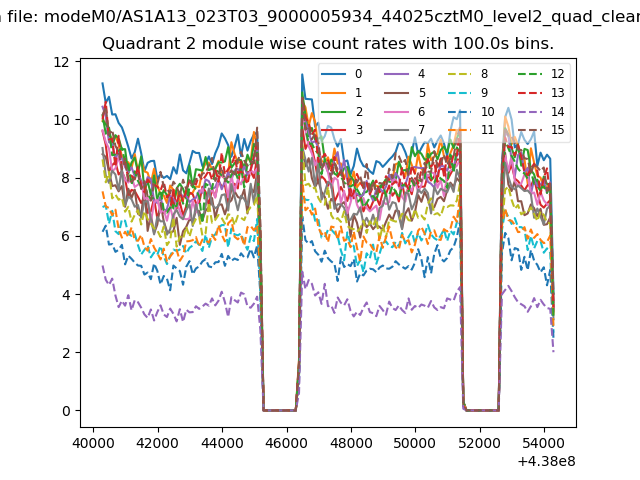
| Module-wise count rates for Quadrant B Data is divided into 100 sec bins |
 |
 |
| Module-wise count rates for Quadrant C Data is divided into 100 sec bins |
 |
 |
| Module-wise count rates for Quadrant D Data is divided into 100 sec bins |
 |
 |
| Parameter | Plot |
|---|---|
| CZT HV Monitor | 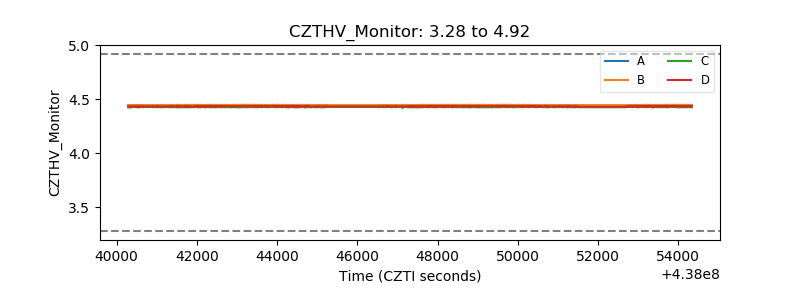 |
| D_VDD | 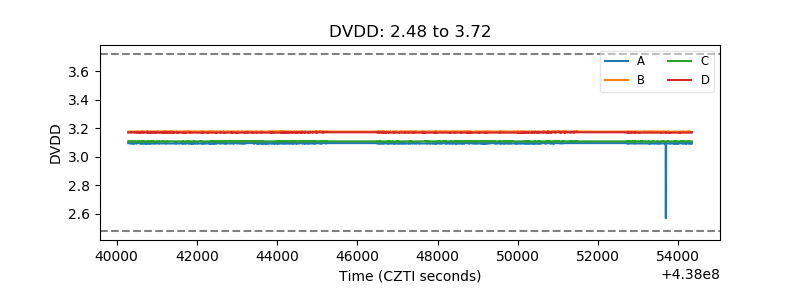 |
| Temperature 1 | 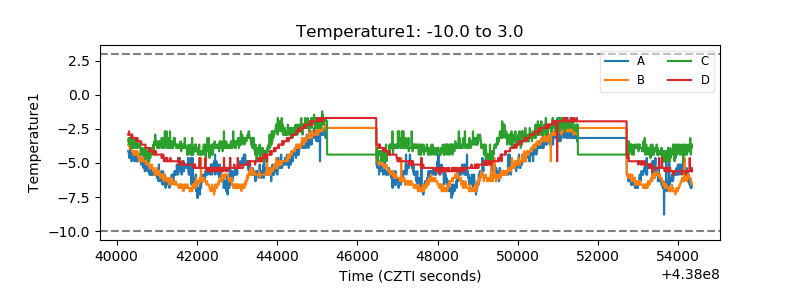 |
| Veto HV Monitor | 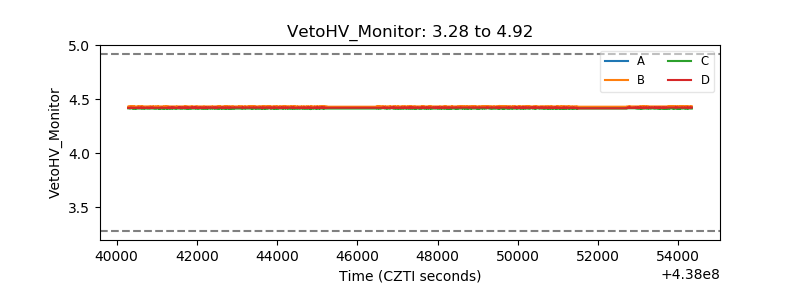 |
| Veto LLD | 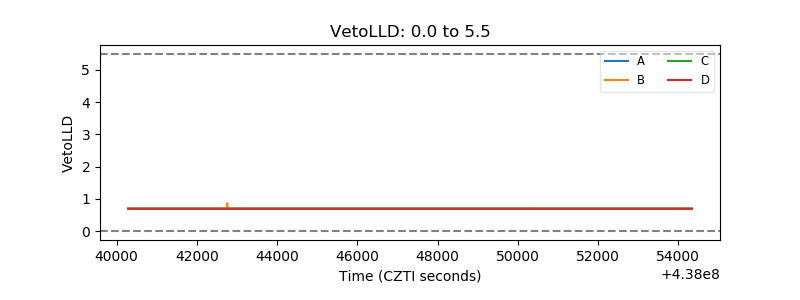 |
| Alpha Counter |  |
| _CPM_Rate | 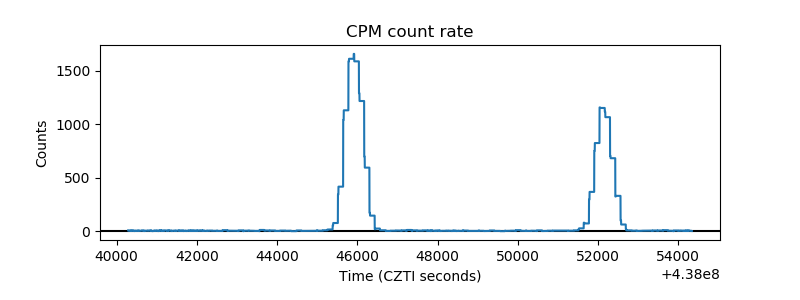 |
| CZT Counter | 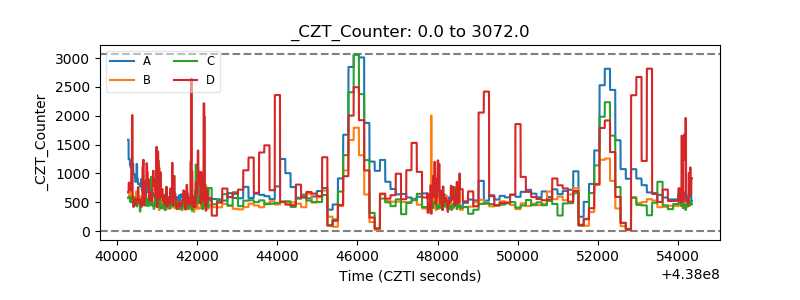 |
| +2.5 Volts monitor | 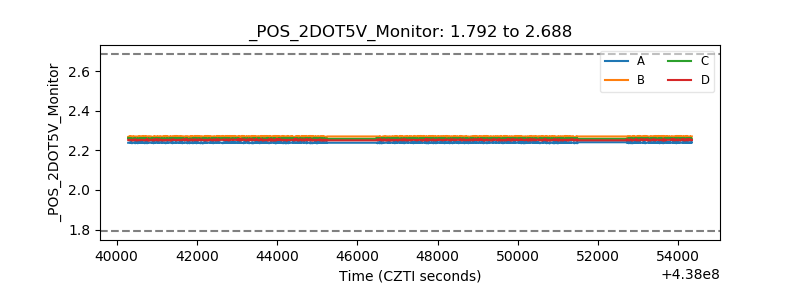 |
| +5 Volts monitor | 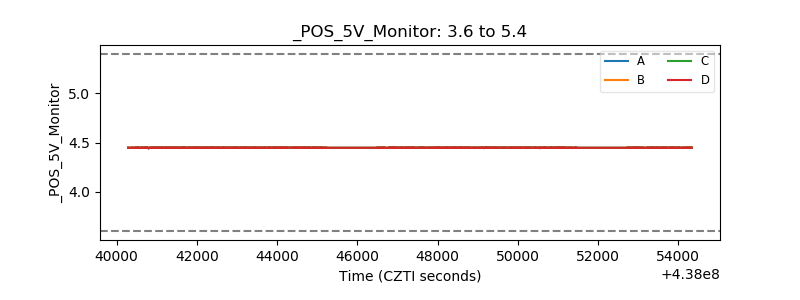 |
| _ROLL_ROT | 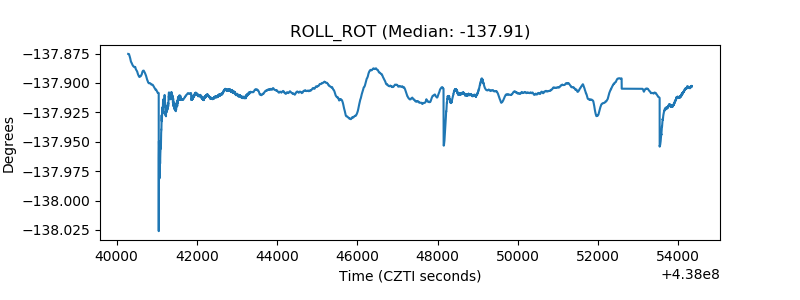 |
| _Roll_DEC | 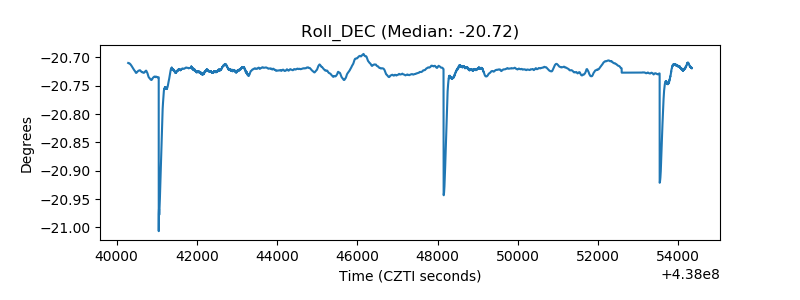 |
| _Roll_RA | 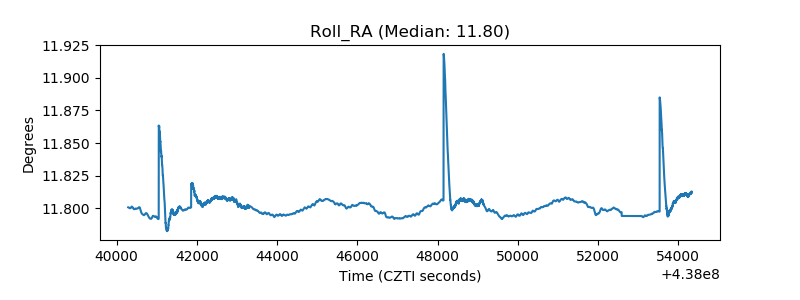 |
| Veto Counter | 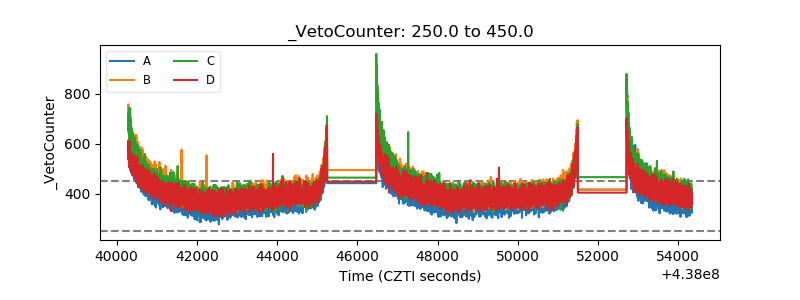 |