| Param | Original file | Final file |
|---|---|---|
| Filename | modeM0/AS1A13_023T03_9000005934_44026cztM0_level2.fits | modeM0/AS1A13_023T03_9000005934_44026cztM0_level2_quad_clean.evt |
| Size (bytes) | 446,711,040 | 105,675,840 |
| Size | 426.0 MB | 100.8 MB |
| Events in quadrant A | 3,956,955 | 713,429 |
| Events in quadrant B | 3,217,214 | 744,941 |
| Events in quadrant C | 3,298,360 | 707,602 |
| Events in quadrant D | 5,577,086 | 597,125 |
| Mode SS | |||
|---|---|---|---|
| Quadrant | BADHDUFLAG | Total packets | Discarded packets |
| A | 0 | 128 | 0 |
| B | 0 | 128 | 0 |
| C | 0 | 128 | 0 |
| D | 0 | 128 | 0 |
| Mode M9 | |||
|---|---|---|---|
| Quadrant | BADHDUFLAG | Total packets | Discarded packets |
| A | 0 | 11 | 0 |
| B | 0 | 11 | 0 |
| C | 0 | 11 | 0 |
| D | 0 | 11 | 0 |
| Mode M0 | |||
|---|---|---|---|
| Quadrant | BADHDUFLAG | Total packets | Discarded packets |
| A | 0 | 16155 | 1 |
| B | 0 | 13498 | 1 |
| C | 0 | 13639 | 1 |
| D | 0 | 20848 | 1 |
| Quadrant | Total seconds | Saturated seconds | Saturation percentage |
|---|---|---|---|
| A | 6258 | 68 | 1.086609% |
| B | 6257 | 79 | 1.262586% |
| C | 6258 | 37 | 0.591243% |
| D | 6258 | 575 | 9.188239% |
Noise dominated data is calculated using 1-second bins in cleaned event files. If a bin has >2000 counts, and if more than 50% of those come from <1% of pixels, then it is considered to be noise-dominated and hence unusable.
| Quadrant | # 1 sec bins | Bins with >0 counts | Bins with >2000 counts | High rate bins dominated by noise | Noise dominated (total time) | Noise dominated (detector-on time) | Marked lightcurve |
|---|---|---|---|---|---|---|---|
| A | 7378 | 6259 | 0 | 0 | 0.00% | 0.00% | 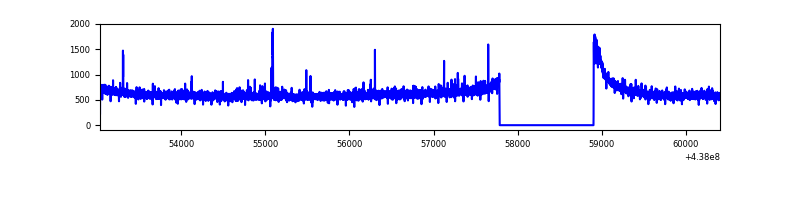 |
| B | 7377 | 6258 | 17 | 17 | 0.23% | 0.27% | 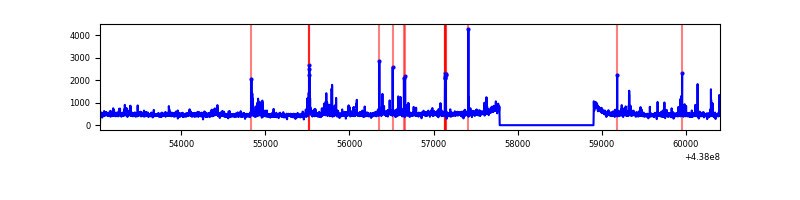 |
| C | 7378 | 6259 | 6 | 6 | 0.08% | 0.10% | 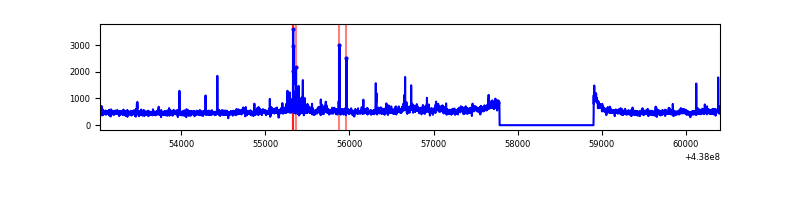 |
| D | 7378 | 6258 | 477 | 477 | 6.47% | 7.62% | 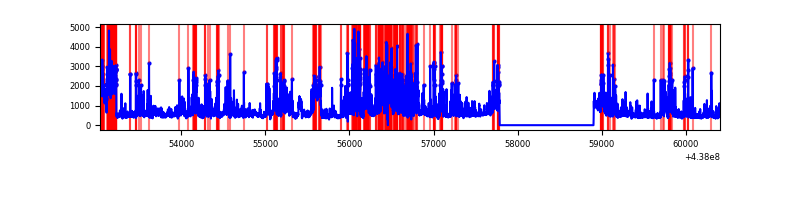 |
Top three noisy pixels from each quadrant. If the there are fewer than three noisy pixels in the level2.evt file, extra rows are filled as -1
| Pixel properties | Quadrant properties | ||||||
|---|---|---|---|---|---|---|---|
| Quadrant | DetID | PixID | Counts | Sigma | Mean | Median | Sigma |
| A | 10 | 83 | 1069948 | 7099.88 | 728 | 714 | 150.6 |
| A | 14 | 238 | 49226 | 322.13 | 728 | 714 | 150.6 |
| A | 15 | 223 | 17493 | 111.42 | 728 | 714 | 150.6 |
| B | 0 | 213 | 148397 | 1026.38 | 733 | 711 | 143.9 |
| B | 4 | 171 | 46420 | 317.67 | 733 | 711 | 143.9 |
| B | 5 | 172 | 33939 | 230.93 | 733 | 711 | 143.9 |
| C | 3 | 233 | 370567 | 2162.75 | 725 | 729 | 171.0 |
| C | 14 | 254 | 85331 | 494.74 | 725 | 729 | 171.0 |
| C | 1 | 241 | 11180 | 61.12 | 725 | 729 | 171.0 |
| D | 7 | 80 | 966065 | 5458.47 | 695 | 674 | 176.9 |
| D | 8 | 48 | 744769 | 4207.23 | 695 | 674 | 176.9 |
| D | 5 | 235 | 559786 | 3161.3 | 695 | 674 | 176.9 |
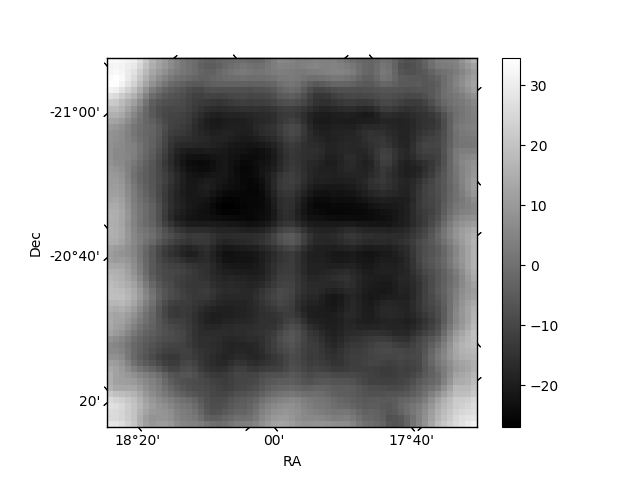
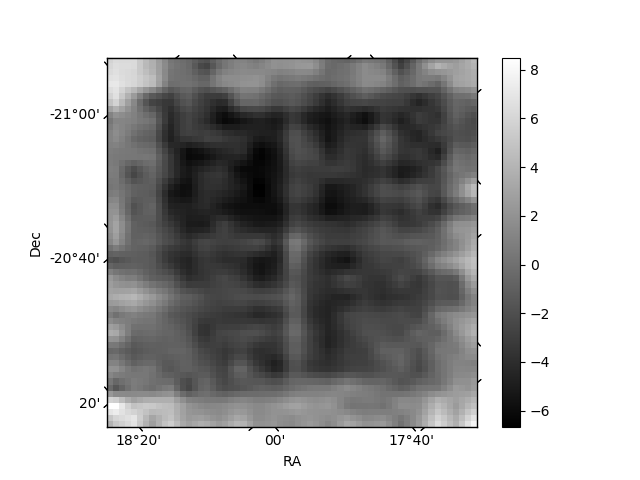
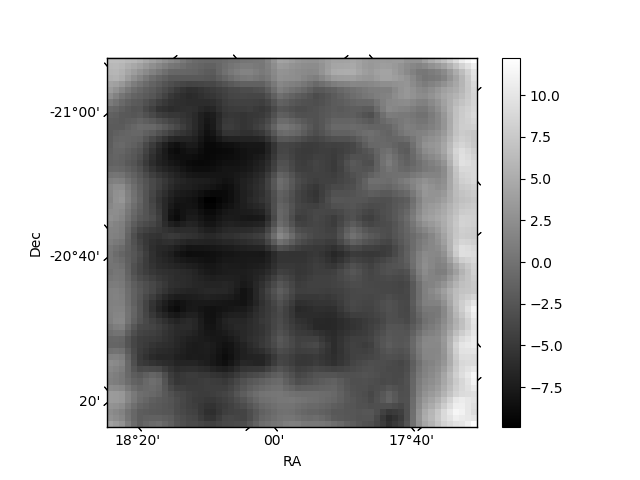
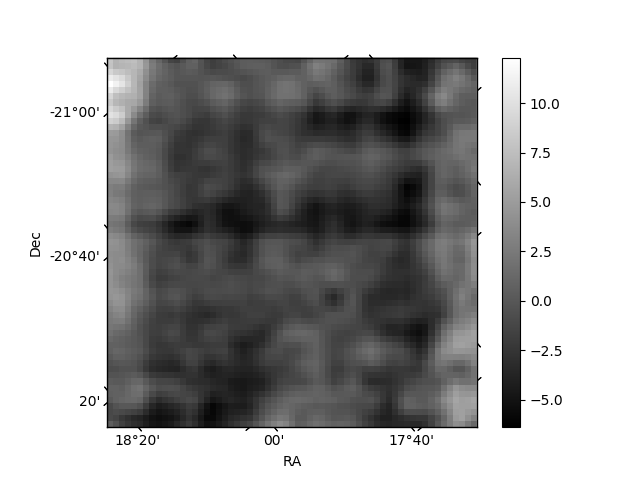
Histogram calculated using DETX and DETY for each event in the final _common_clean file
| Quadrant A | 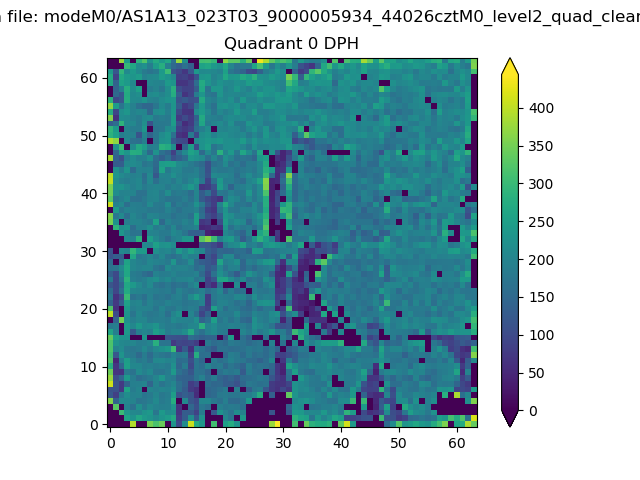 |
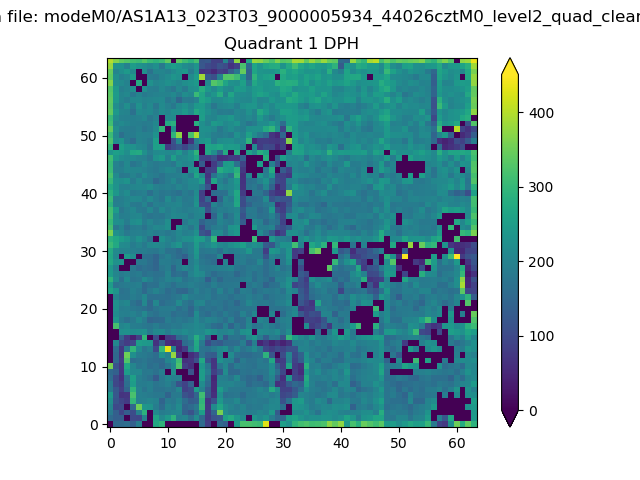 |
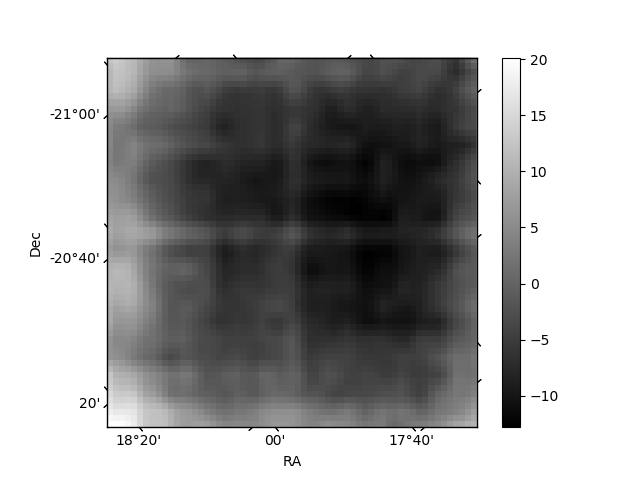
Quadrant B |
|---|---|---|---|
| Quadrant D | 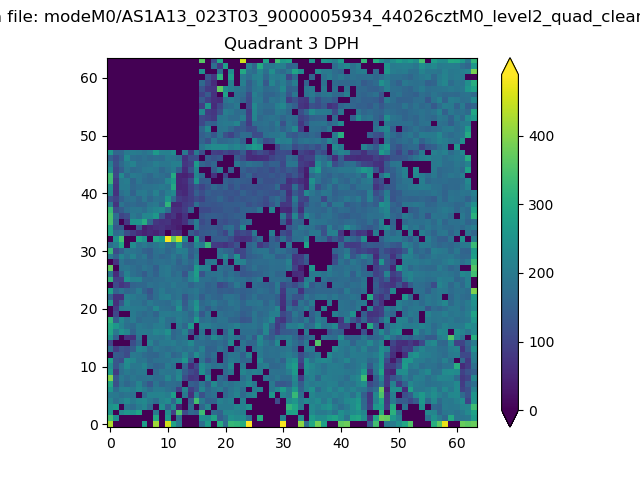 |
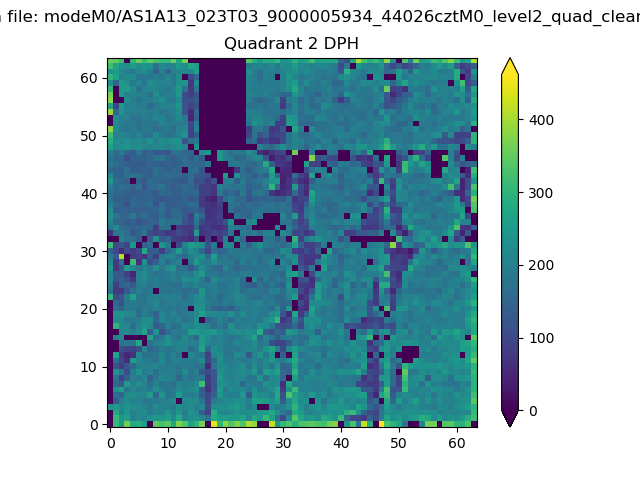 |
Quadrant C |
| Plot type | Count rate plots | Images |
|---|---|---|
| Comparison with Poisson distribution Blue bars denote a histogram of data divided into 1 sec bins. Red curve is a Poisson curve with rate = median count rate of data. |
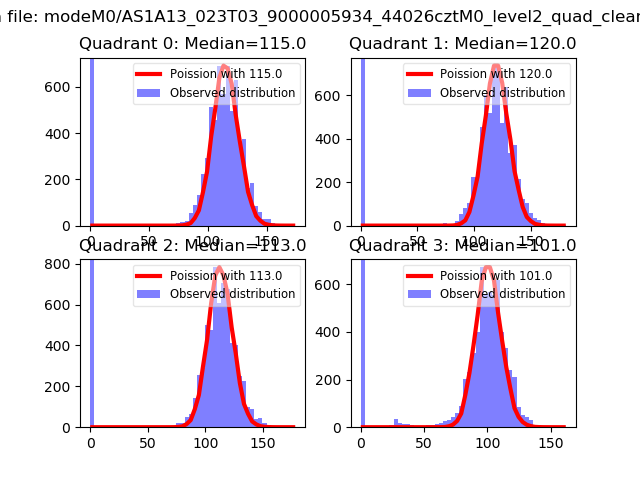 |
 |
| Quadrant-wise count rates Data is divided into 100 sec bins |
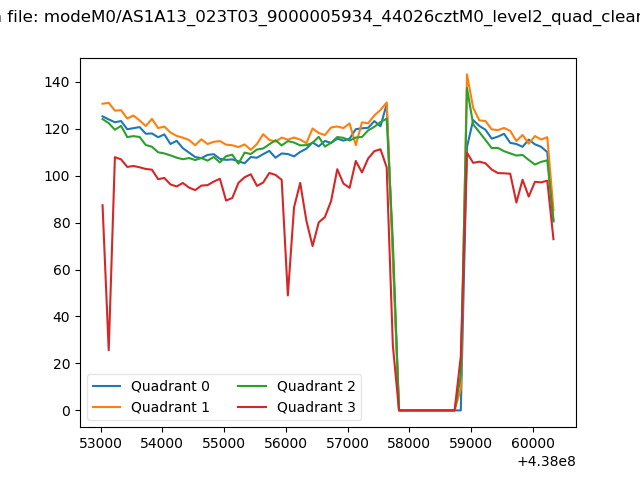 |
|
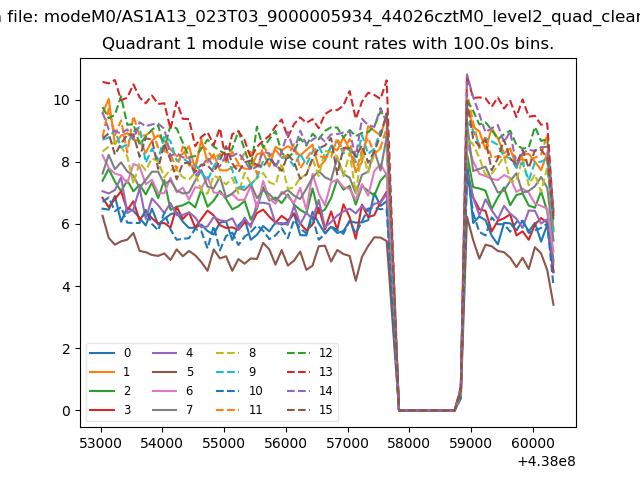
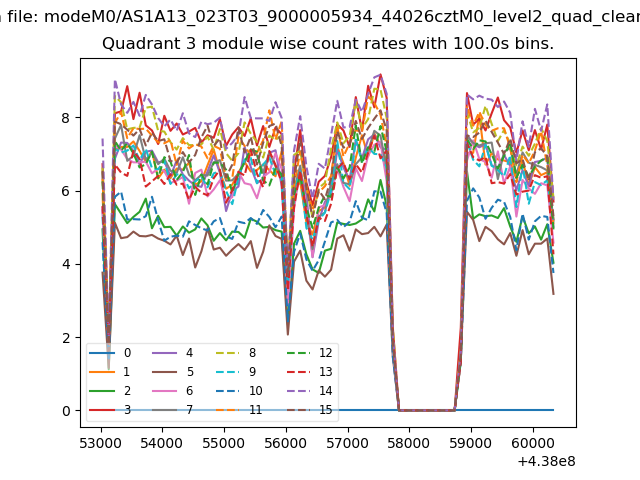
| Module-wise count rates for Quadrant A Data is divided into 100 sec bins |
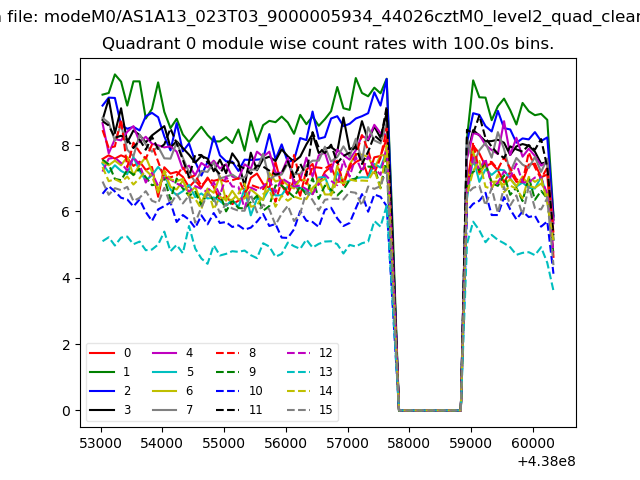 |
 |
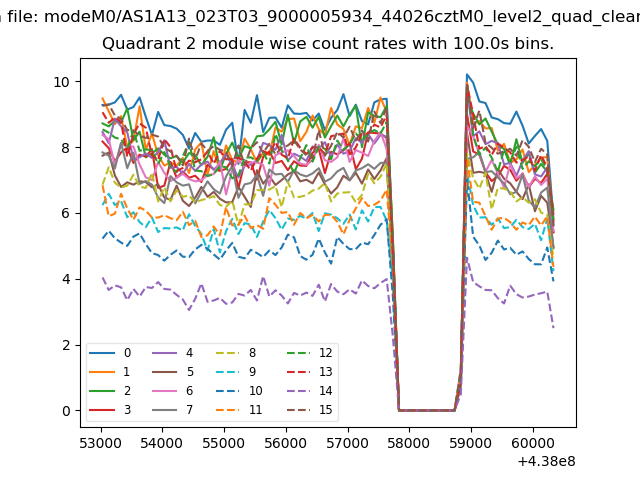
| Module-wise count rates for Quadrant B Data is divided into 100 sec bins |
 |
 |
| Module-wise count rates for Quadrant C Data is divided into 100 sec bins |
 |
 |
| Module-wise count rates for Quadrant D Data is divided into 100 sec bins |
 |
 |
| Parameter | Plot |
|---|---|
| CZT HV Monitor | 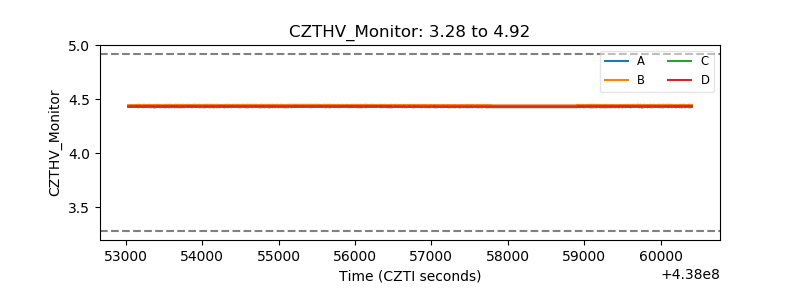 |
| D_VDD | 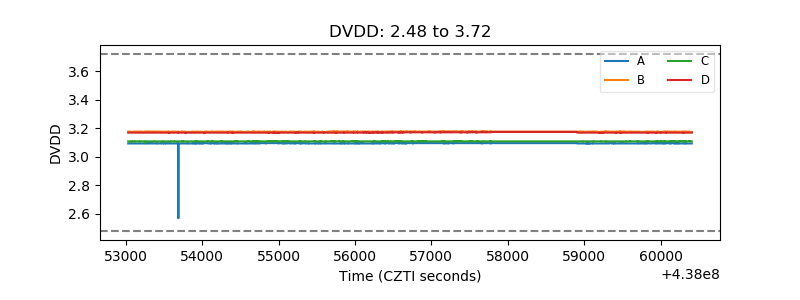 |
| Temperature 1 | 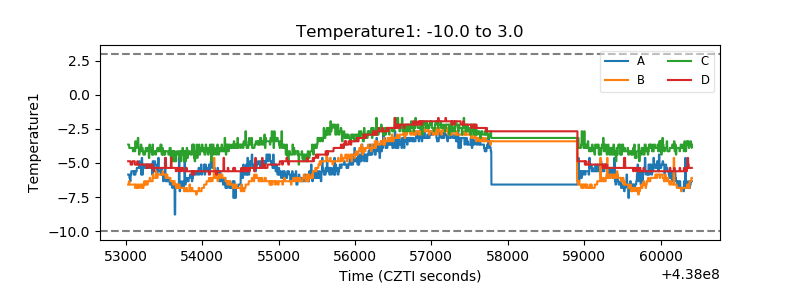 |
| Veto HV Monitor | 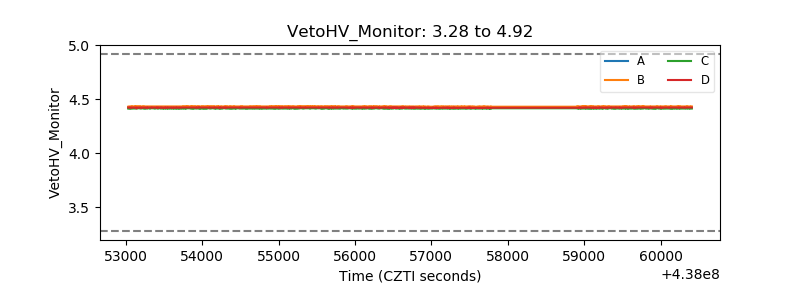 |
| Veto LLD | 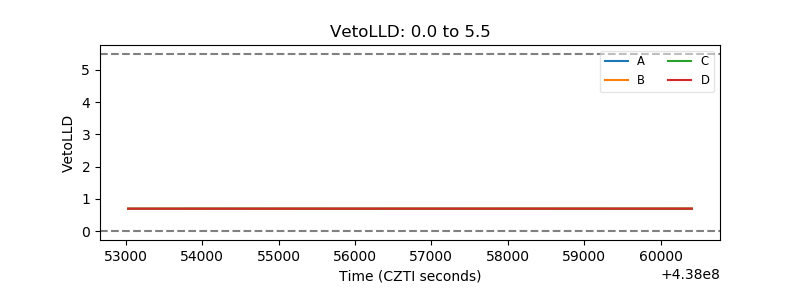 |
| Alpha Counter | 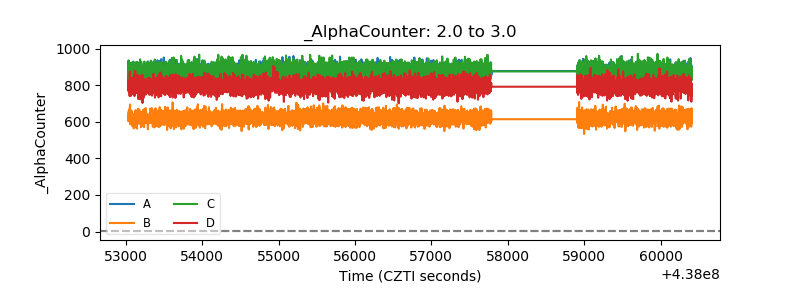 |
| _CPM_Rate | 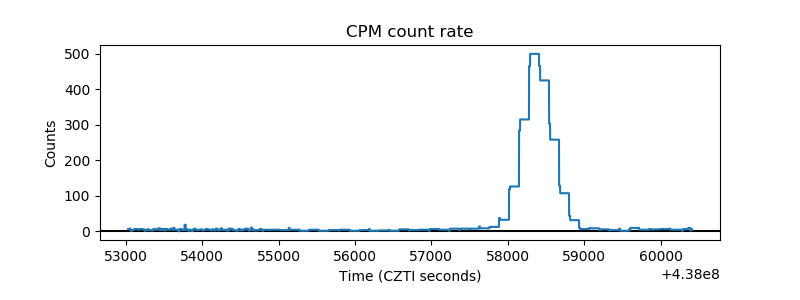 |
| CZT Counter | 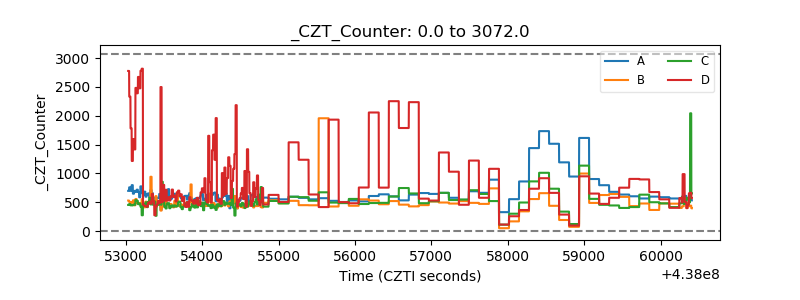 |
| +2.5 Volts monitor | 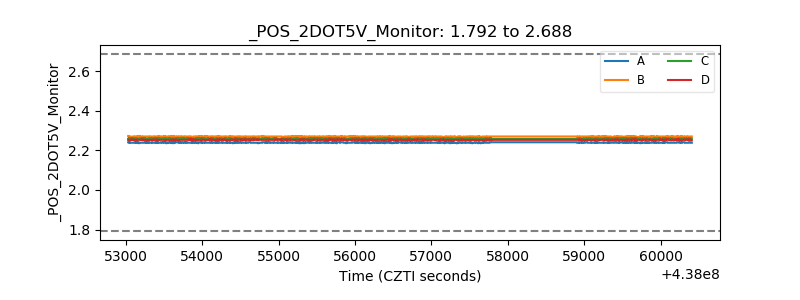 |
| +5 Volts monitor | 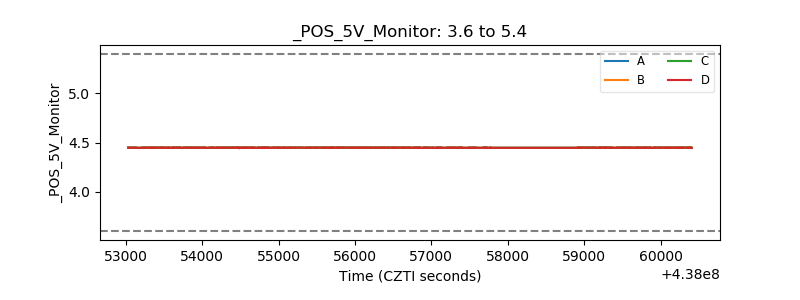 |
| _ROLL_ROT | 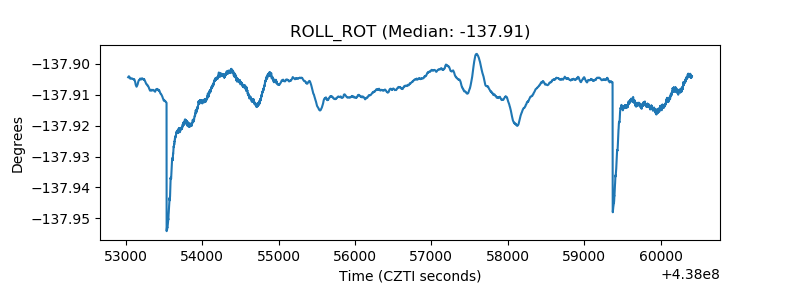 |
| _Roll_DEC | 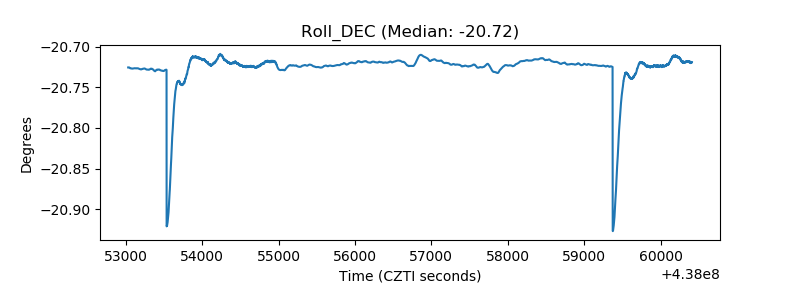 |
| _Roll_RA | 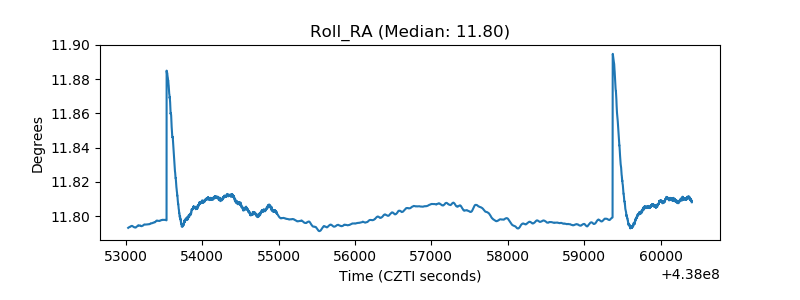 |
| Veto Counter | 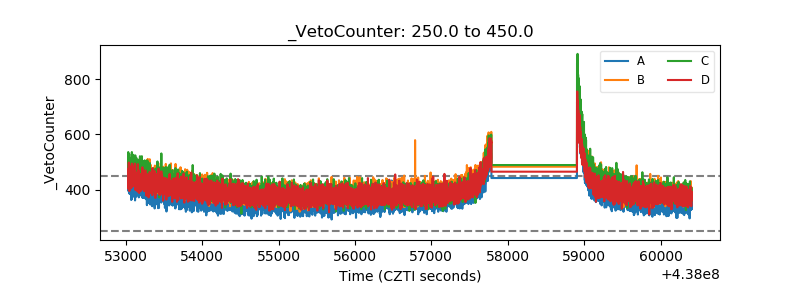 |