| Param | Original file | Final file |
|---|---|---|
| Filename | modeM0/AS1A13_023T03_9000005934_44027cztM0_level2.fits | modeM0/AS1A13_023T03_9000005934_44027cztM0_level2_quad_clean.evt |
| Size (bytes) | 464,664,960 | 116,331,840 |
| Size | 443.1 MB | 110.9 MB |
| Events in quadrant A | 4,793,611 | 773,014 |
| Events in quadrant B | 3,474,611 | 809,702 |
| Events in quadrant C | 3,572,636 | 768,260 |
| Events in quadrant D | 4,813,578 | 682,555 |
| Mode SS | |||
|---|---|---|---|
| Quadrant | BADHDUFLAG | Total packets | Discarded packets |
| A | 0 | 144 | 0 |
| B | 0 | 144 | 0 |
| C | 0 | 144 | 0 |
| D | 0 | 144 | 0 |
| Mode M9 | |||
|---|---|---|---|
| Quadrant | BADHDUFLAG | Total packets | Discarded packets |
| A | 0 | 20 | 0 |
| B | 0 | 20 | 0 |
| C | 0 | 20 | 0 |
| D | 0 | 20 | 0 |
| Mode M0 | |||
|---|---|---|---|
| Quadrant | BADHDUFLAG | Total packets | Discarded packets |
| A | 0 | 19036 | 2 |
| B | 0 | 14993 | 3 |
| C | 0 | 15129 | 2 |
| D | 0 | 19114 | 10 |
| Quadrant | Total seconds | Saturated seconds | Saturation percentage |
|---|---|---|---|
| A | 7026 | 181 | 2.576146% |
| B | 7025 | 127 | 1.807829% |
| C | 7026 | 100 | 1.423285% |
| D | 7023 | 342 | 4.869714% |
Noise dominated data is calculated using 1-second bins in cleaned event files. If a bin has >2000 counts, and if more than 50% of those come from <1% of pixels, then it is considered to be noise-dominated and hence unusable.
| Quadrant | # 1 sec bins | Bins with >0 counts | Bins with >2000 counts | High rate bins dominated by noise | Noise dominated (total time) | Noise dominated (detector-on time) | Marked lightcurve |
|---|---|---|---|---|---|---|---|
| A | 9041 | 7028 | 44 | 44 | 0.49% | 0.63% | 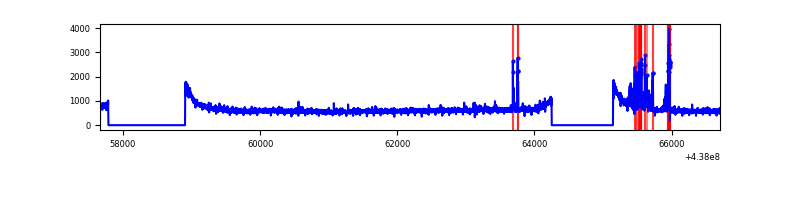 |
| B | 9040 | 7027 | 9 | 9 | 0.10% | 0.13% | 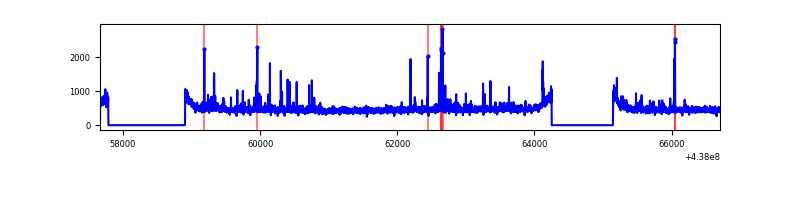 |
| C | 9041 | 7028 | 13 | 13 | 0.14% | 0.18% | 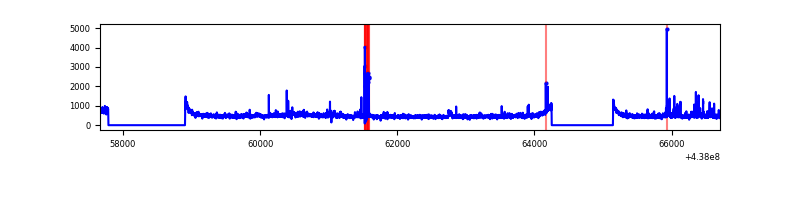 |
| D | 9041 | 7026 | 212 | 212 | 2.34% | 3.02% | 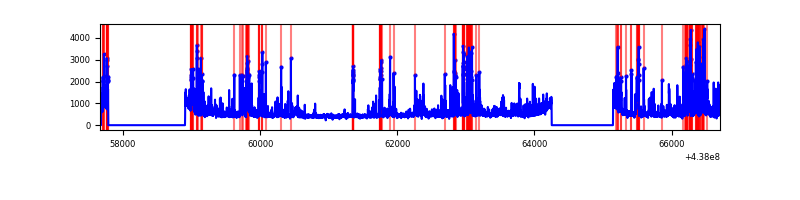 |
Top three noisy pixels from each quadrant. If the there are fewer than three noisy pixels in the level2.evt file, extra rows are filled as -1
| Pixel properties | Quadrant properties | ||||||
|---|---|---|---|---|---|---|---|
| Quadrant | DetID | PixID | Counts | Sigma | Mean | Median | Sigma |
| A | 10 | 83 | 1313659 | 7678.73 | 820 | 799 | 171.0 |
| A | 15 | 222 | 246124 | 1434.87 | 820 | 799 | 171.0 |
| A | 14 | 238 | 33468 | 191.08 | 820 | 799 | 171.0 |
| B | 0 | 213 | 96789 | 585.31 | 828 | 801 | 164.0 |
| B | 4 | 171 | 35630 | 212.38 | 828 | 801 | 164.0 |
| B | 12 | 111 | 21143 | 124.04 | 828 | 801 | 164.0 |
| C | 3 | 233 | 216444 | 1111.4 | 817 | 822 | 194.0 |
| C | 14 | 254 | 105431 | 539.19 | 817 | 822 | 194.0 |
| C | 14 | 96 | 53899 | 273.58 | 817 | 822 | 194.0 |
| D | 7 | 80 | 848388 | 4150.92 | 801 | 775 | 204.2 |
| D | 5 | 235 | 184070 | 897.63 | 801 | 775 | 204.2 |
| D | 1 | 52 | 143475 | 698.83 | 801 | 775 | 204.2 |
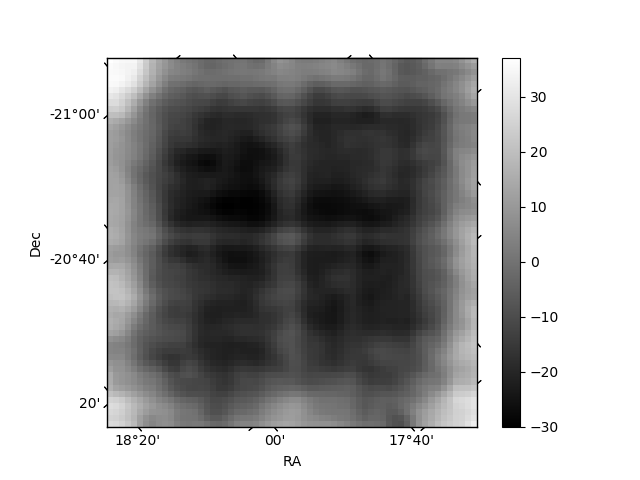
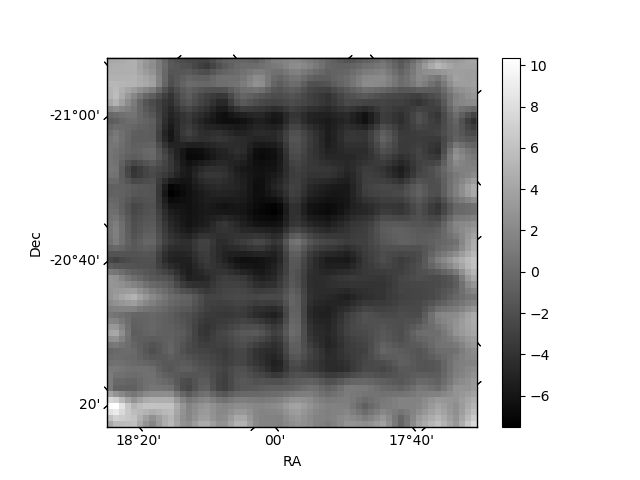
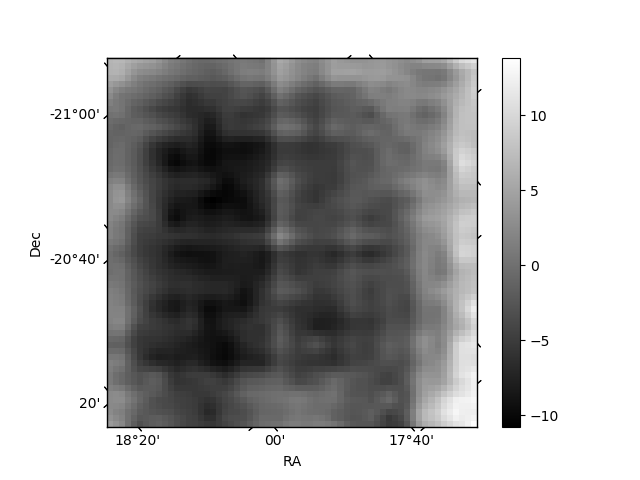
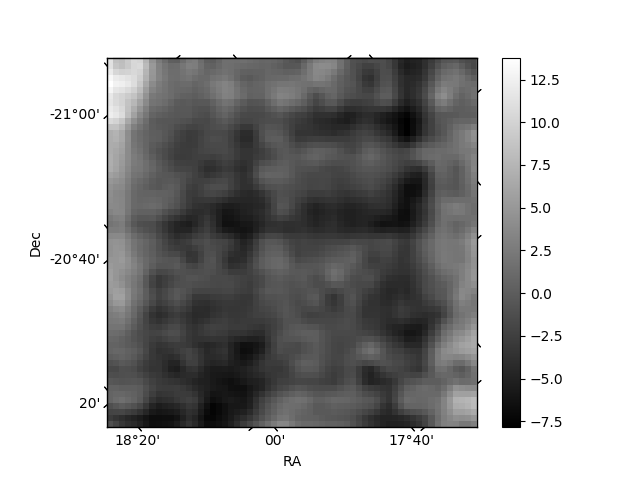
Histogram calculated using DETX and DETY for each event in the final _common_clean file
| Quadrant A | 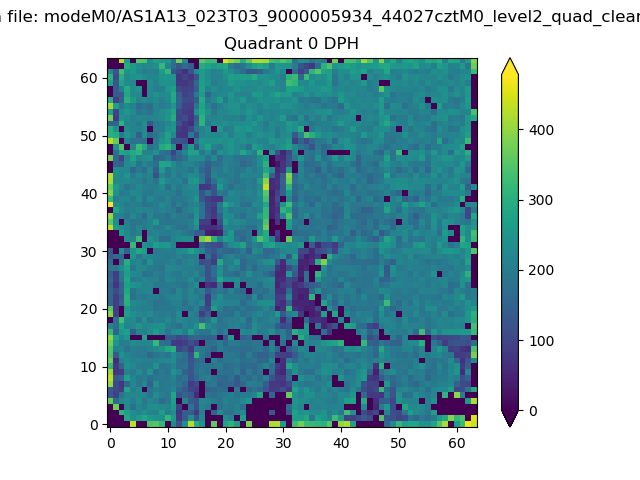 |
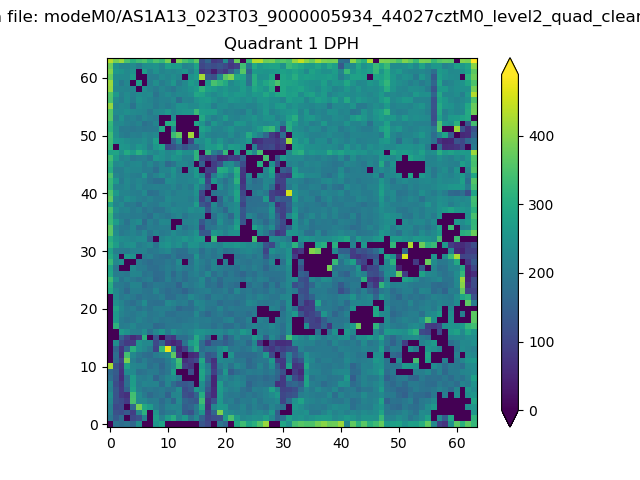 |
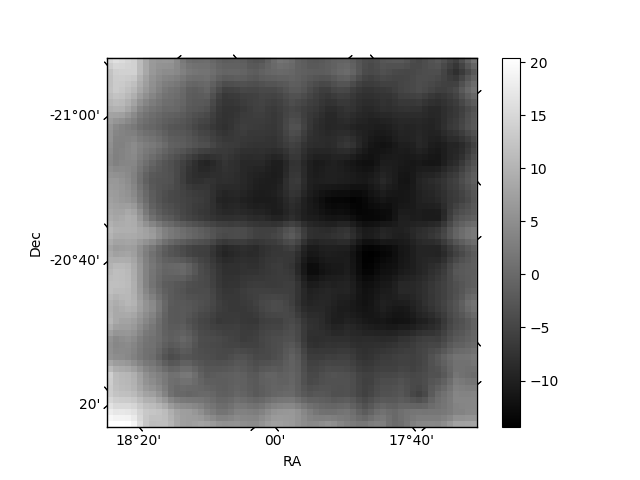
Quadrant B |
|---|---|---|---|
| Quadrant D | 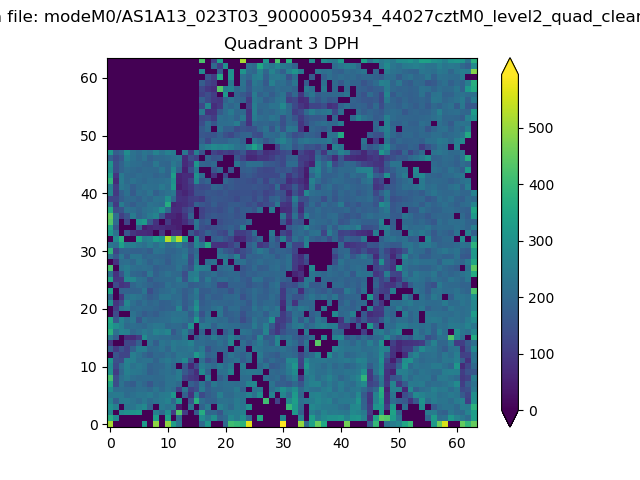 |
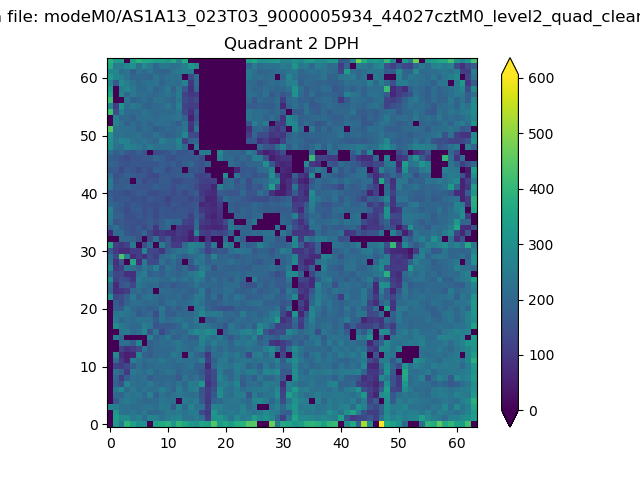 |
Quadrant C |
| Plot type | Count rate plots | Images |
|---|---|---|
| Comparison with Poisson distribution Blue bars denote a histogram of data divided into 1 sec bins. Red curve is a Poisson curve with rate = median count rate of data. |
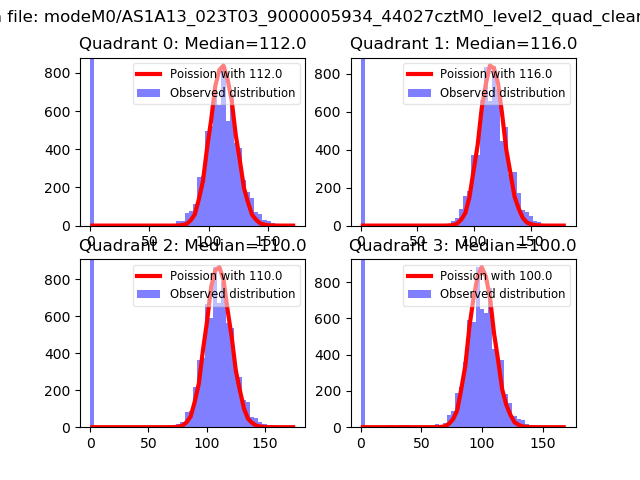 |
 |
| Quadrant-wise count rates Data is divided into 100 sec bins |
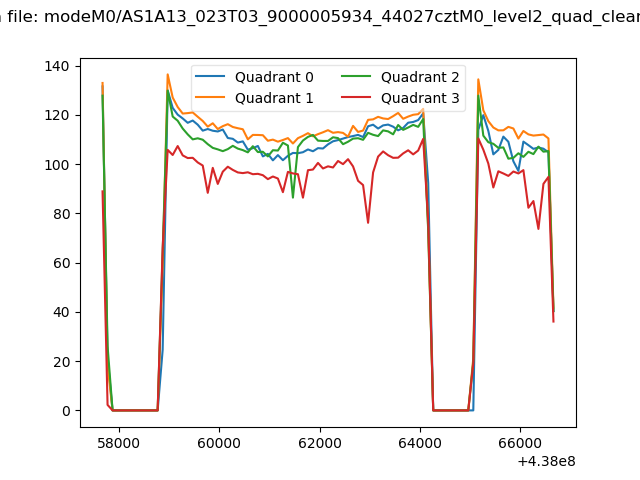 |
|
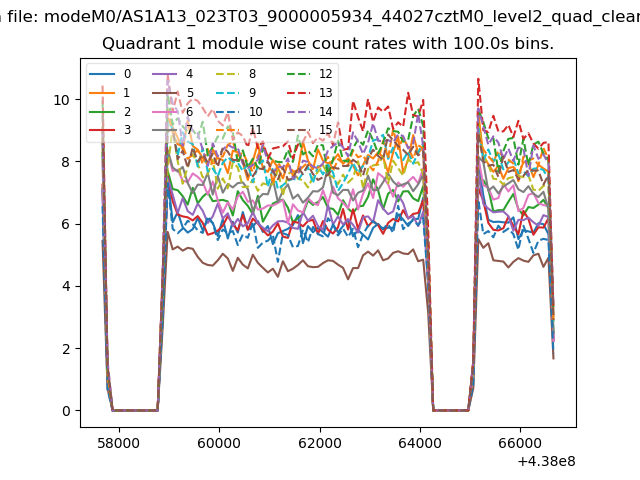
| Module-wise count rates for Quadrant A Data is divided into 100 sec bins |
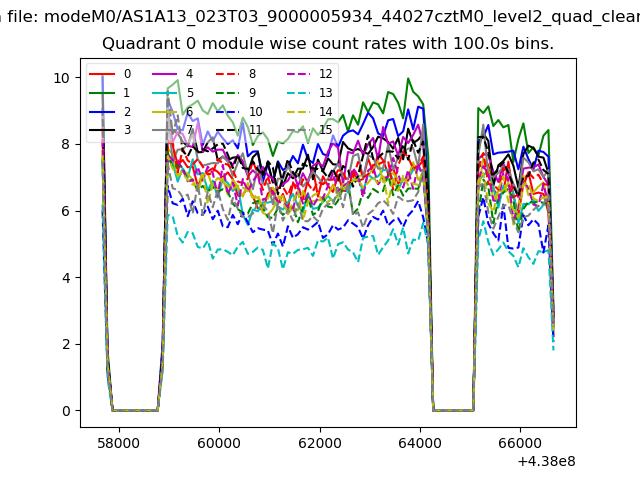 |
 |
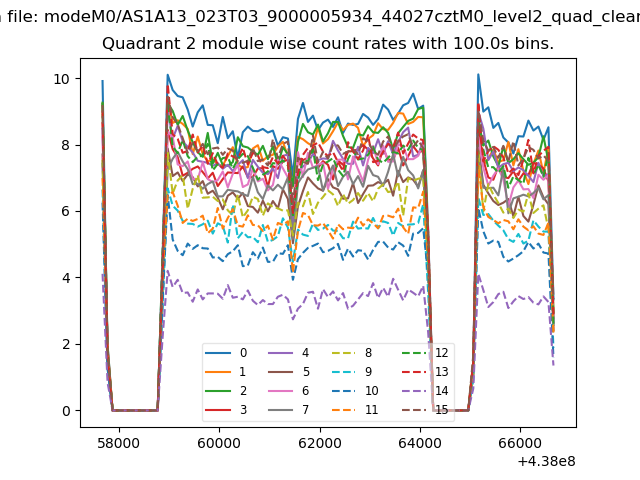
| Module-wise count rates for Quadrant B Data is divided into 100 sec bins |
 |
 |
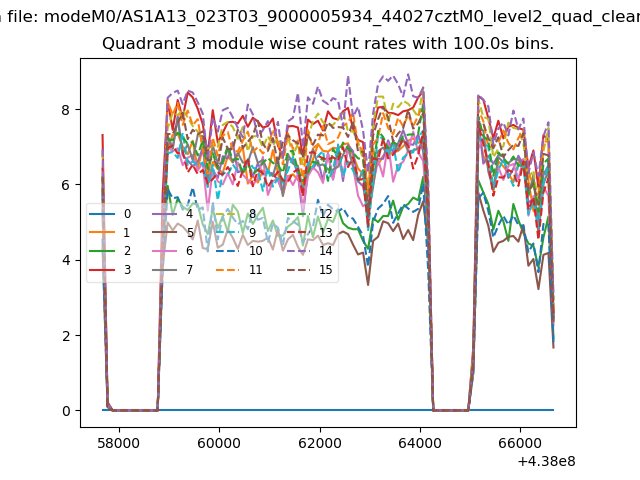
| Module-wise count rates for Quadrant C Data is divided into 100 sec bins |
 |
 |
| Module-wise count rates for Quadrant D Data is divided into 100 sec bins |
 |
 |
| Parameter | Plot |
|---|---|
| CZT HV Monitor | 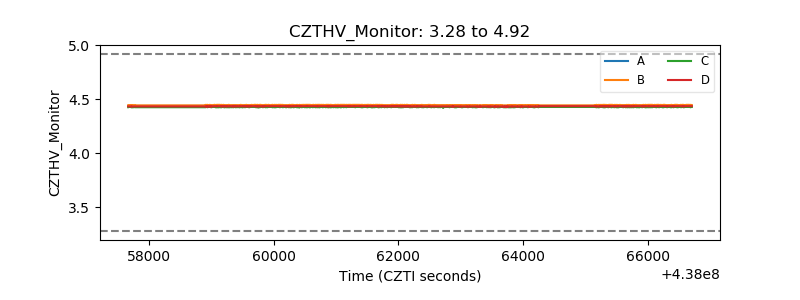 |
| D_VDD | 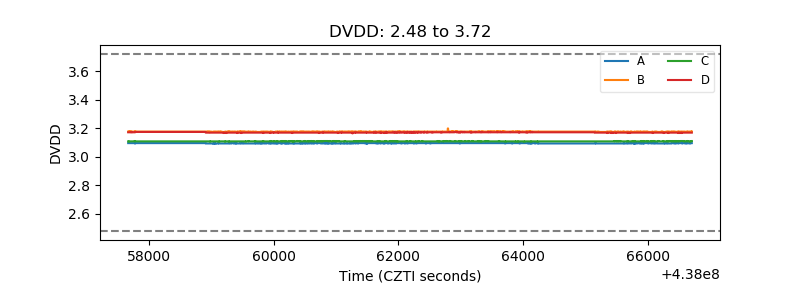 |
| Temperature 1 | 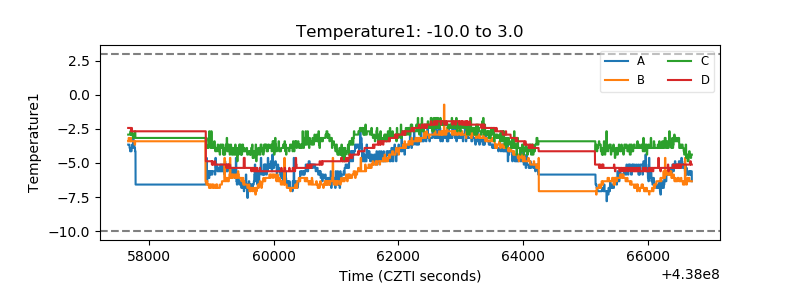 |
| Veto HV Monitor | 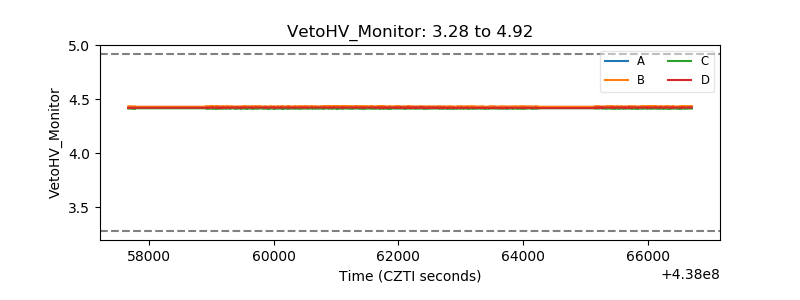 |
| Veto LLD | 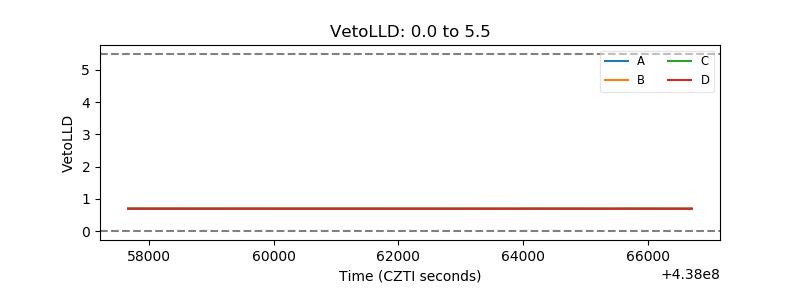 |
| Alpha Counter | 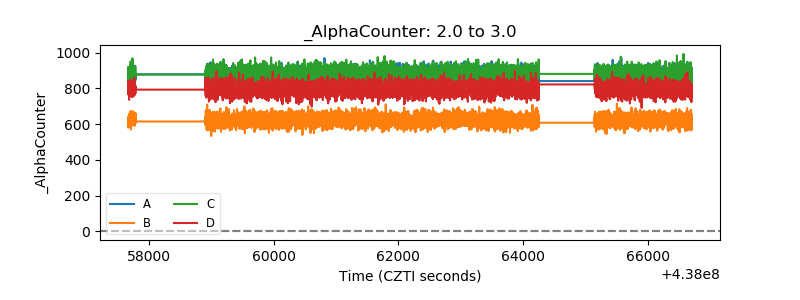 |
| _CPM_Rate | 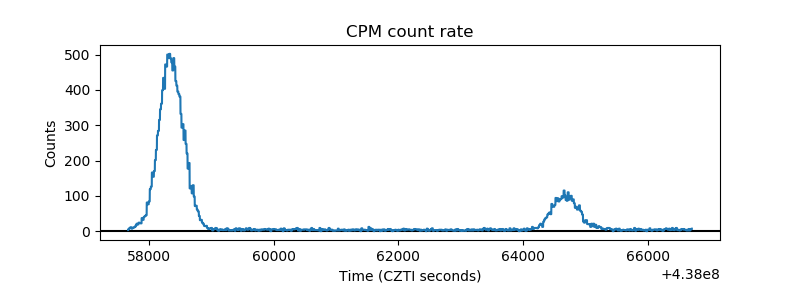 |
| CZT Counter | 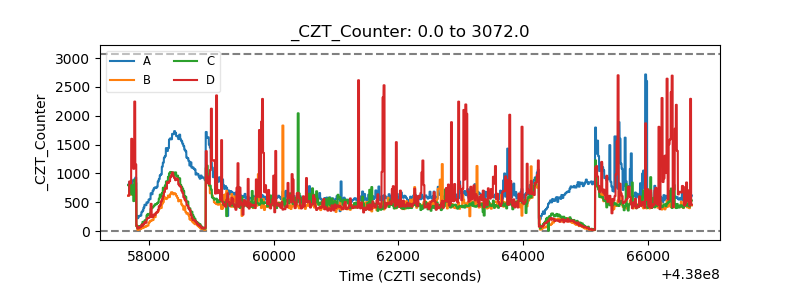 |
| +2.5 Volts monitor | 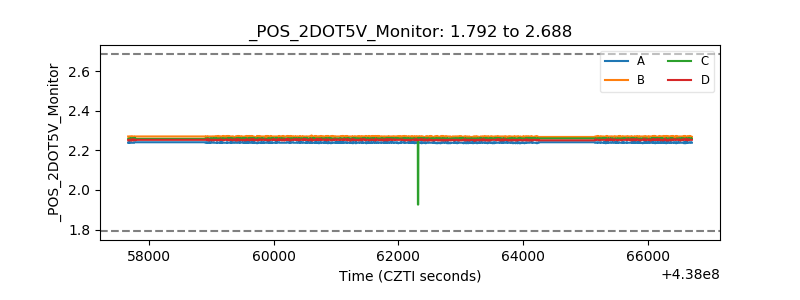 |
| +5 Volts monitor | 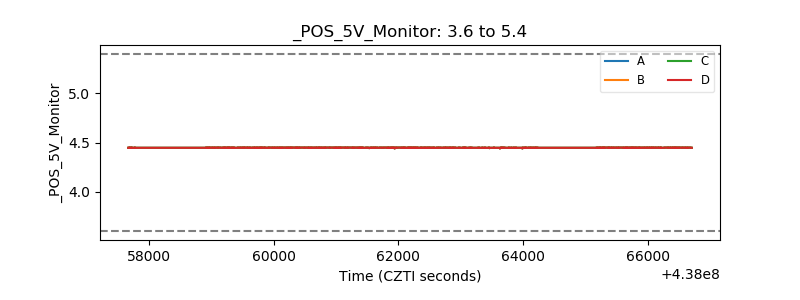 |
| _ROLL_ROT | 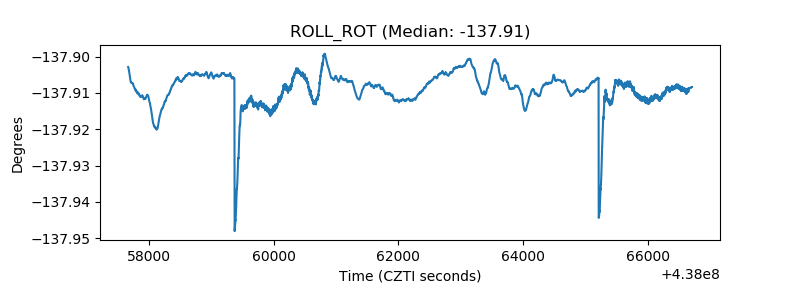 |
| _Roll_DEC | 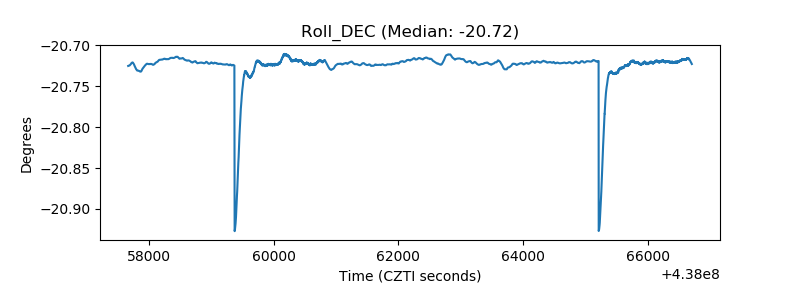 |
| _Roll_RA | 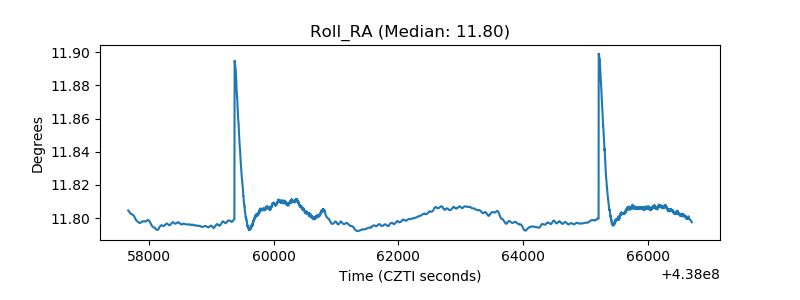 |
| Veto Counter | 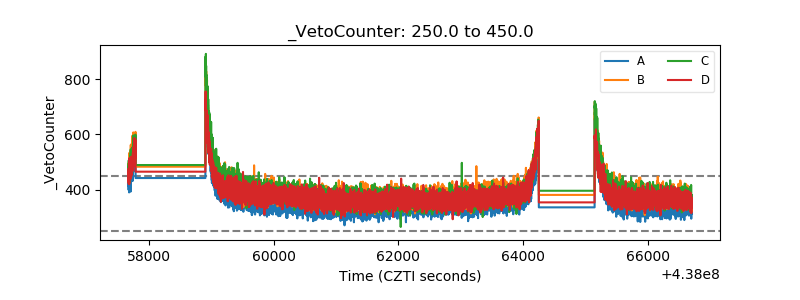 |