| Param | Original file | Final file |
|---|---|---|
| Filename | modeM0/AS1A13_023T03_9000005934_44028cztM0_level2.fits | modeM0/AS1A13_023T03_9000005934_44028cztM0_level2_quad_clean.evt |
| Size (bytes) | 507,888,000 | 118,684,800 |
| Size | 484.4 MB | 113.2 MB |
| Events in quadrant A | 4,912,215 | 783,861 |
| Events in quadrant B | 4,074,151 | 806,439 |
| Events in quadrant C | 3,938,862 | 785,557 |
| Events in quadrant D | 5,297,019 | 699,975 |
| Mode SS | |||
|---|---|---|---|
| Quadrant | BADHDUFLAG | Total packets | Discarded packets |
| A | 0 | 152 | 0 |
| B | 0 | 152 | 0 |
| C | 0 | 152 | 0 |
| D | 0 | 152 | 0 |
| Mode M9 | |||
|---|---|---|---|
| Quadrant | BADHDUFLAG | Total packets | Discarded packets |
| A | 0 | 7 | 0 |
| B | 0 | 8 | 0 |
| C | 0 | 8 | 0 |
| D | 0 | 8 | 0 |
| Mode M0 | |||
|---|---|---|---|
| Quadrant | BADHDUFLAG | Total packets | Discarded packets |
| A | 0 | 19317 | 2 |
| B | 0 | 17104 | 2 |
| C | 0 | 16741 | 2 |
| D | 0 | 20768 | 2 |
| Quadrant | Total seconds | Saturated seconds | Saturation percentage |
|---|---|---|---|
| A | 7442 | 290 | 3.896802% |
| B | 7442 | 378 | 5.079280% |
| C | 7442 | 207 | 2.781510% |
| D | 7442 | 430 | 5.778017% |
Noise dominated data is calculated using 1-second bins in cleaned event files. If a bin has >2000 counts, and if more than 50% of those come from <1% of pixels, then it is considered to be noise-dominated and hence unusable.
| Quadrant | # 1 sec bins | Bins with >0 counts | Bins with >2000 counts | High rate bins dominated by noise | Noise dominated (total time) | Noise dominated (detector-on time) | Marked lightcurve |
|---|---|---|---|---|---|---|---|
| A | 7762 | 7445 | 39 | 39 | 0.50% | 0.52% | 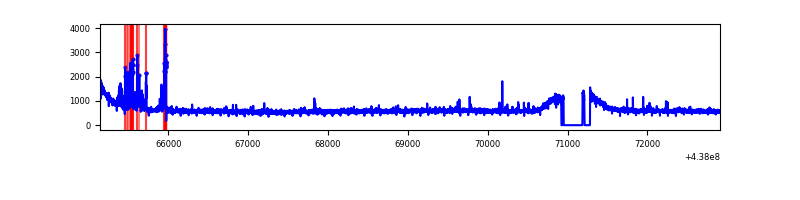 |
| B | 7762 | 7445 | 84 | 84 | 1.08% | 1.13% | 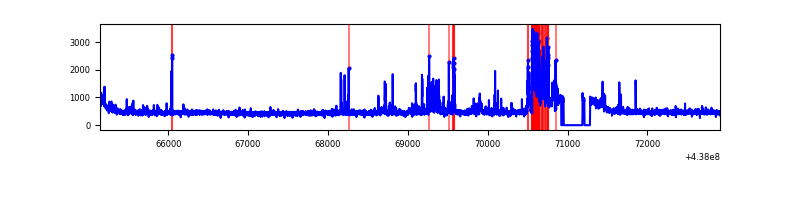 |
| C | 7762 | 7445 | 35 | 35 | 0.45% | 0.47% | 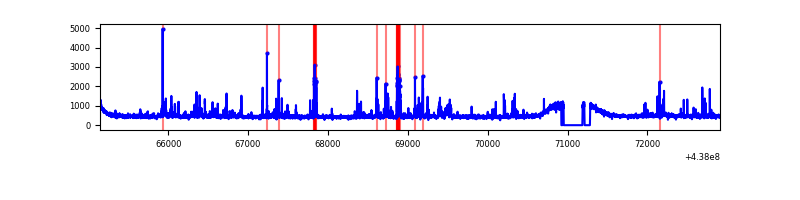 |
| D | 7762 | 7445 | 227 | 227 | 2.92% | 3.05% | 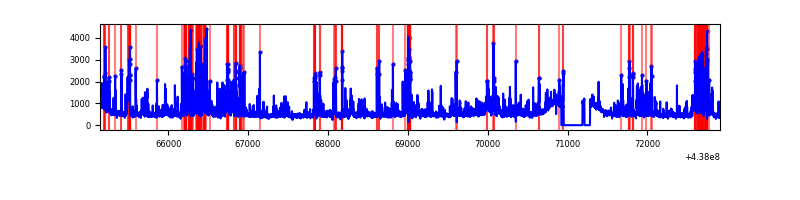 |
Top three noisy pixels from each quadrant. If the there are fewer than three noisy pixels in the level2.evt file, extra rows are filled as -1
| Pixel properties | Quadrant properties | ||||||
|---|---|---|---|---|---|---|---|
| Quadrant | DetID | PixID | Counts | Sigma | Mean | Median | Sigma |
| A | 10 | 83 | 1223099 | 6558.96 | 881 | 860 | 186.3 |
| A | 15 | 222 | 236855 | 1266.43 | 881 | 860 | 186.3 |
| A | 15 | 223 | 33017 | 172.57 | 881 | 860 | 186.3 |
| B | 4 | 171 | 399307 | 2245.54 | 874 | 844 | 177.4 |
| B | 7 | 221 | 70213 | 390.93 | 874 | 844 | 177.4 |
| B | 0 | 213 | 59910 | 332.87 | 874 | 844 | 177.4 |
| C | 14 | 254 | 247225 | 1173.65 | 875 | 880 | 209.9 |
| C | 14 | 96 | 110542 | 522.46 | 875 | 880 | 209.9 |
| C | 3 | 233 | 109068 | 515.43 | 875 | 880 | 209.9 |
| D | 7 | 80 | 1042148 | 4683.9 | 863 | 837 | 222.3 |
| D | 1 | 52 | 223530 | 1001.69 | 863 | 837 | 222.3 |
| D | 12 | 17 | 148344 | 663.5 | 863 | 837 | 222.3 |
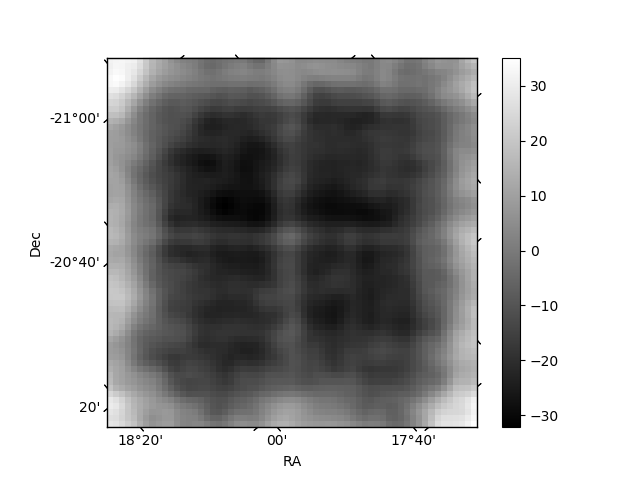
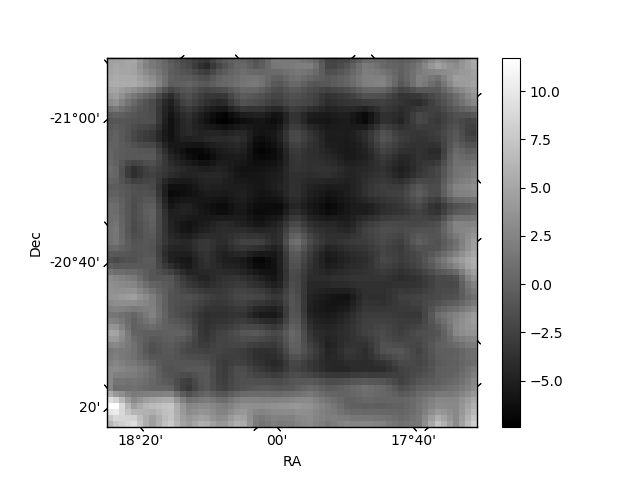
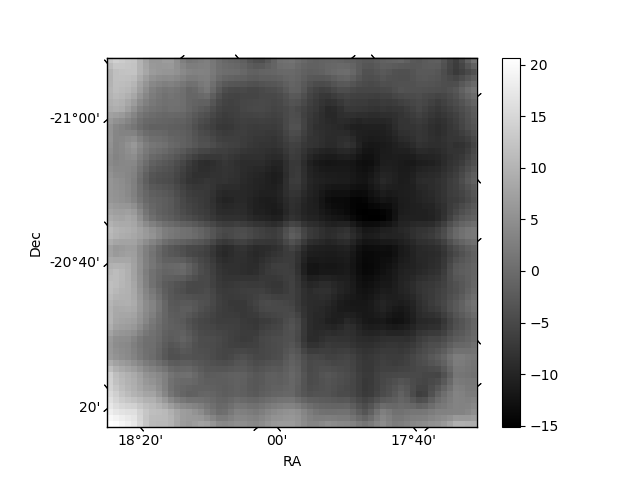
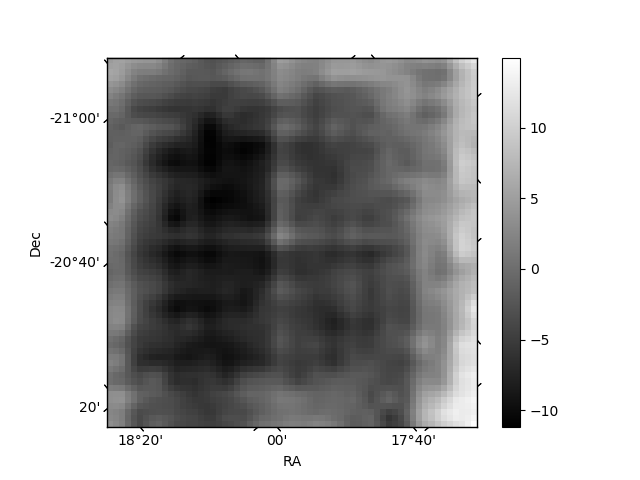
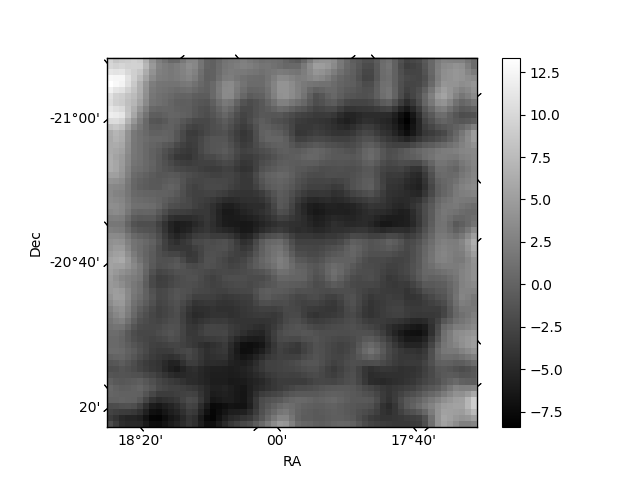
Histogram calculated using DETX and DETY for each event in the final _common_clean file
| Quadrant A | 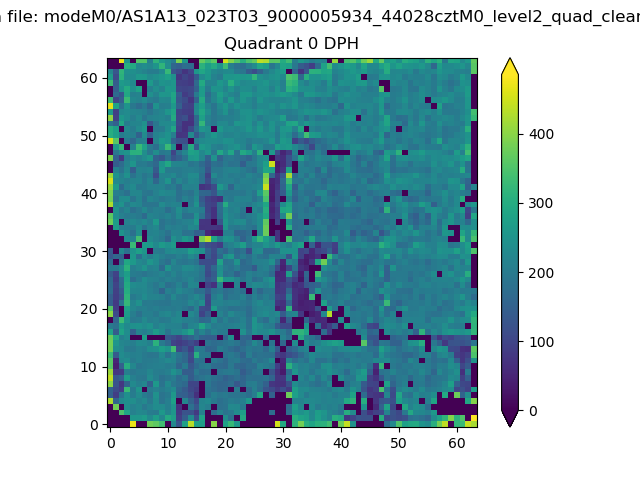 |
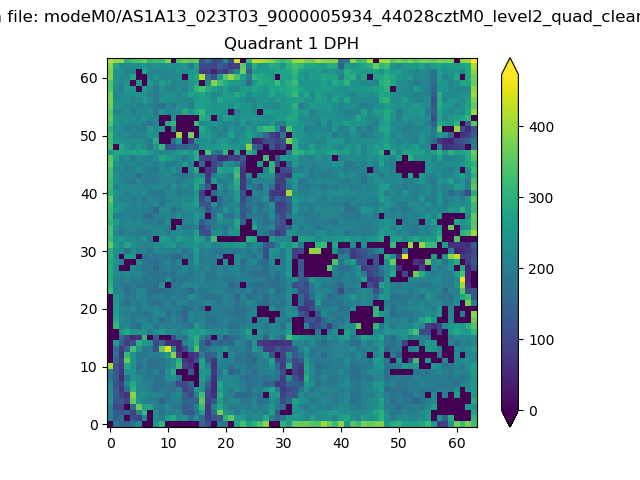 |
Quadrant B |
|---|---|---|---|
| Quadrant D | 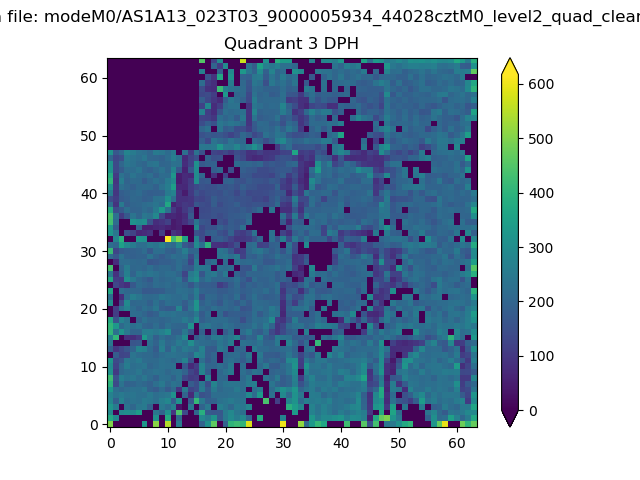 |
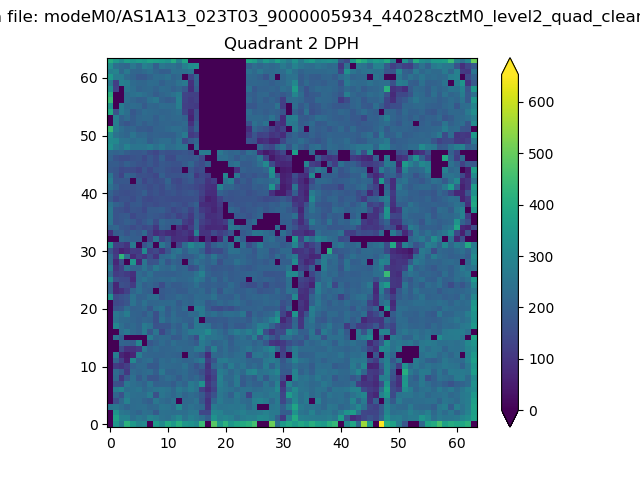 |
Quadrant C |
| Plot type | Count rate plots | Images |
|---|---|---|
| Comparison with Poisson distribution Blue bars denote a histogram of data divided into 1 sec bins. Red curve is a Poisson curve with rate = median count rate of data. |
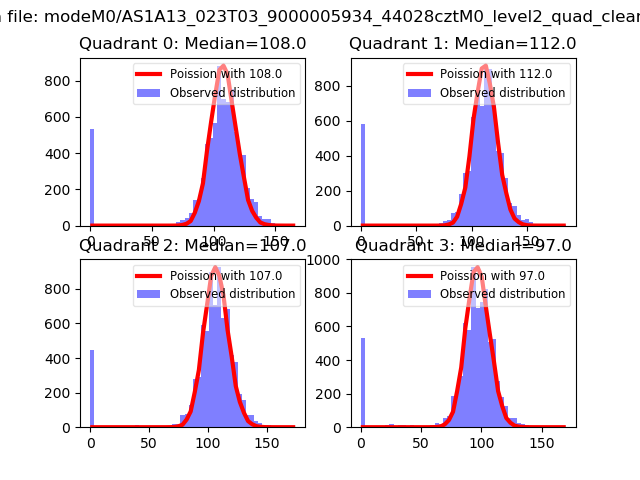 |
 |
| Quadrant-wise count rates Data is divided into 100 sec bins |
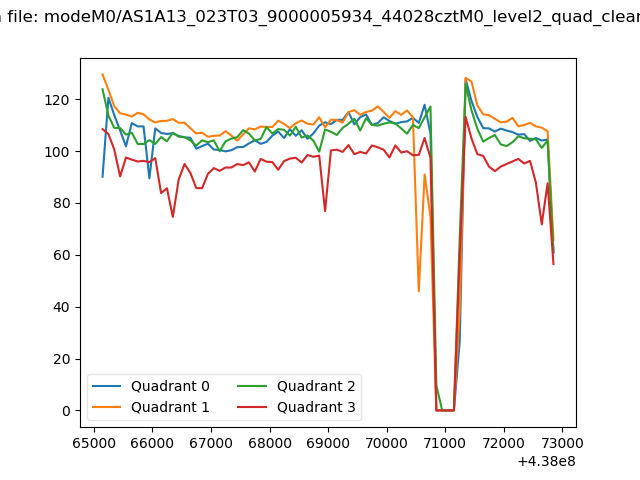 |
|
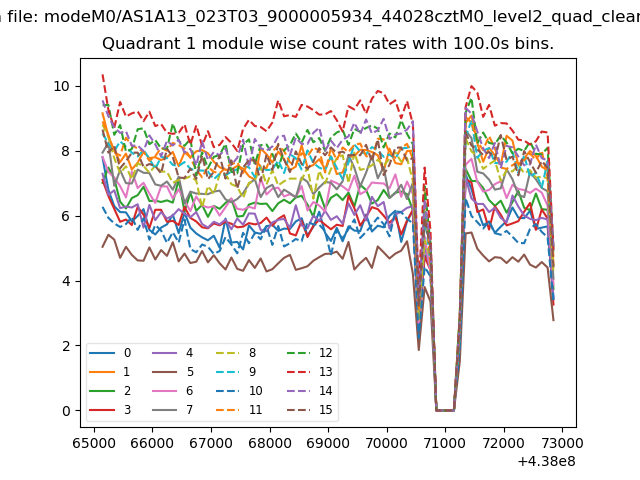
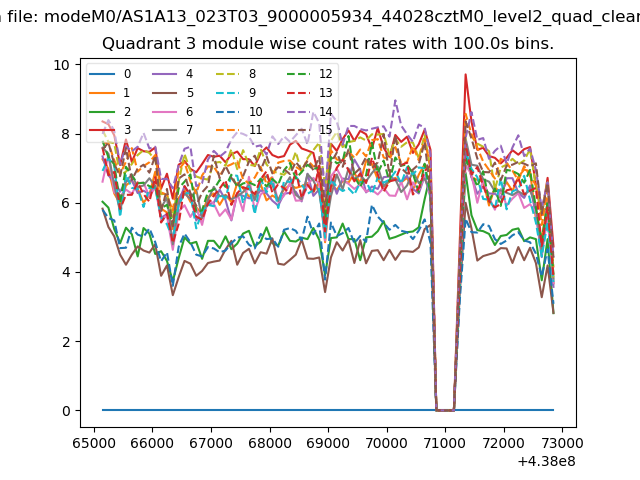
| Module-wise count rates for Quadrant A Data is divided into 100 sec bins |
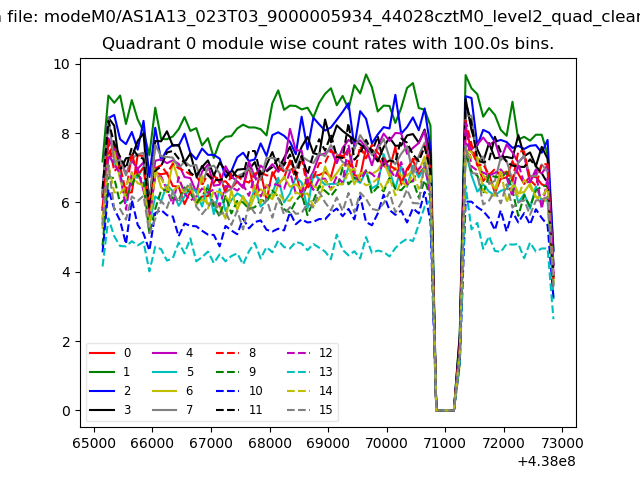 |
 |
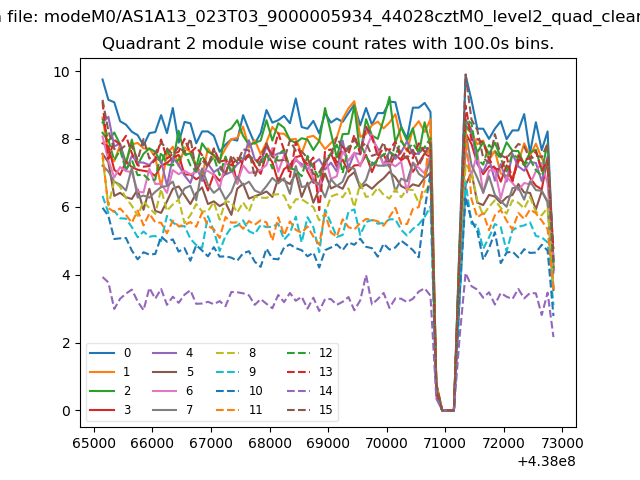
| Module-wise count rates for Quadrant B Data is divided into 100 sec bins |
 |
 |
| Module-wise count rates for Quadrant C Data is divided into 100 sec bins |
 |
 |
| Module-wise count rates for Quadrant D Data is divided into 100 sec bins |
 |
 |
| Parameter | Plot |
|---|---|
| CZT HV Monitor | 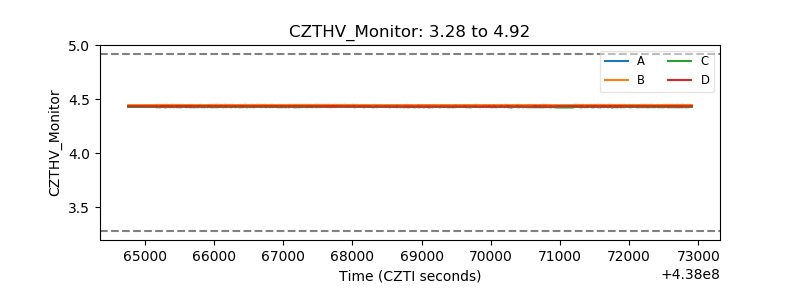 |
| D_VDD | 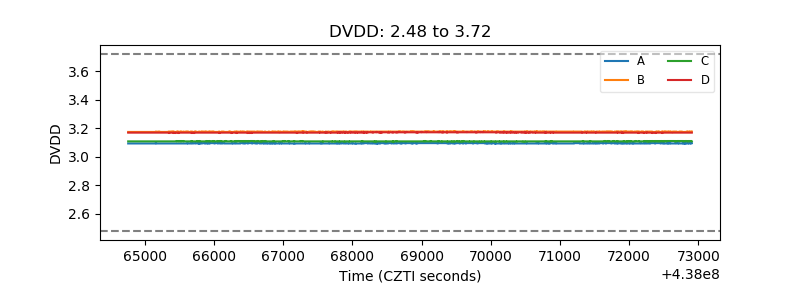 |
| Temperature 1 | 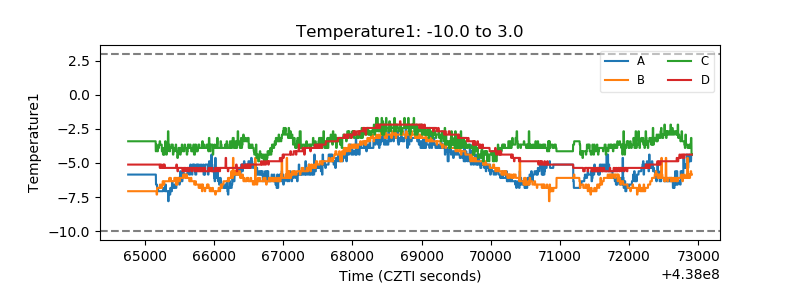 |
| Veto HV Monitor | 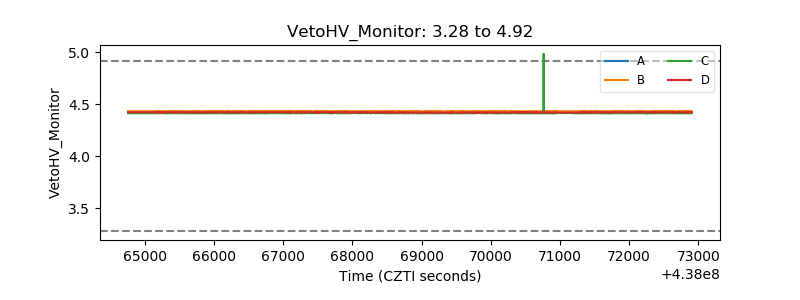 |
| Veto LLD | 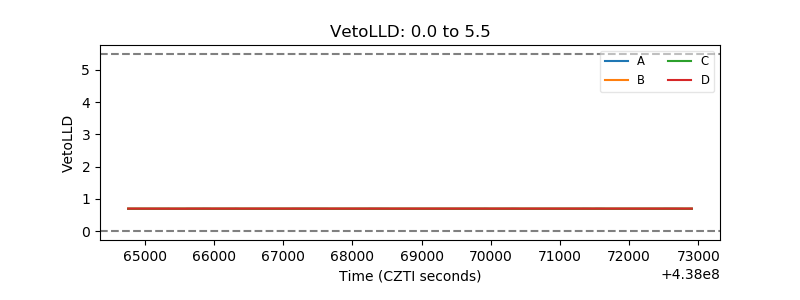 |
| Alpha Counter | 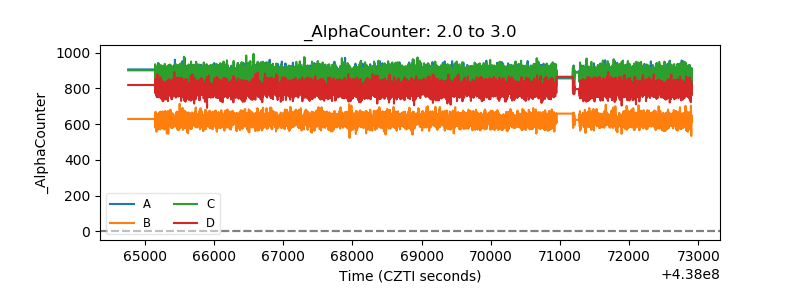 |
| _CPM_Rate | 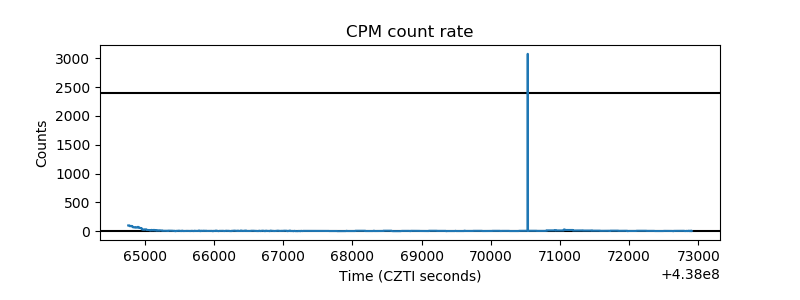 |
| CZT Counter | 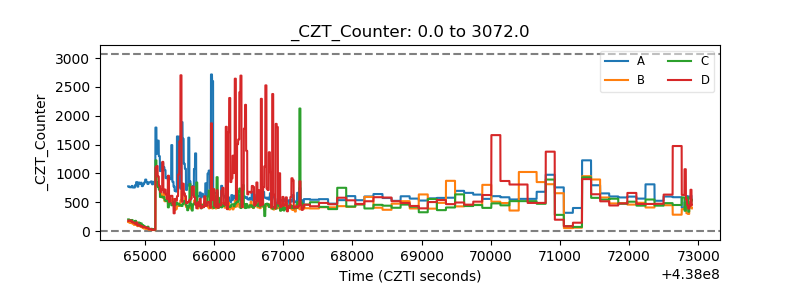 |
| +2.5 Volts monitor | 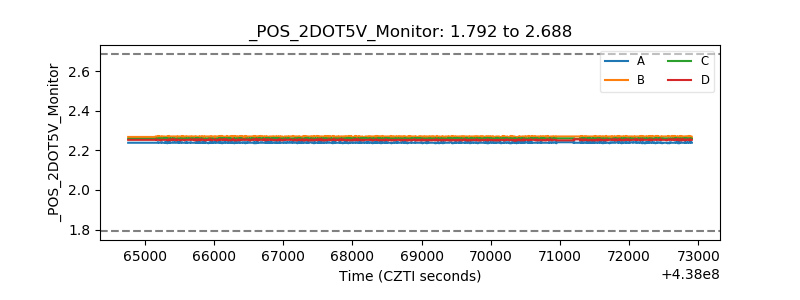 |
| +5 Volts monitor | 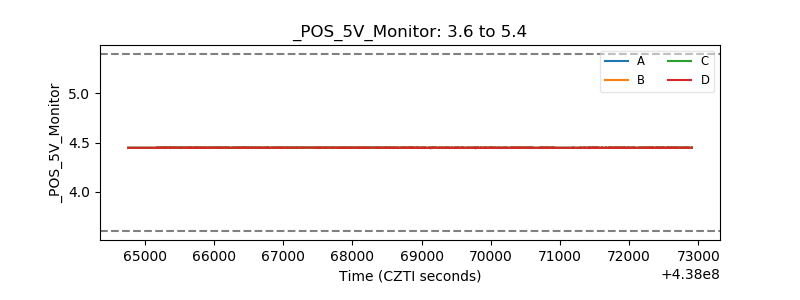 |
| _ROLL_ROT | 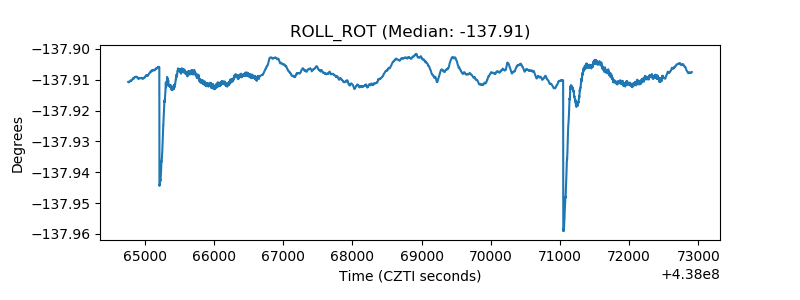 |
| _Roll_DEC | 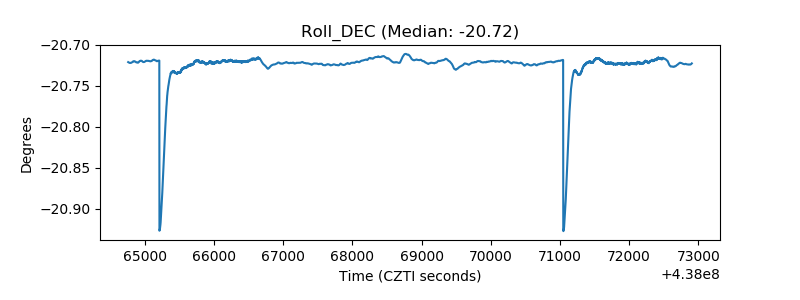 |
| _Roll_RA | 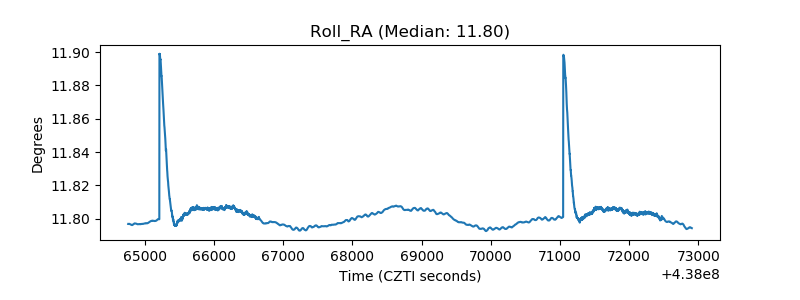 |
| Veto Counter | 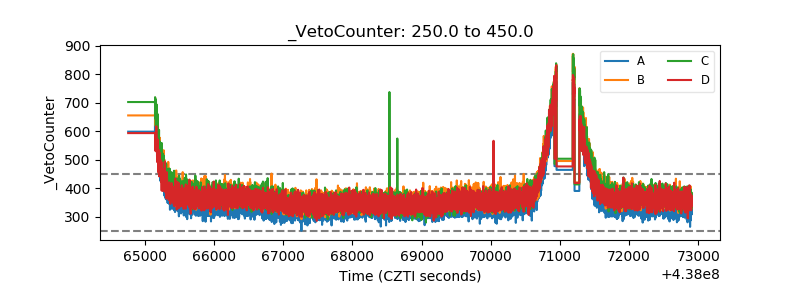 |