| Param | Original file | Final file |
|---|---|---|
| Filename | modeM0/AS1A13_023T03_9000005934_44029cztM0_level2.fits | modeM0/AS1A13_023T03_9000005934_44029cztM0_level2_quad_clean.evt |
| Size (bytes) | 517,187,520 | 126,717,120 |
| Size | 493.2 MB | 120.8 MB |
| Events in quadrant A | 4,877,871 | 845,563 |
| Events in quadrant B | 3,916,340 | 872,688 |
| Events in quadrant C | 4,148,994 | 835,188 |
| Events in quadrant D | 5,593,279 | 738,863 |
| Mode SS | |||
|---|---|---|---|
| Quadrant | BADHDUFLAG | Total packets | Discarded packets |
| A | 0 | 156 | 0 |
| B | 0 | 156 | 0 |
| C | 0 | 156 | 0 |
| D | 0 | 156 | 0 |
| Mode M0 | |||
|---|---|---|---|
| Quadrant | BADHDUFLAG | Total packets | Discarded packets |
| A | 0 | 19658 | 3 |
| B | 0 | 16691 | 0 |
| C | 0 | 17633 | 3 |
| D | 0 | 21858 | 6 |
| Quadrant | Total seconds | Saturated seconds | Saturation percentage |
|---|---|---|---|
| A | 7834 | 91 | 1.161603% |
| B | 7837 | 143 | 1.824678% |
| C | 7835 | 62 | 0.791321% |
| D | 7834 | 385 | 4.914475% |
Noise dominated data is calculated using 1-second bins in cleaned event files. If a bin has >2000 counts, and if more than 50% of those come from <1% of pixels, then it is considered to be noise-dominated and hence unusable.
| Quadrant | # 1 sec bins | Bins with >0 counts | Bins with >2000 counts | High rate bins dominated by noise | Noise dominated (total time) | Noise dominated (detector-on time) | Marked lightcurve |
|---|---|---|---|---|---|---|---|
| A | 7836 | 7835 | 7 | 7 | 0.09% | 0.09% | 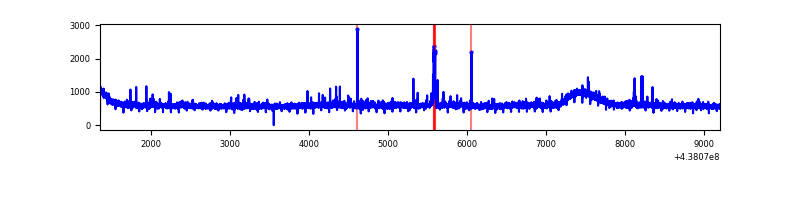 |
| B | 7837 | 7837 | 1 | 1 | 0.01% | 0.01% | 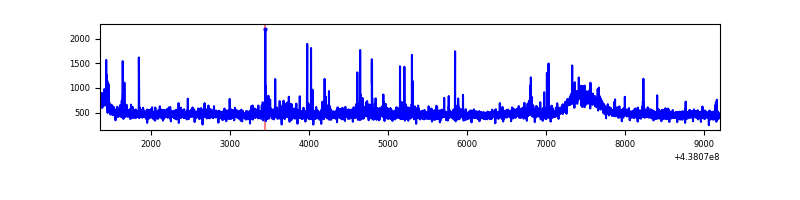 |
| C | 7837 | 7836 | 29 | 29 | 0.37% | 0.37% | 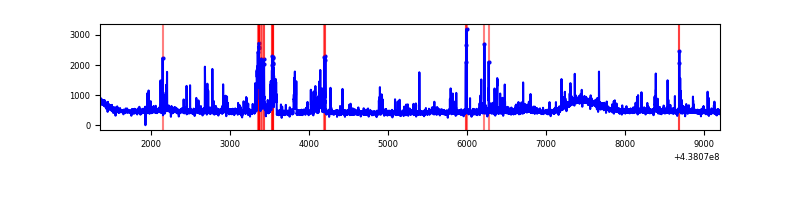 |
| D | 7837 | 7836 | 280 | 280 | 3.57% | 3.57% | 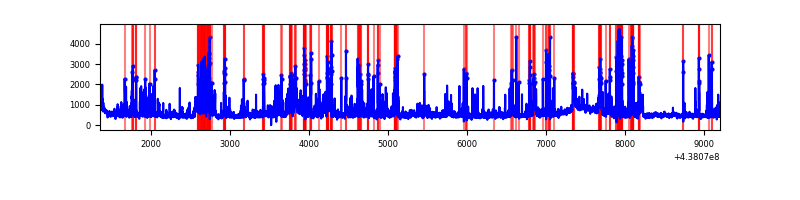 |
Top three noisy pixels from each quadrant. If the there are fewer than three noisy pixels in the level2.evt file, extra rows are filled as -1
| Pixel properties | Quadrant properties | ||||||
|---|---|---|---|---|---|---|---|
| Quadrant | DetID | PixID | Counts | Sigma | Mean | Median | Sigma |
| A | 10 | 83 | 1201933 | 6196.99 | 920 | 897 | 193.8 |
| A | 14 | 238 | 73266 | 373.4 | 920 | 897 | 193.8 |
| A | 15 | 223 | 26976 | 134.56 | 920 | 897 | 193.8 |
| B | 3 | 112 | 144898 | 778.75 | 920 | 891 | 184.9 |
| B | 0 | 213 | 70660 | 377.29 | 920 | 891 | 184.9 |
| B | 4 | 171 | 24895 | 129.81 | 920 | 891 | 184.9 |
| C | 9 | 237 | 280259 | 1295.29 | 905 | 910 | 215.7 |
| C | 14 | 254 | 160205 | 738.62 | 905 | 910 | 215.7 |
| C | 3 | 233 | 99793 | 458.5 | 905 | 910 | 215.7 |
| D | 7 | 80 | 930191 | 4111.4 | 888 | 860 | 226.0 |
| D | 13 | 249 | 429859 | 1897.91 | 888 | 860 | 226.0 |
| D | 1 | 52 | 131659 | 578.66 | 888 | 860 | 226.0 |
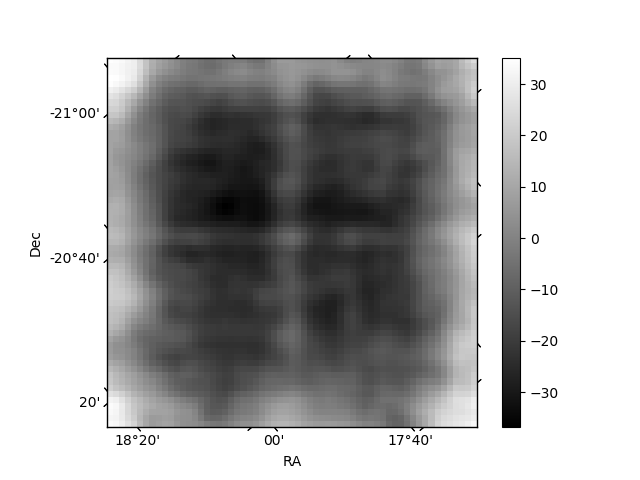
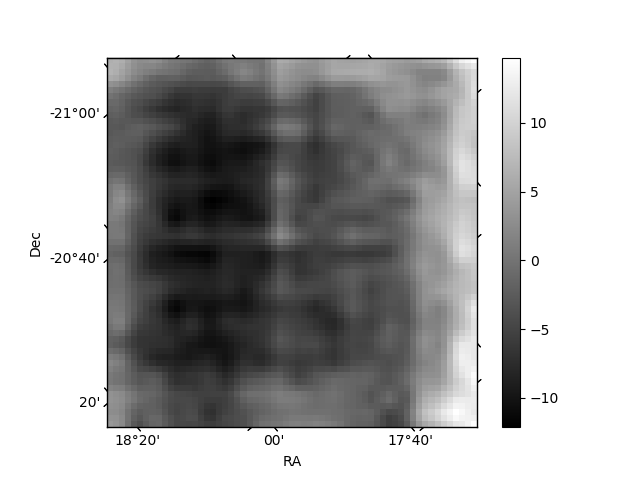
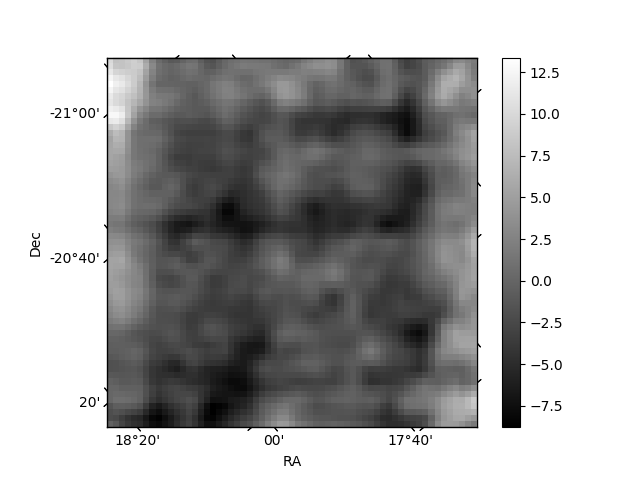
Histogram calculated using DETX and DETY for each event in the final _common_clean file
| Quadrant A | 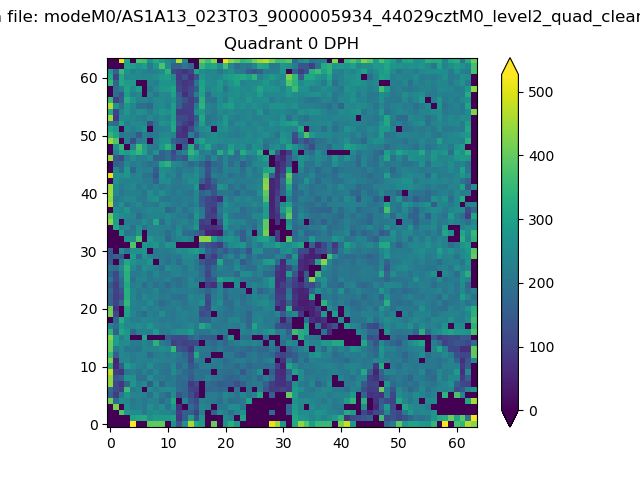 |
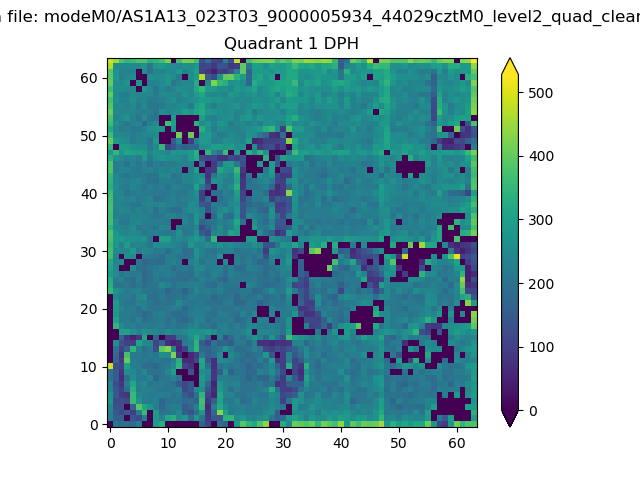 |
Quadrant B |
|---|---|---|---|
| Quadrant D | 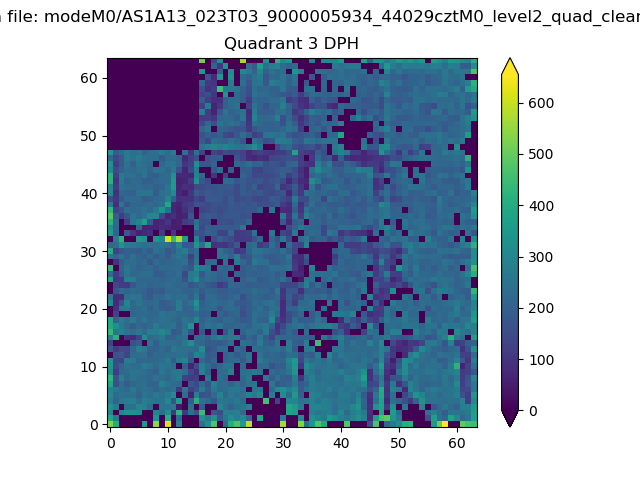 |
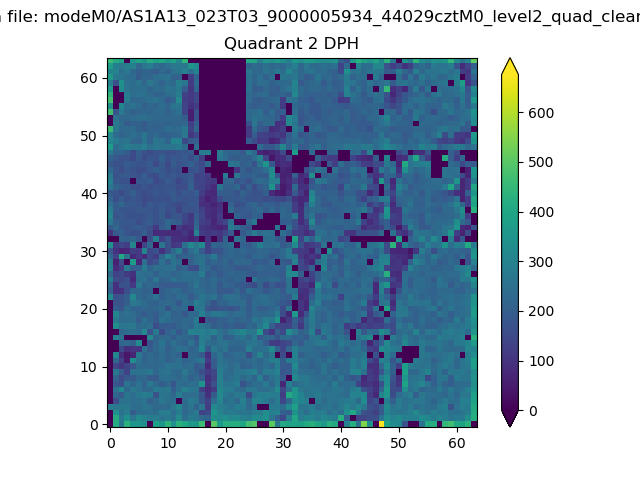 |
Quadrant C |
| Plot type | Count rate plots | Images |
|---|---|---|
| Comparison with Poisson distribution Blue bars denote a histogram of data divided into 1 sec bins. Red curve is a Poisson curve with rate = median count rate of data. |
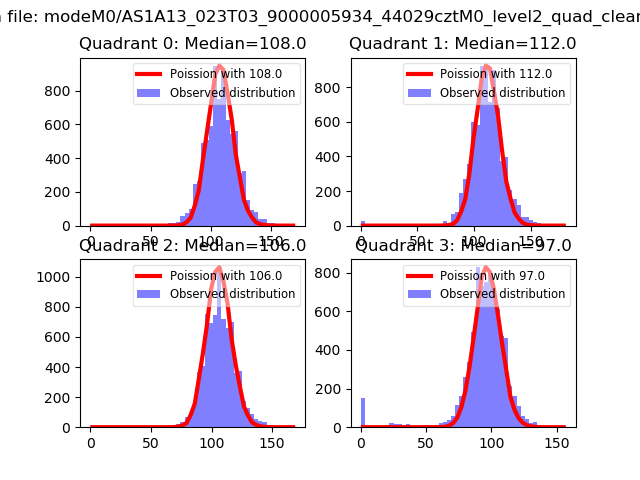 |
 |
| Quadrant-wise count rates Data is divided into 100 sec bins |
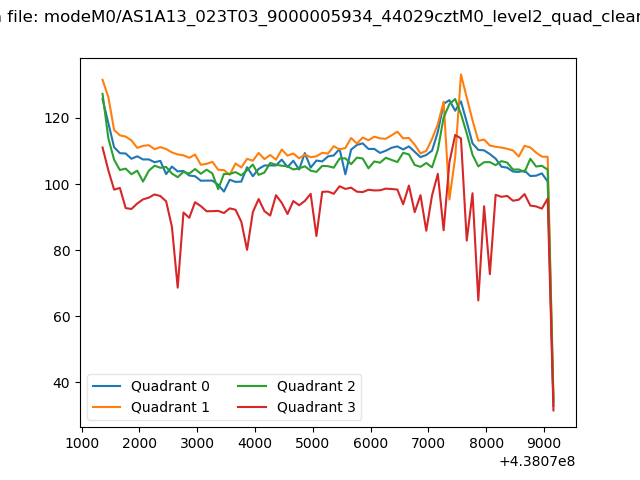 |
|
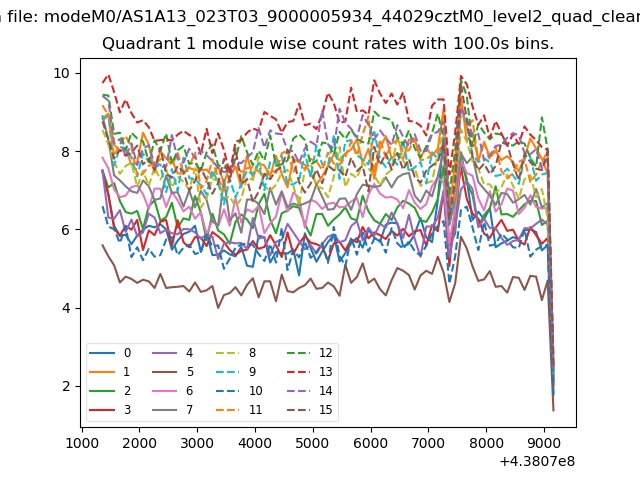
| Module-wise count rates for Quadrant A Data is divided into 100 sec bins |
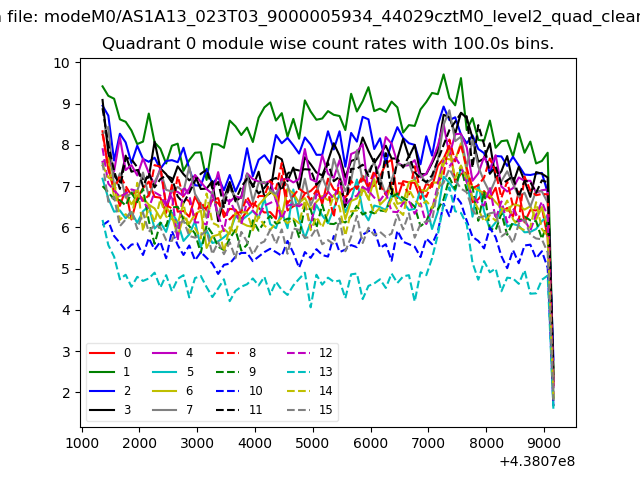 |
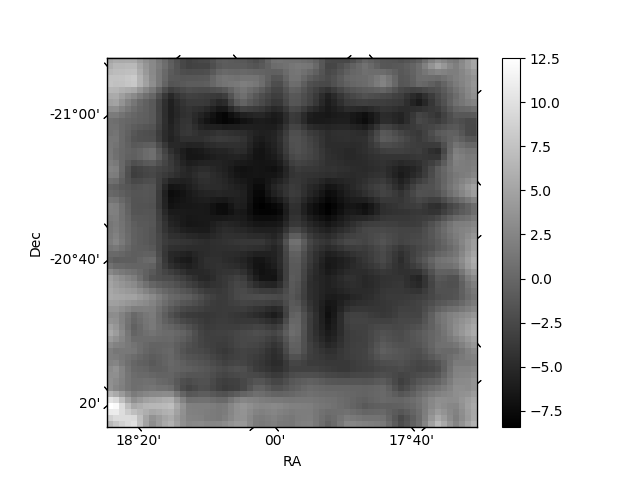 |
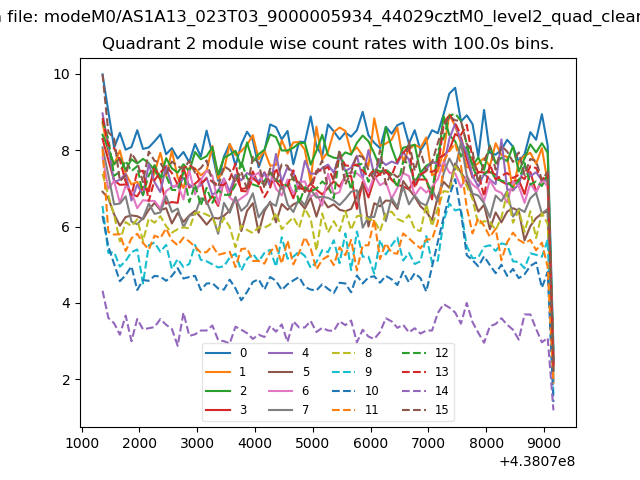
| Module-wise count rates for Quadrant B Data is divided into 100 sec bins |
 |
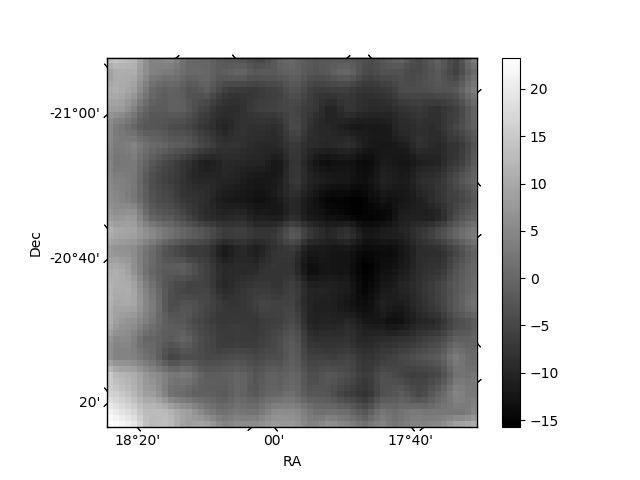 |
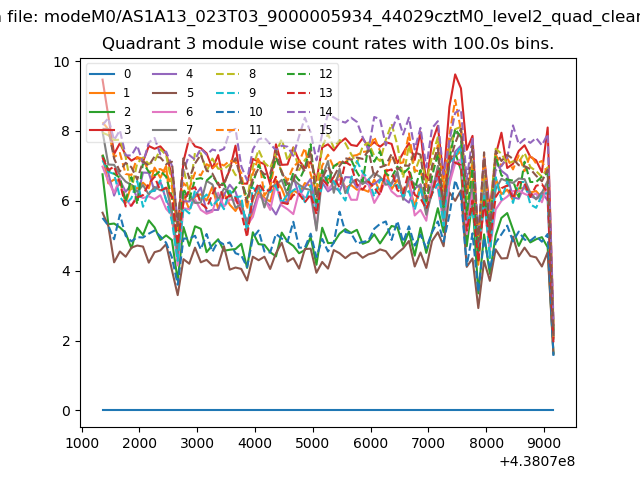
| Module-wise count rates for Quadrant C Data is divided into 100 sec bins |
 |
 |
| Module-wise count rates for Quadrant D Data is divided into 100 sec bins |
 |
 |
| Parameter | Plot |
|---|---|
| CZT HV Monitor |  |
| D_VDD | 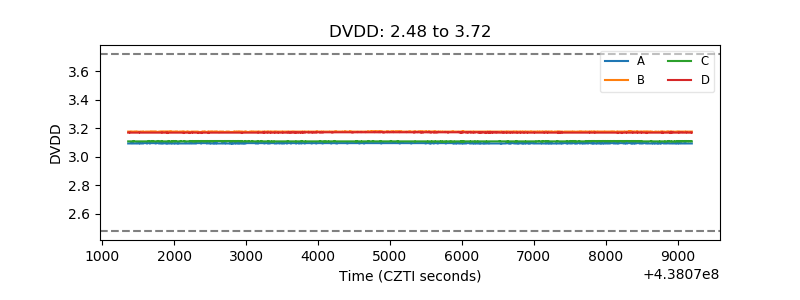 |
| Temperature 1 | 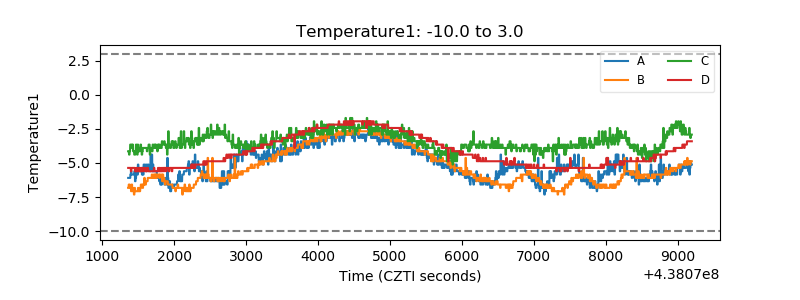 |
| Veto HV Monitor | 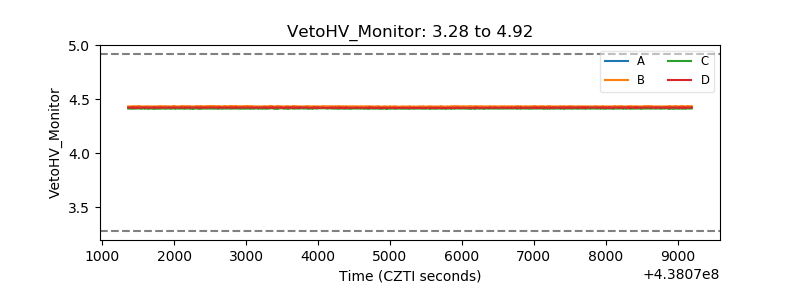 |
| Veto LLD | 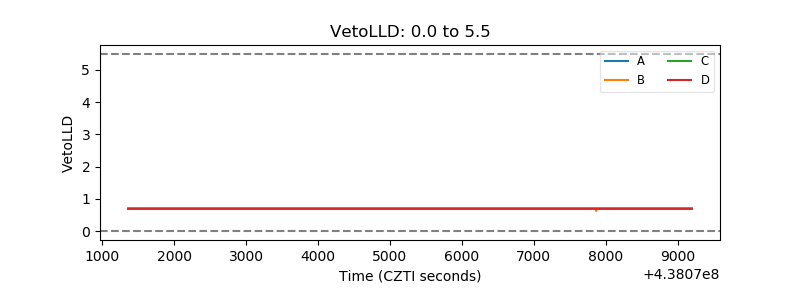 |
| Alpha Counter | 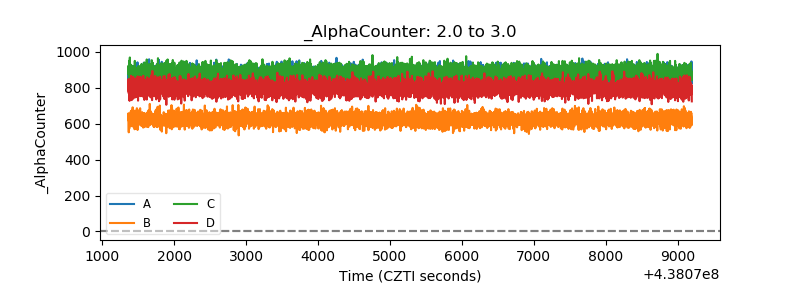 |
| _CPM_Rate | 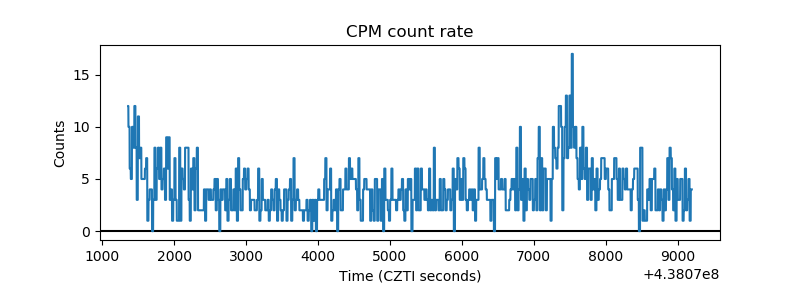 |
| CZT Counter | 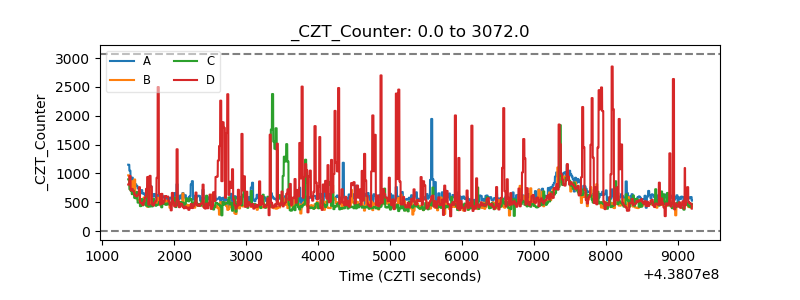 |
| +2.5 Volts monitor | 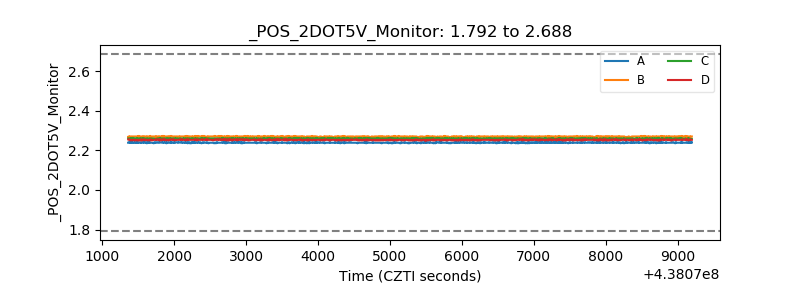 |
| +5 Volts monitor | 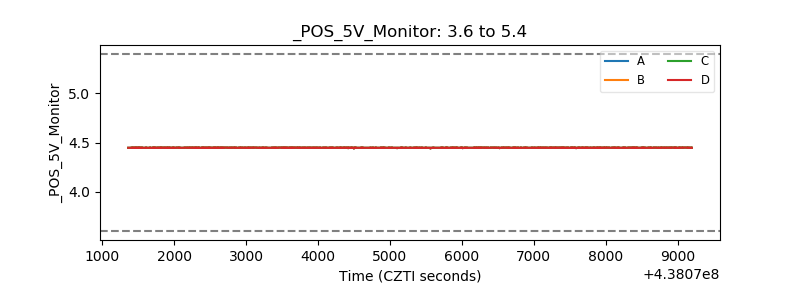 |
| _ROLL_ROT | 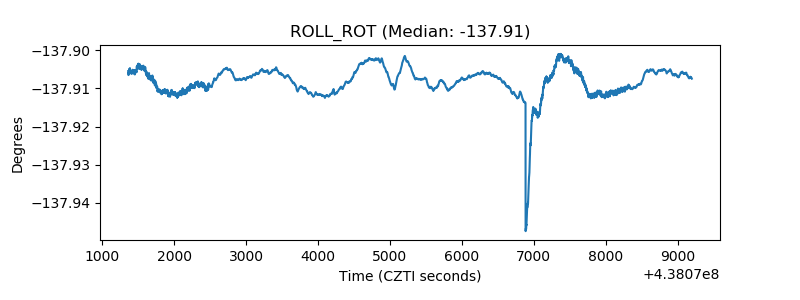 |
| _Roll_DEC | 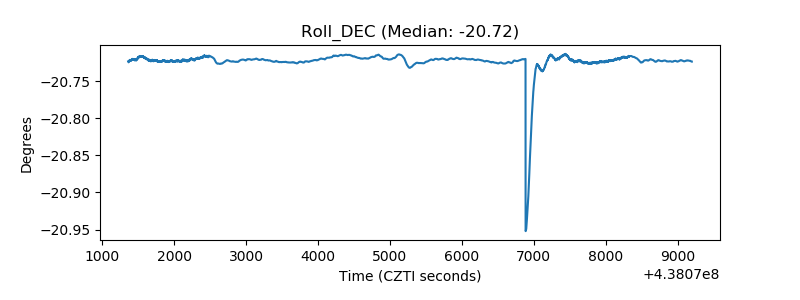 |
| _Roll_RA | 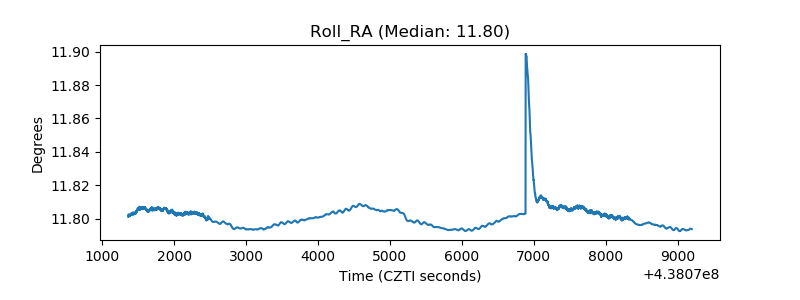 |
| Veto Counter | 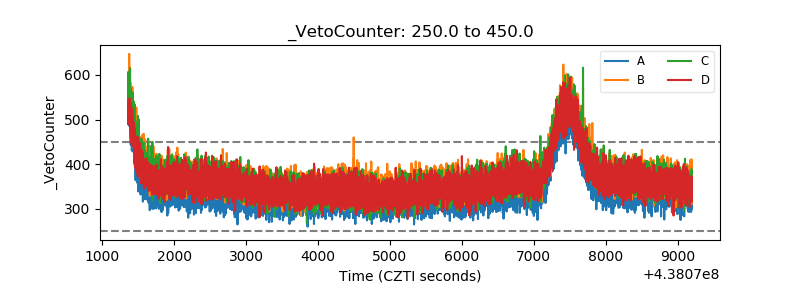 |