| Param | Original file | Final file |
|---|---|---|
| Filename | modeM0/AS1A13_023T03_9000005934_44030cztM0_level2.fits | modeM0/AS1A13_023T03_9000005934_44030cztM0_level2_quad_clean.evt |
| Size (bytes) | 565,355,520 | 126,881,280 |
| Size | 539.2 MB | 121.0 MB |
| Events in quadrant A | 4,908,090 | 861,004 |
| Events in quadrant B | 4,043,030 | 885,648 |
| Events in quadrant C | 4,068,191 | 853,952 |
| Events in quadrant D | 7,286,281 | 684,326 |
| Mode SS | |||
|---|---|---|---|
| Quadrant | BADHDUFLAG | Total packets | Discarded packets |
| A | 0 | 160 | 0 |
| B | 0 | 160 | 0 |
| C | 0 | 160 | 0 |
| D | 0 | 160 | 0 |
| Mode M0 | |||
|---|---|---|---|
| Quadrant | BADHDUFLAG | Total packets | Discarded packets |
| A | 0 | 19761 | 0 |
| B | 0 | 17397 | 3 |
| C | 0 | 17702 | 0 |
| D | 0 | 27000 | 0 |
| Quadrant | Total seconds | Saturated seconds | Saturation percentage |
|---|---|---|---|
| A | 8012 | 105 | 1.310534% |
| B | 8010 | 177 | 2.209738% |
| C | 8012 | 80 | 0.998502% |
| D | 8013 | 1085 | 13.540497% |
Noise dominated data is calculated using 1-second bins in cleaned event files. If a bin has >2000 counts, and if more than 50% of those come from <1% of pixels, then it is considered to be noise-dominated and hence unusable.
| Quadrant | # 1 sec bins | Bins with >0 counts | Bins with >2000 counts | High rate bins dominated by noise | Noise dominated (total time) | Noise dominated (detector-on time) | Marked lightcurve |
|---|---|---|---|---|---|---|---|
| A | 8012 | 8012 | 1 | 1 | 0.01% | 0.01% |  |
| B | 8012 | 8011 | 14 | 14 | 0.17% | 0.17% |  |
| C | 8012 | 8012 | 23 | 23 | 0.29% | 0.29% |  |
| D | 8013 | 8012 | 816 | 816 | 10.18% | 10.18% | 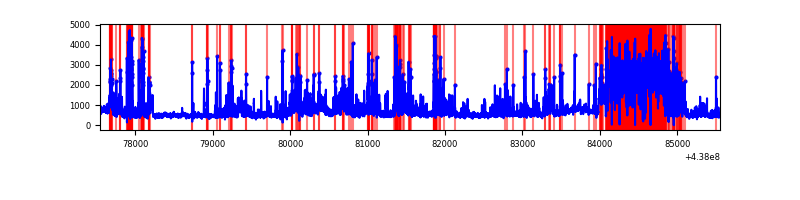 |
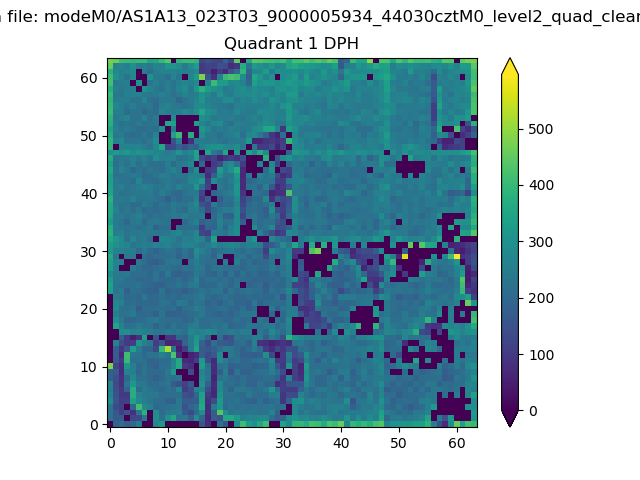
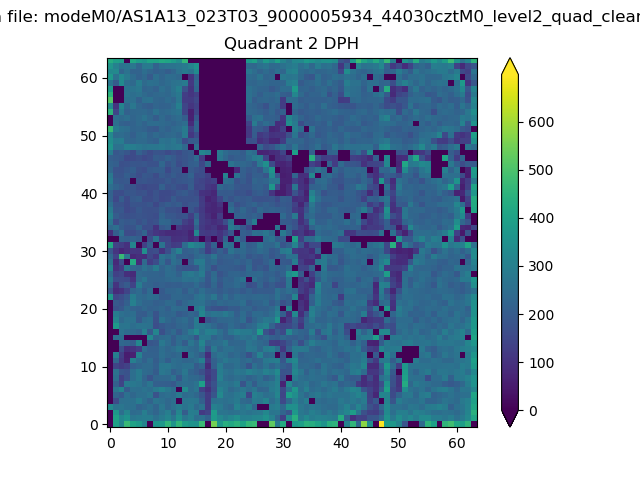
Top three noisy pixels from each quadrant. If the there are fewer than three noisy pixels in the level2.evt file, extra rows are filled as -1
| Pixel properties | Quadrant properties | ||||||
|---|---|---|---|---|---|---|---|
| Quadrant | DetID | PixID | Counts | Sigma | Mean | Median | Sigma |
| A | 10 | 83 | 1180789 | 5975.13 | 937 | 916 | 197.5 |
| A | 14 | 238 | 50178 | 249.47 | 937 | 916 | 197.5 |
| A | 10 | 248 | 35540 | 175.34 | 937 | 916 | 197.5 |
| B | 0 | 213 | 120874 | 637.56 | 937 | 905 | 188.2 |
| B | 7 | 221 | 110500 | 582.43 | 937 | 905 | 188.2 |
| B | 4 | 170 | 38999 | 202.44 | 937 | 905 | 188.2 |
| C | 14 | 254 | 162463 | 734.95 | 923 | 926 | 219.8 |
| C | 15 | 158 | 145724 | 658.79 | 923 | 926 | 219.8 |
| C | 3 | 233 | 76125 | 342.13 | 923 | 926 | 219.8 |
| D | 5 | 235 | 1717031 | 7848.3 | 851 | 822 | 218.7 |
| D | 13 | 249 | 607306 | 2773.48 | 851 | 822 | 218.7 |
| D | 1 | 52 | 360153 | 1643.24 | 851 | 822 | 218.7 |
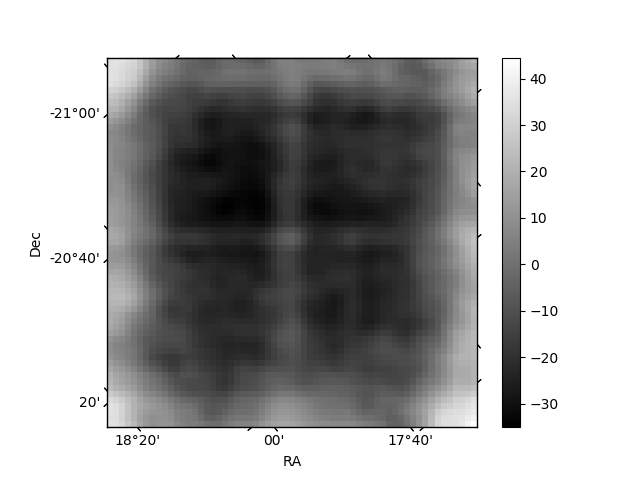
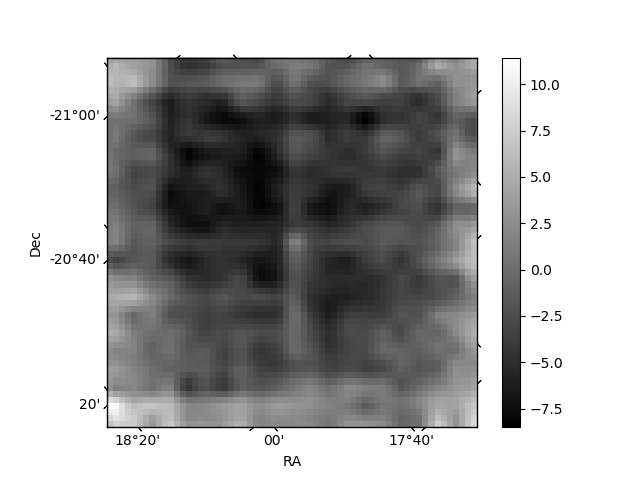
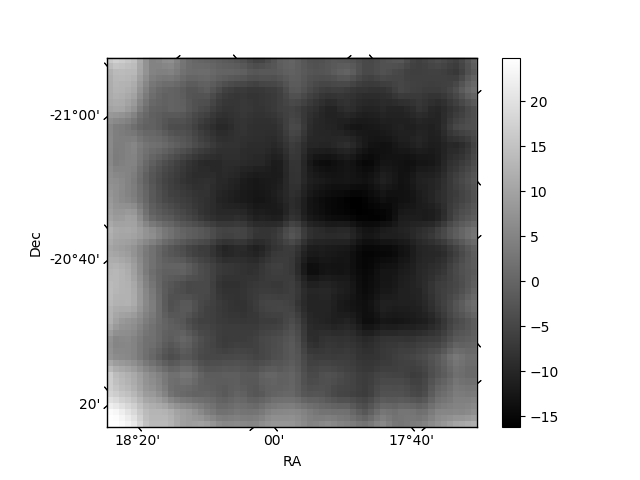
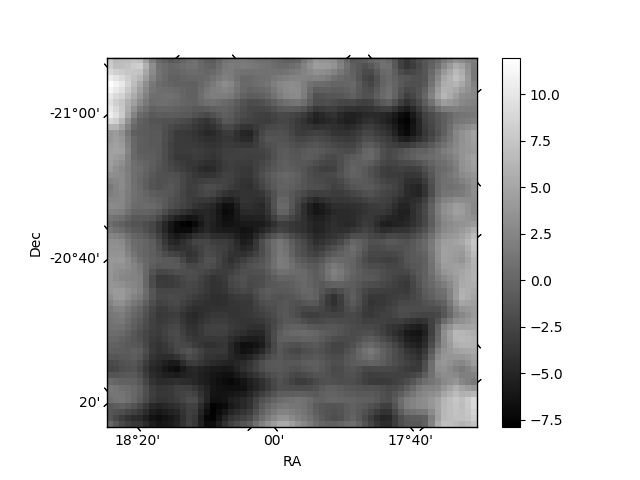
Histogram calculated using DETX and DETY for each event in the final _common_clean file
| Quadrant A | 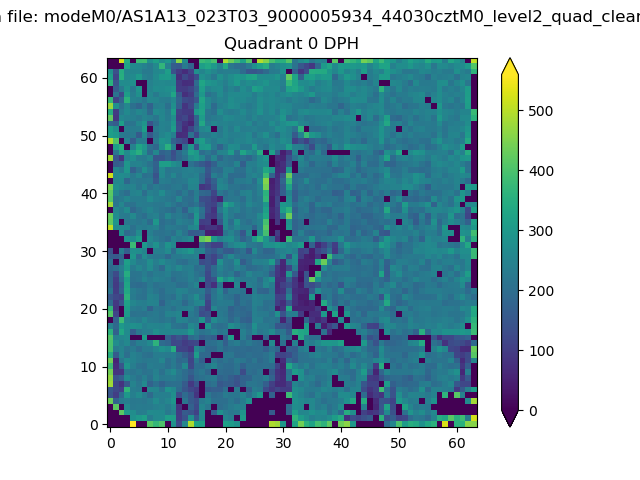 |
 |
Quadrant B |
|---|---|---|---|
| Quadrant D | 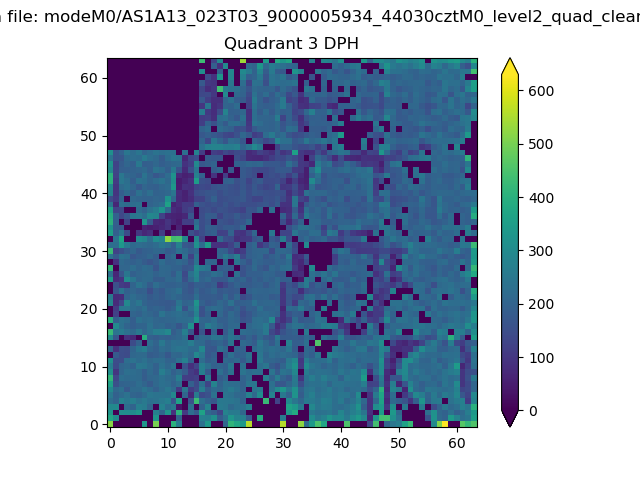 |
 |
Quadrant C |
| Plot type | Count rate plots | Images |
|---|---|---|
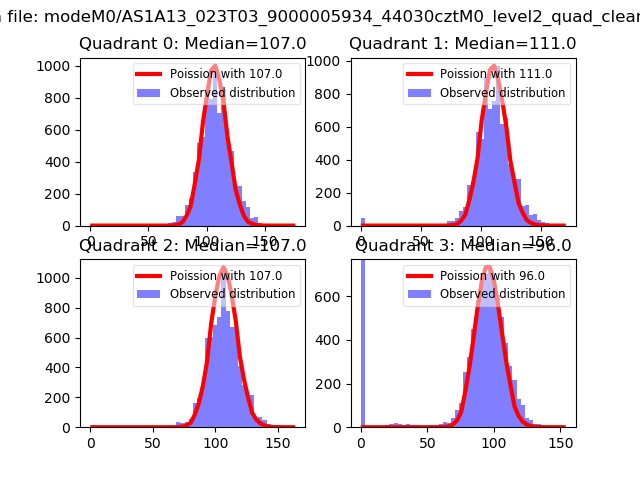
| Comparison with Poisson distribution Blue bars denote a histogram of data divided into 1 sec bins. Red curve is a Poisson curve with rate = median count rate of data. |
 |
 |
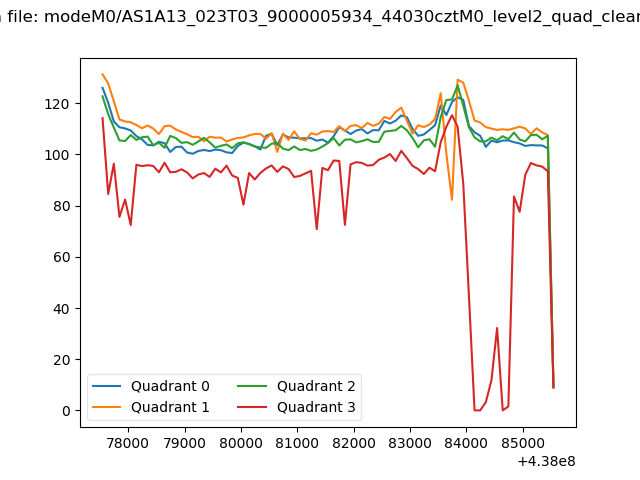
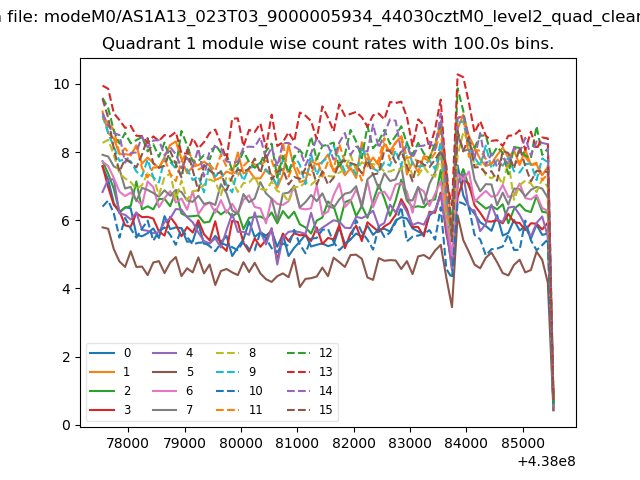
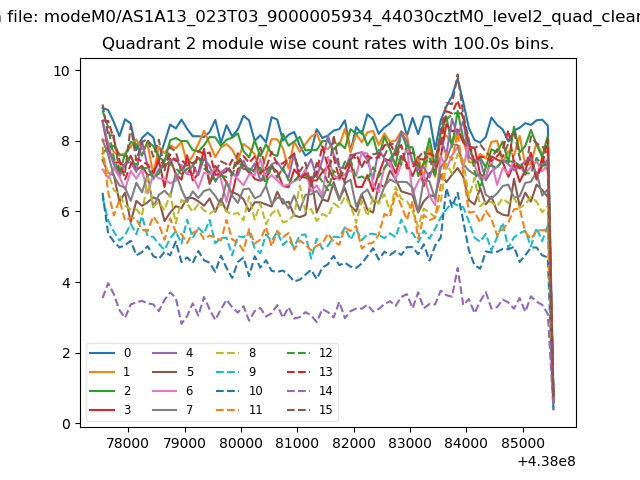
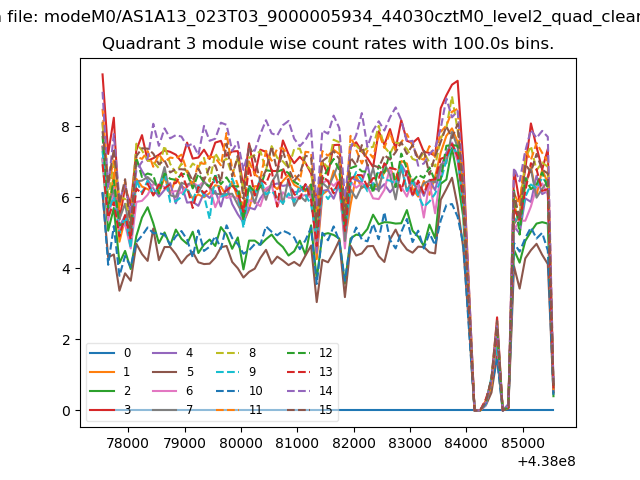
| Quadrant-wise count rates Data is divided into 100 sec bins |
 |
|
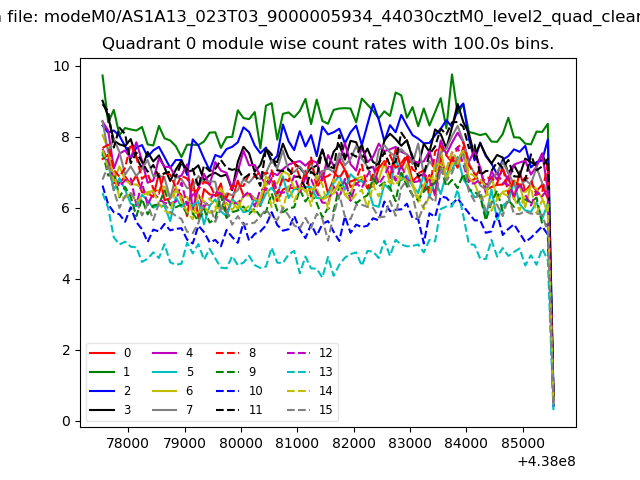
| Module-wise count rates for Quadrant A Data is divided into 100 sec bins |
 |
 |
| Module-wise count rates for Quadrant B Data is divided into 100 sec bins |
 |
 |
| Module-wise count rates for Quadrant C Data is divided into 100 sec bins |
 |
 |
| Module-wise count rates for Quadrant D Data is divided into 100 sec bins |
 |
 |
| Parameter | Plot |
|---|---|
| CZT HV Monitor | 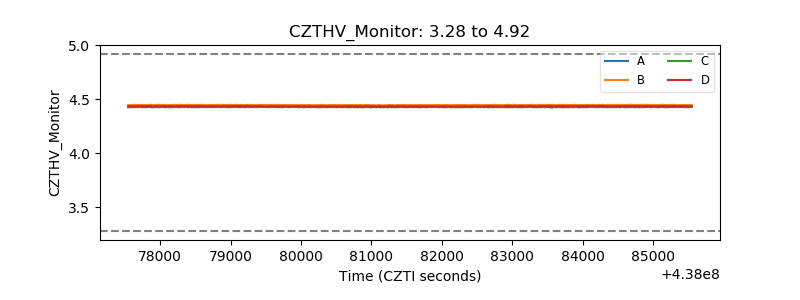 |
| D_VDD | 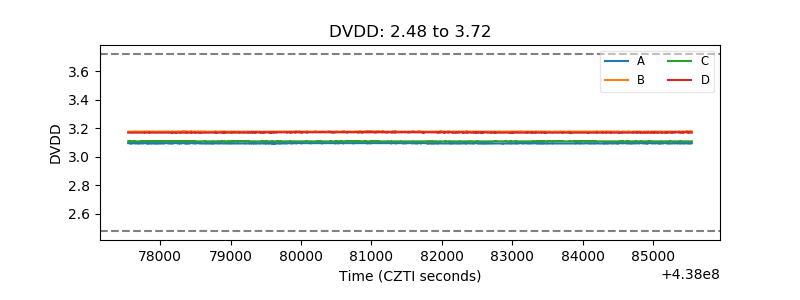 |
| Temperature 1 | 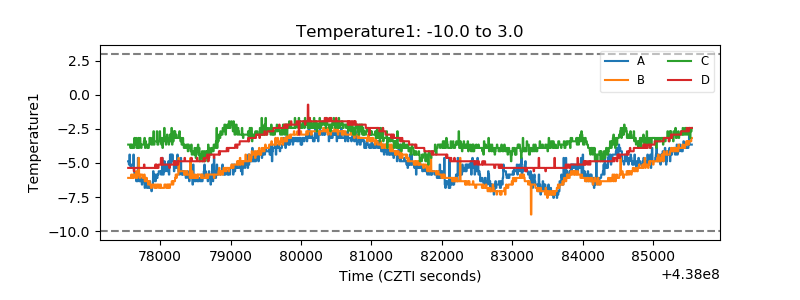 |
| Veto HV Monitor | 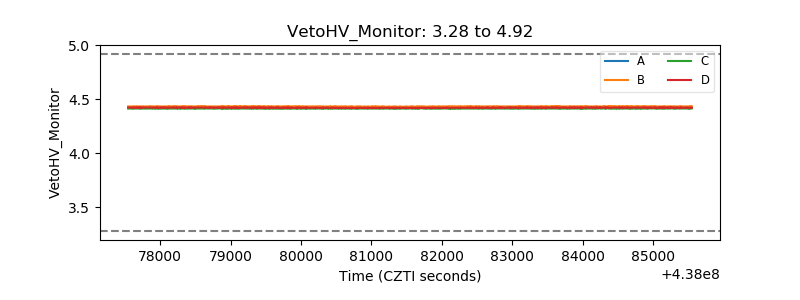 |
| Veto LLD | 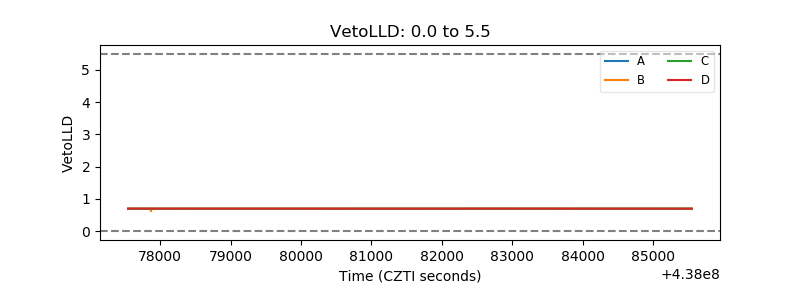 |
| Alpha Counter | 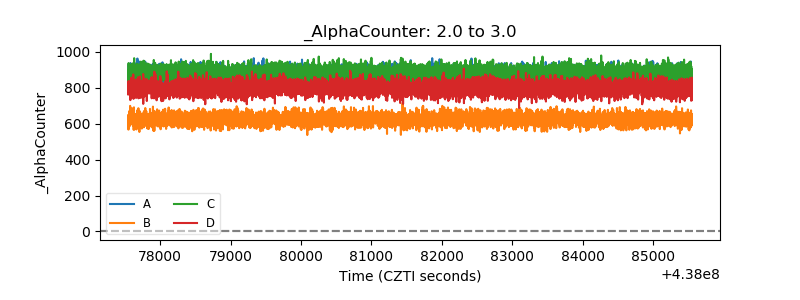 |
| _CPM_Rate | 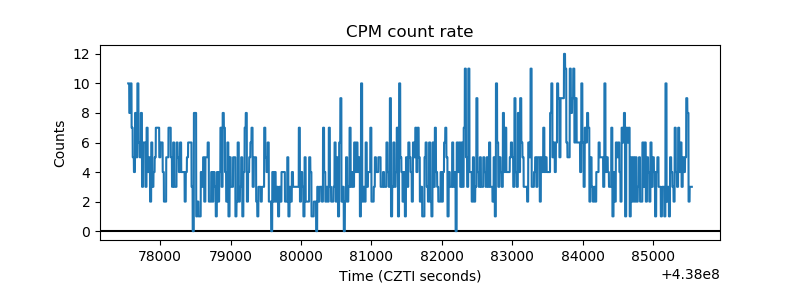 |
| CZT Counter | 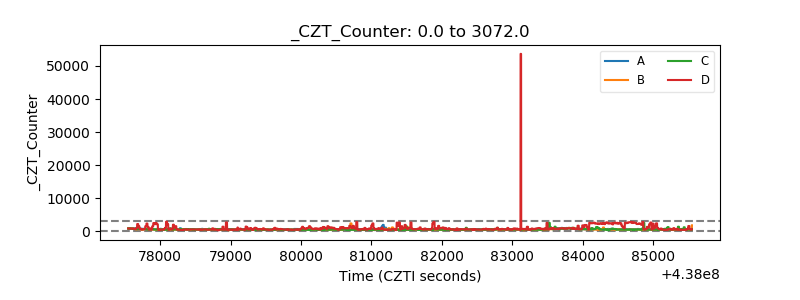 |
| +2.5 Volts monitor |  |
| +5 Volts monitor | 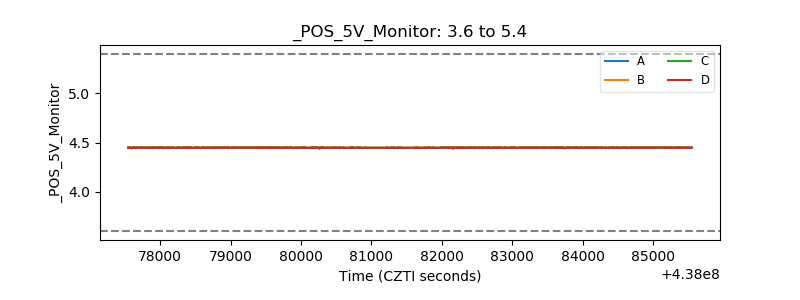 |
| _ROLL_ROT | 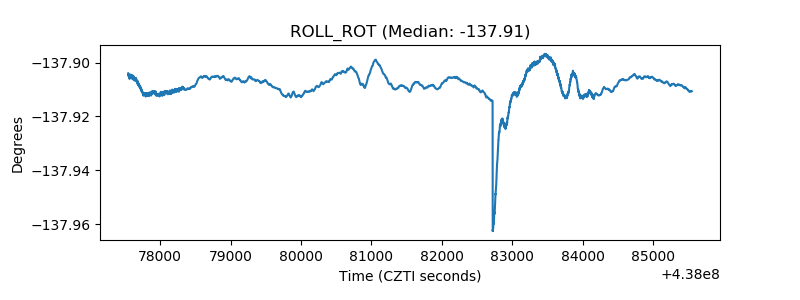 |
| _Roll_DEC | 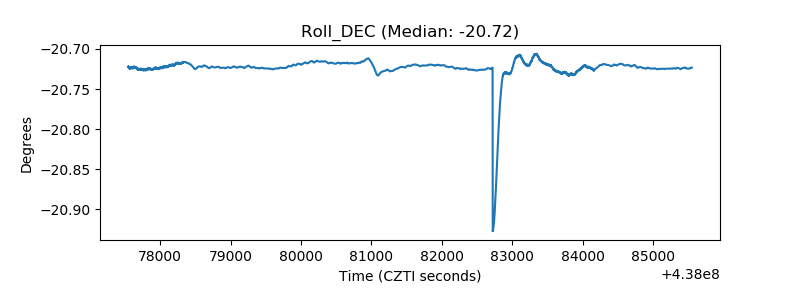 |
| _Roll_RA | 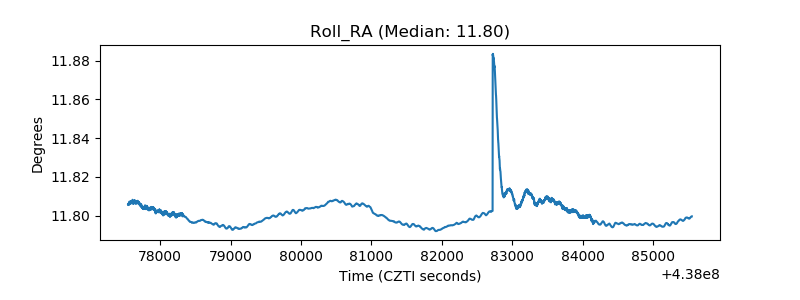 |
| Veto Counter | 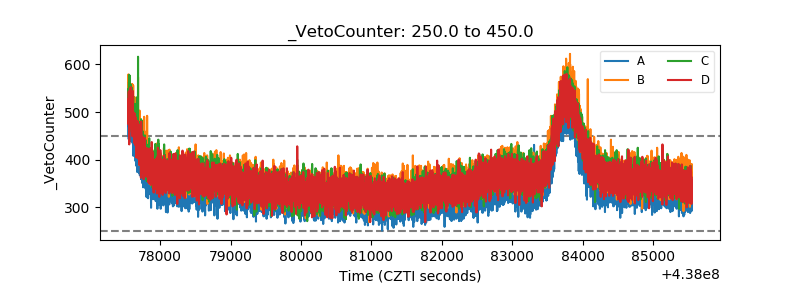 |