| Param | Original file | Final file |
|---|---|---|
| Filename | modeM0/AS1A13_023T03_9000005934_44033cztM0_level2.fits | modeM0/AS1A13_023T03_9000005934_44033cztM0_level2_quad_clean.evt |
| Size (bytes) | 278,527,680 | 53,835,840 |
| Size | 265.6 MB | 51.3 MB |
| Events in quadrant A | 2,119,925 | 371,637 |
| Events in quadrant B | 1,737,626 | 387,066 |
| Events in quadrant C | 1,818,097 | 371,459 |
| Events in quadrant D | 4,357,562 | 249,330 |
| Mode SS | |||
|---|---|---|---|
| Quadrant | BADHDUFLAG | Total packets | Discarded packets |
| A | 0 | 70 | 0 |
| B | 0 | 70 | 0 |
| C | 0 | 70 | 0 |
| D | 0 | 70 | 0 |
| Mode M0 | |||
|---|---|---|---|
| Quadrant | BADHDUFLAG | Total packets | Discarded packets |
| A | 0 | 8660 | 0 |
| B | 0 | 7596 | 0 |
| C | 0 | 7943 | 0 |
| D | 0 | 15346 | 0 |
| Quadrant | Total seconds | Saturated seconds | Saturation percentage |
|---|---|---|---|
| A | 3540 | 19 | 0.536723% |
| B | 3540 | 18 | 0.508475% |
| C | 3540 | 21 | 0.593220% |
| D | 3541 | 1009 | 28.494775% |
Noise dominated data is calculated using 1-second bins in cleaned event files. If a bin has >2000 counts, and if more than 50% of those come from <1% of pixels, then it is considered to be noise-dominated and hence unusable.
| Quadrant | # 1 sec bins | Bins with >0 counts | Bins with >2000 counts | High rate bins dominated by noise | Noise dominated (total time) | Noise dominated (detector-on time) | Marked lightcurve |
|---|---|---|---|---|---|---|---|
| A | 3540 | 3540 | 0 | 0 | 0.00% | 0.00% | 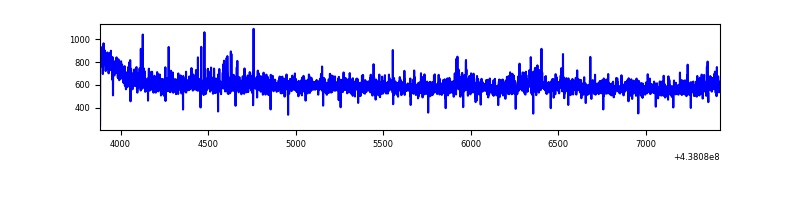 |
| B | 3540 | 3540 | 3 | 3 | 0.08% | 0.08% | 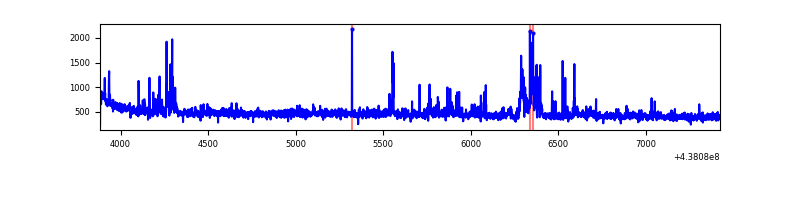 |
| C | 3540 | 3540 | 15 | 15 | 0.42% | 0.42% |  |
| D | 3541 | 3540 | 797 | 797 | 22.51% | 22.51% |  |
Top three noisy pixels from each quadrant. If the there are fewer than three noisy pixels in the level2.evt file, extra rows are filled as -1
| Pixel properties | Quadrant properties | ||||||
|---|---|---|---|---|---|---|---|
| Quadrant | DetID | PixID | Counts | Sigma | Mean | Median | Sigma |
| A | 10 | 83 | 551885 | 6524.77 | 397 | 389 | 84.5 |
| A | 14 | 238 | 23468 | 273.04 | 397 | 389 | 84.5 |
| A | 14 | 254 | 5620 | 61.88 | 397 | 389 | 84.5 |
| B | 0 | 213 | 72751 | 903.92 | 394 | 382 | 80.1 |
| B | 7 | 221 | 63528 | 788.72 | 394 | 382 | 80.1 |
| B | 4 | 171 | 36165 | 446.95 | 394 | 382 | 80.1 |
| C | 15 | 158 | 126993 | 1376.56 | 384 | 386 | 92.0 |
| C | 14 | 254 | 96015 | 1039.74 | 384 | 386 | 92.0 |
| C | 3 | 233 | 46180 | 497.9 | 384 | 386 | 92.0 |
| D | 5 | 235 | 1697207 | 20396.73 | 320 | 309 | 83.2 |
| D | 1 | 52 | 380607 | 4571.19 | 320 | 309 | 83.2 |
| D | 13 | 171 | 363808 | 4369.26 | 320 | 309 | 83.2 |
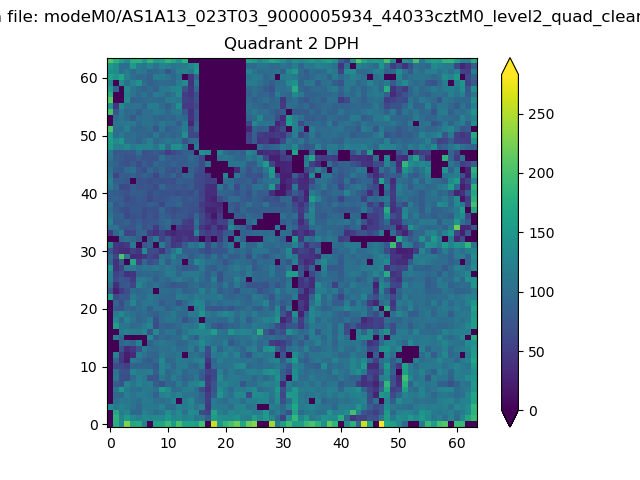
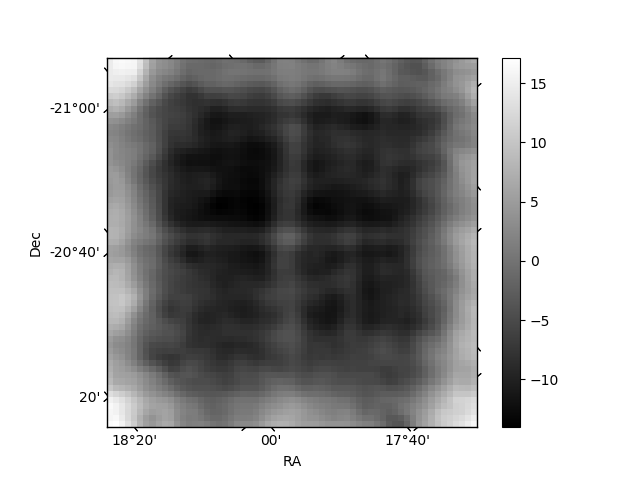
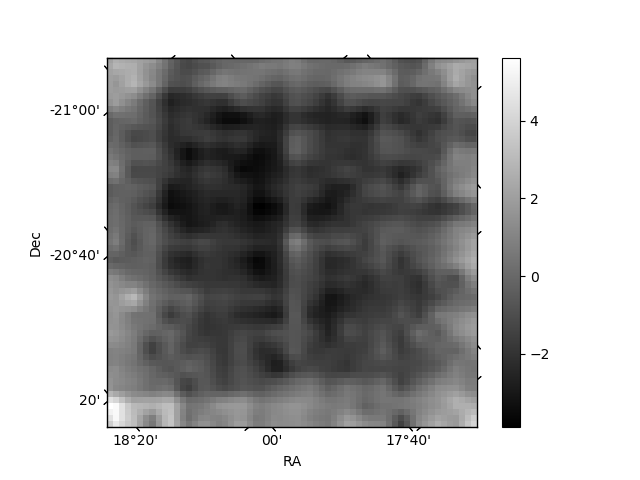
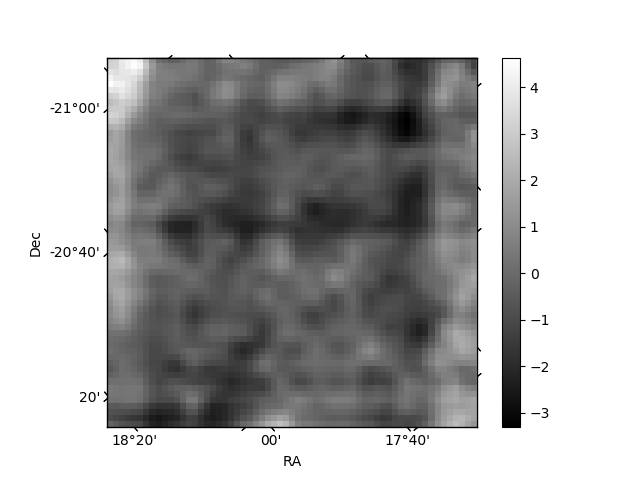
Histogram calculated using DETX and DETY for each event in the final _common_clean file
| Quadrant A | 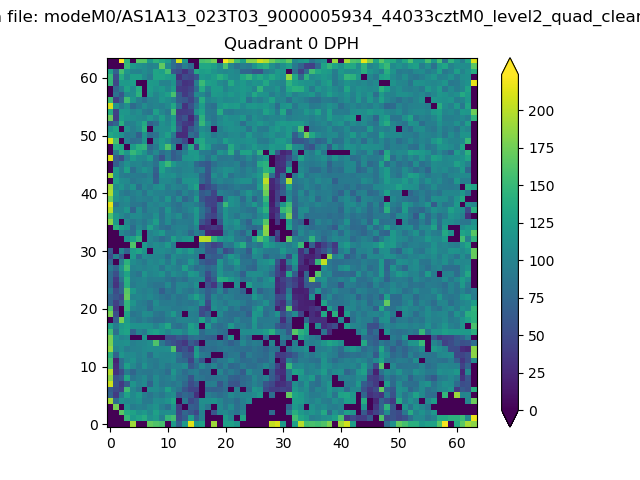 |
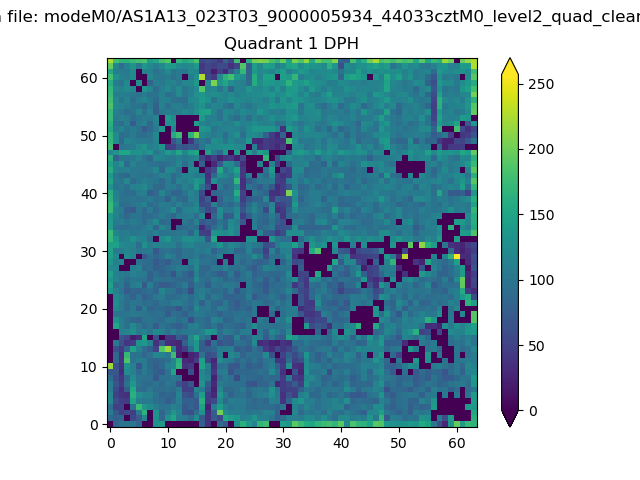 |
Quadrant B |
|---|---|---|---|
| Quadrant D | 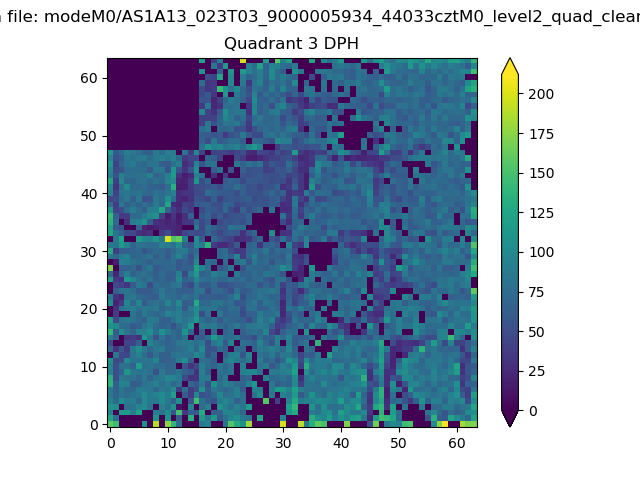 |
 |
Quadrant C |
| Plot type | Count rate plots | Images |
|---|---|---|
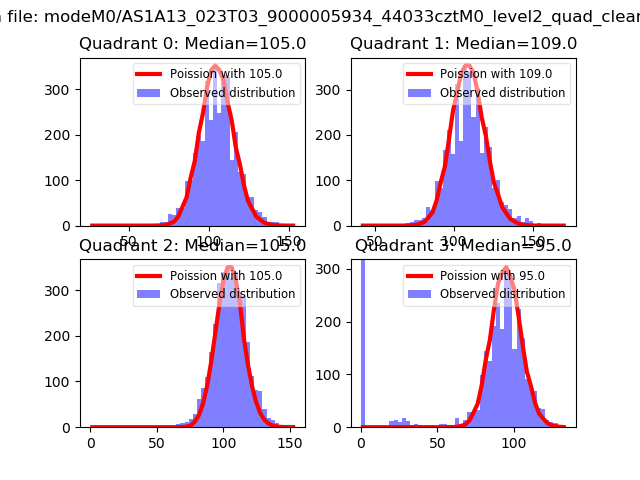
| Comparison with Poisson distribution Blue bars denote a histogram of data divided into 1 sec bins. Red curve is a Poisson curve with rate = median count rate of data. |
 |
 |
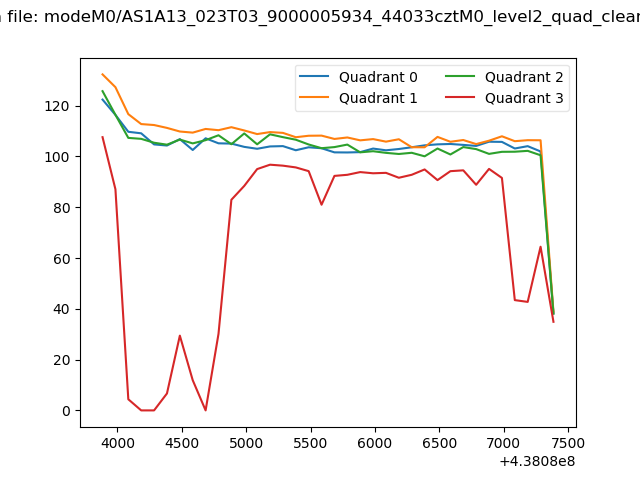
| Quadrant-wise count rates Data is divided into 100 sec bins |
 |
|
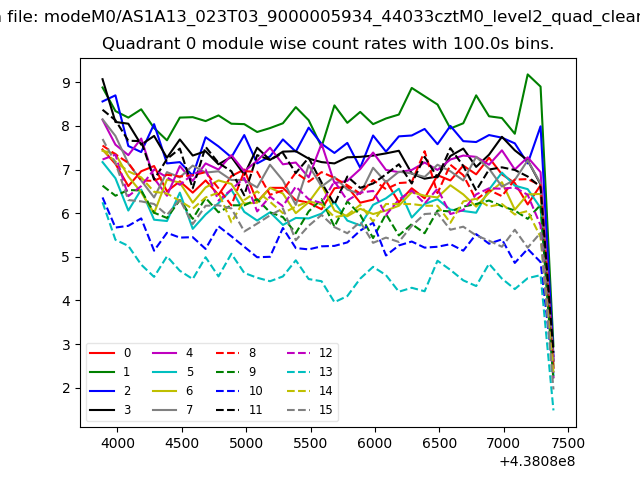
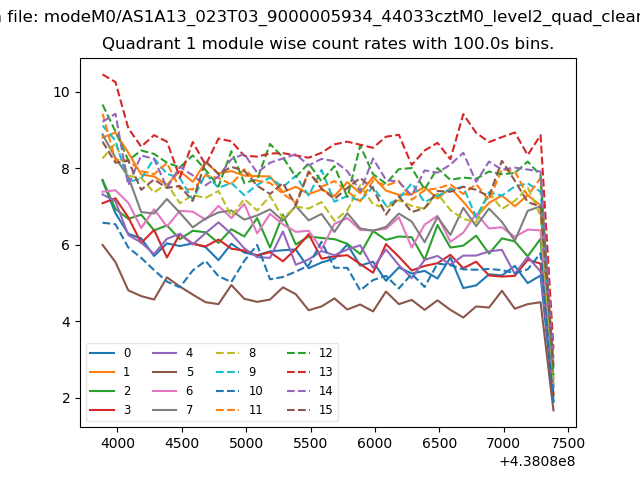
| Module-wise count rates for Quadrant A Data is divided into 100 sec bins |
 |
 |
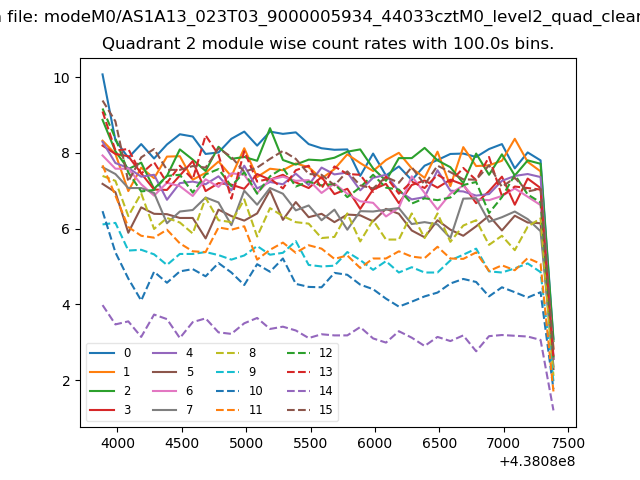
| Module-wise count rates for Quadrant B Data is divided into 100 sec bins |
 |
 |
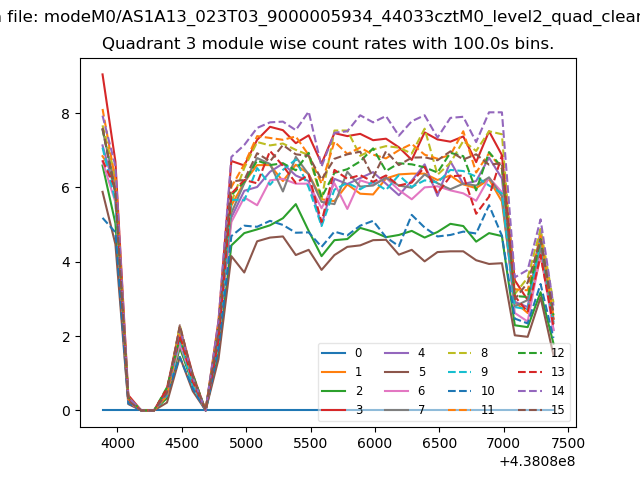
| Module-wise count rates for Quadrant C Data is divided into 100 sec bins |
 |
 |
| Module-wise count rates for Quadrant D Data is divided into 100 sec bins |
 |
 |
| Parameter | Plot |
|---|---|
| CZT HV Monitor | 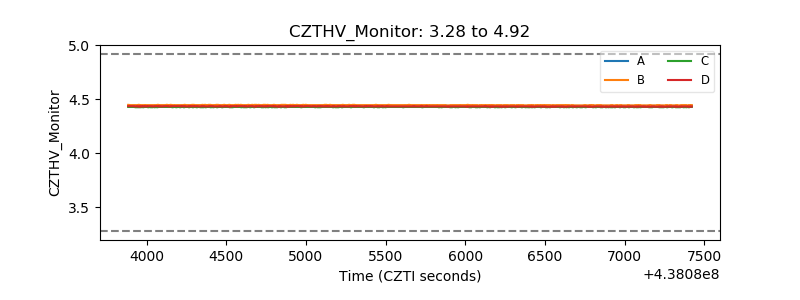 |
| D_VDD | 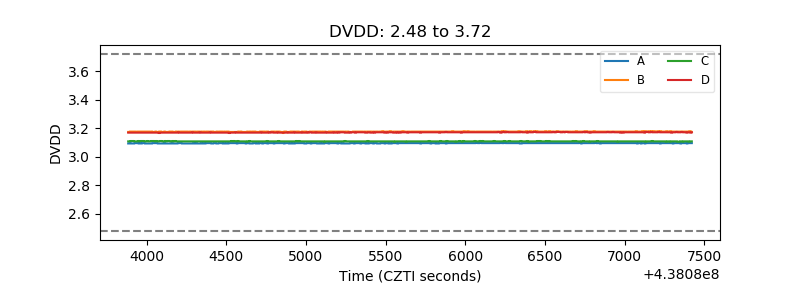 |
| Temperature 1 | 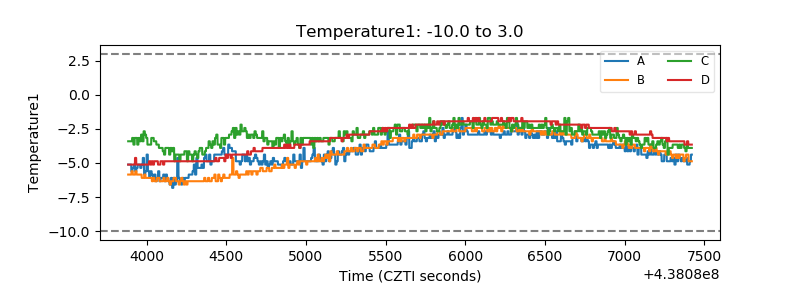 |
| Veto HV Monitor | 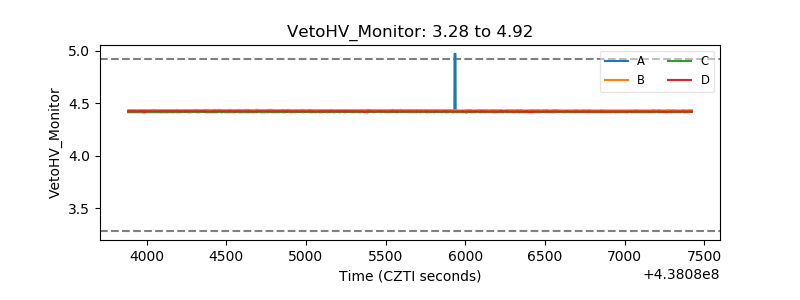 |
| Veto LLD | 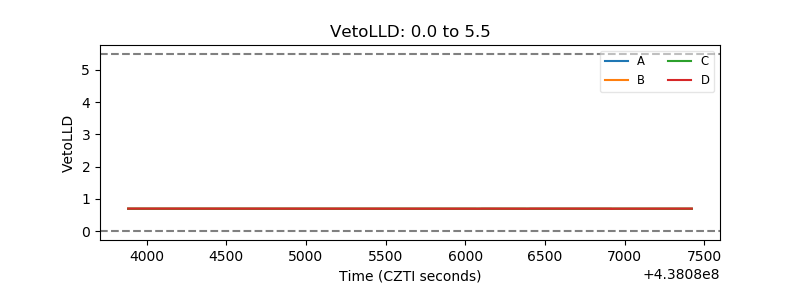 |
| Alpha Counter | 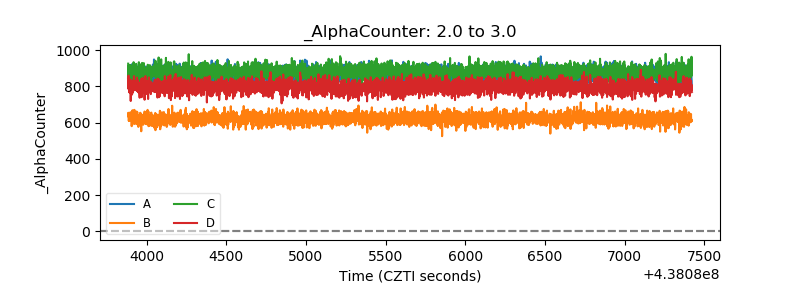 |
| _CPM_Rate | 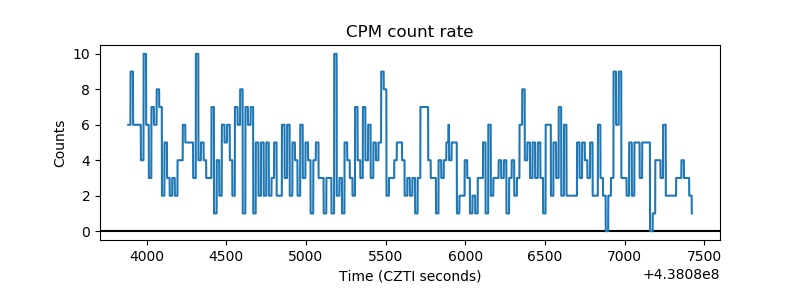 |
| CZT Counter | 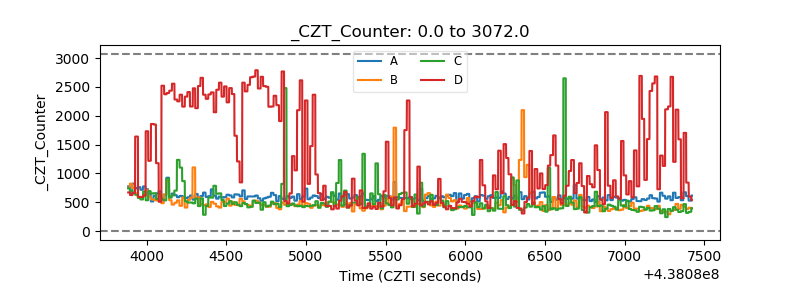 |
| +2.5 Volts monitor | 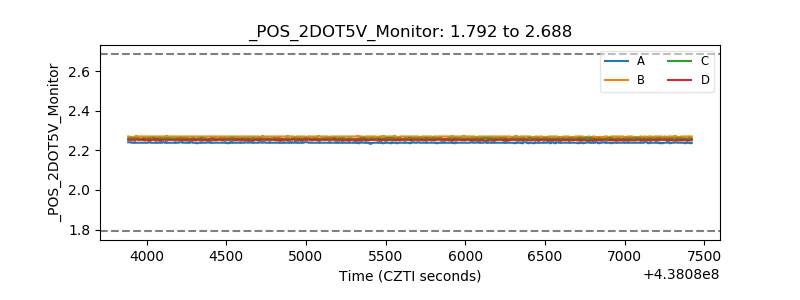 |
| +5 Volts monitor | 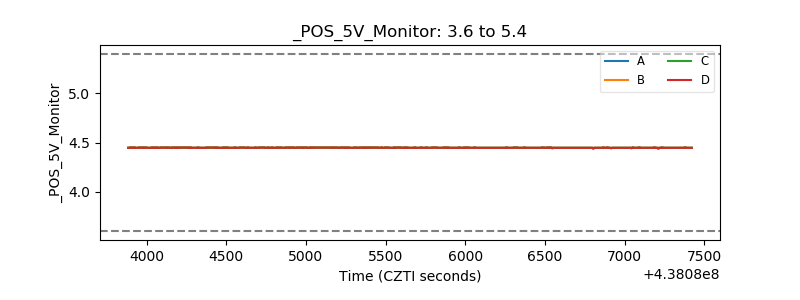 |
| _ROLL_ROT | 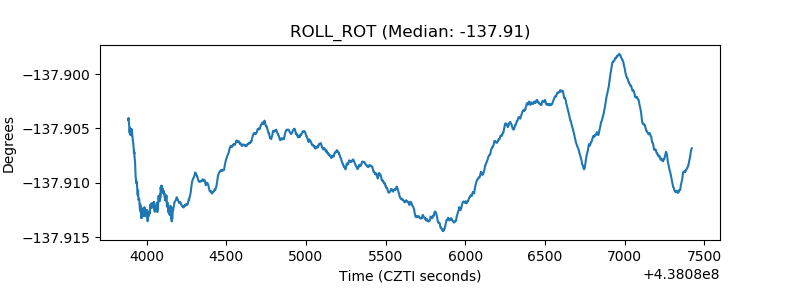 |
| _Roll_DEC | 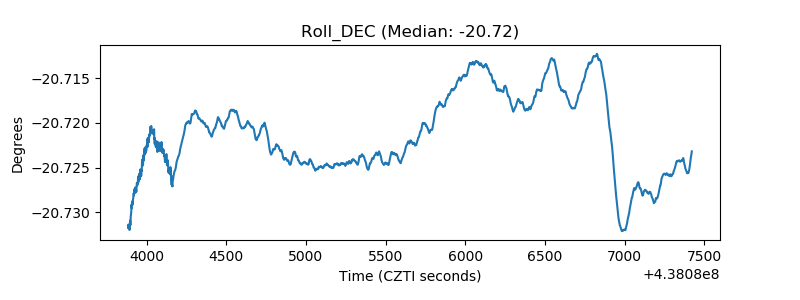 |
| _Roll_RA | 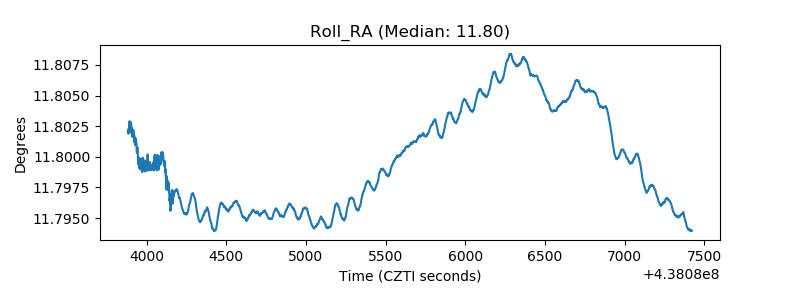 |
| Veto Counter | 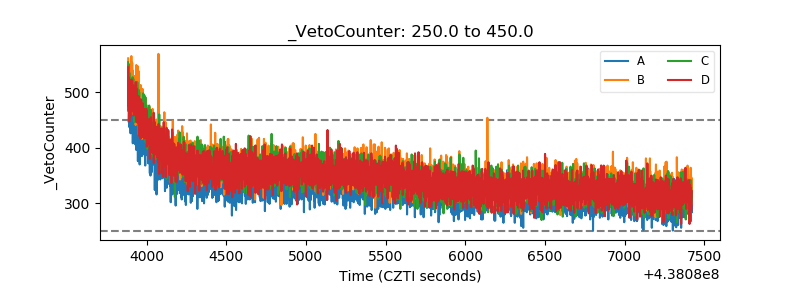 |