| Param | Original file | Final file |
|---|---|---|
| Filename | modeM0/AS1A13_025T01_9000005936_44034cztM0_level2.fits | modeM0/AS1A13_025T01_9000005936_44034cztM0_level2_quad_clean.evt |
| Size (bytes) | 475,608,960 | 104,567,040 |
| Size | 453.6 MB | 99.7 MB |
| Events in quadrant A | 6,104,953 | 652,669 |
| Events in quadrant B | 3,150,505 | 725,965 |
| Events in quadrant C | 3,411,089 | 695,111 |
| Events in quadrant D | 4,430,378 | 635,719 |
| Mode M9 | |||
|---|---|---|---|
| Quadrant | BADHDUFLAG | Total packets | Discarded packets |
| A | 0 | 9 | 0 |
| B | 0 | 9 | 0 |
| C | 0 | 9 | 0 |
| D | 0 | 9 | 0 |
| Mode M0 | |||
|---|---|---|---|
| Quadrant | BADHDUFLAG | Total packets | Discarded packets |
| A | 0 | 22834 | 1 |
| B | 0 | 13829 | 1 |
| C | 0 | 14356 | 1 |
| D | 0 | 17610 | 1 |
| Mode SS | |||
|---|---|---|---|
| Quadrant | BADHDUFLAG | Total packets | Discarded packets |
| A | 0 | 132 | 0 |
| B | 0 | 132 | 0 |
| C | 0 | 132 | 0 |
| D | 0 | 132 | 0 |
| Quadrant | Total seconds | Saturated seconds | Saturation percentage |
|---|---|---|---|
| A | 6550 | 690 | 10.534351% |
| B | 6550 | 41 | 0.625954% |
| C | 6550 | 71 | 1.083969% |
| D | 6551 | 190 | 2.900321% |
Noise dominated data is calculated using 1-second bins in cleaned event files. If a bin has >2000 counts, and if more than 50% of those come from <1% of pixels, then it is considered to be noise-dominated and hence unusable.
| Quadrant | # 1 sec bins | Bins with >0 counts | Bins with >2000 counts | High rate bins dominated by noise | Noise dominated (total time) | Noise dominated (detector-on time) | Marked lightcurve |
|---|---|---|---|---|---|---|---|
| A | 7445 | 6551 | 299 | 299 | 4.02% | 4.56% | 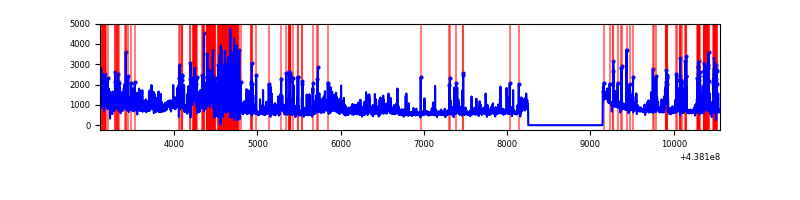 |
| B | 7445 | 6551 | 1 | 1 | 0.01% | 0.02% | 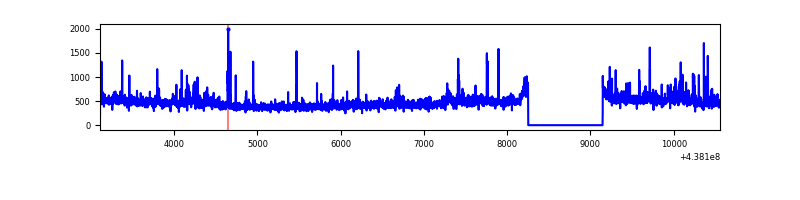 |
| C | 7445 | 6551 | 22 | 22 | 0.30% | 0.34% | 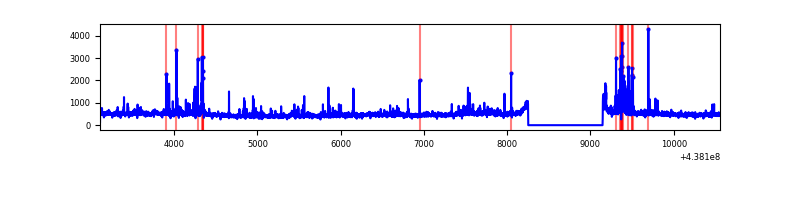 |
| D | 7446 | 6552 | 139 | 139 | 1.87% | 2.12% | 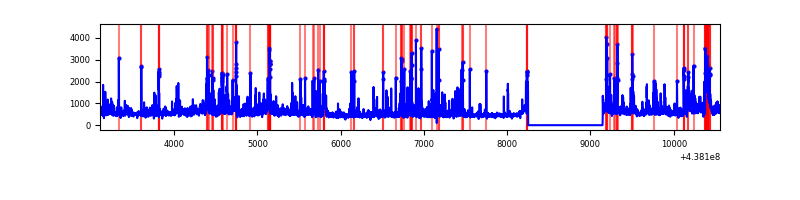 |
Top three noisy pixels from each quadrant. If the there are fewer than three noisy pixels in the level2.evt file, extra rows are filled as -1
| Pixel properties | Quadrant properties | ||||||
|---|---|---|---|---|---|---|---|
| Quadrant | DetID | PixID | Counts | Sigma | Mean | Median | Sigma |
| A | 10 | 83 | 1169797 | 7935.77 | 707 | 691 | 147.3 |
| A | 15 | 223 | 1131872 | 7678.34 | 707 | 691 | 147.3 |
| A | 14 | 238 | 791404 | 5367.28 | 707 | 691 | 147.3 |
| B | 0 | 200 | 78894 | 539.52 | 732 | 710 | 144.9 |
| B | 0 | 213 | 71924 | 491.42 | 732 | 710 | 144.9 |
| B | 0 | 245 | 26346 | 176.9 | 732 | 710 | 144.9 |
| C | 3 | 233 | 277484 | 1629.26 | 722 | 727 | 169.9 |
| C | 14 | 254 | 182950 | 1072.74 | 722 | 727 | 169.9 |
| C | 5 | 250 | 73026 | 425.62 | 722 | 727 | 169.9 |
| D | 1 | 52 | 554966 | 3060.92 | 719 | 699 | 181.1 |
| D | 5 | 235 | 273129 | 1504.48 | 719 | 699 | 181.1 |
| D | 2 | 249 | 174238 | 958.36 | 719 | 699 | 181.1 |
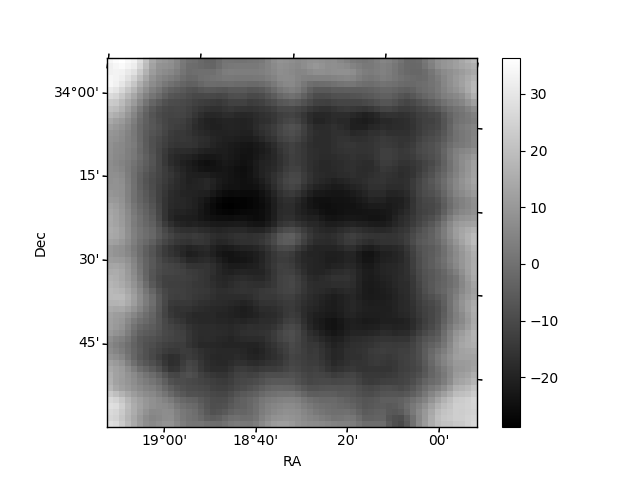
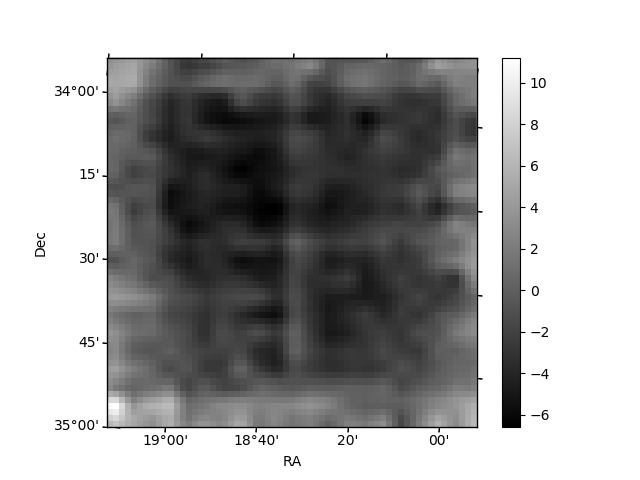
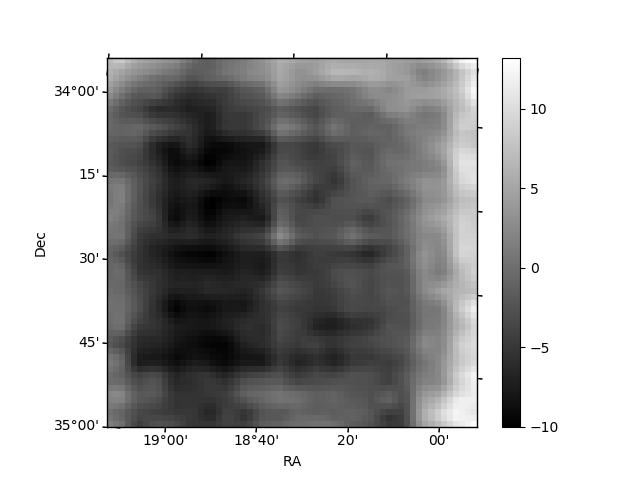
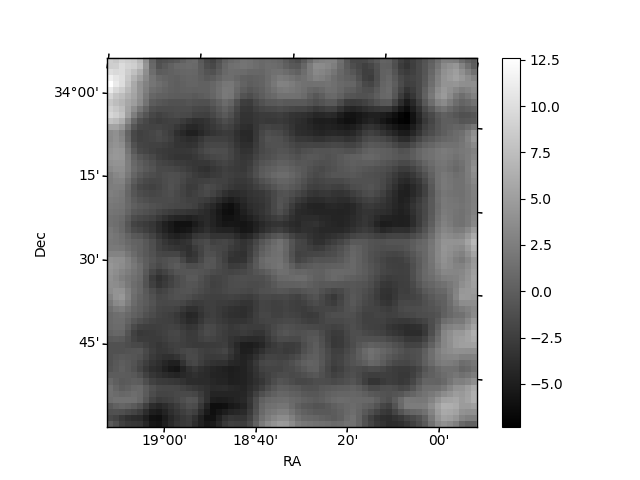
Histogram calculated using DETX and DETY for each event in the final _common_clean file
| Quadrant A | 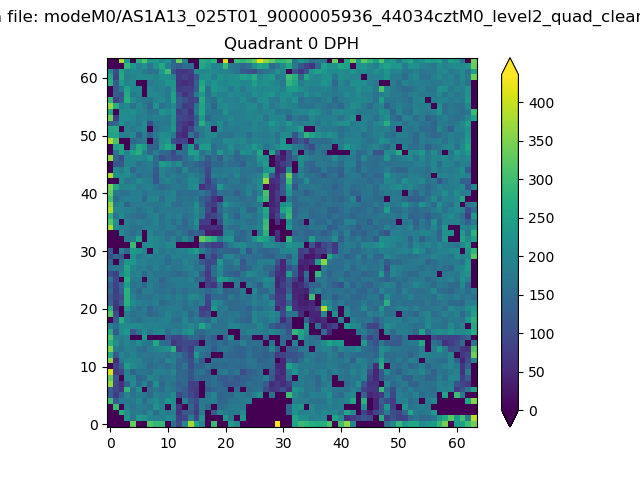 |
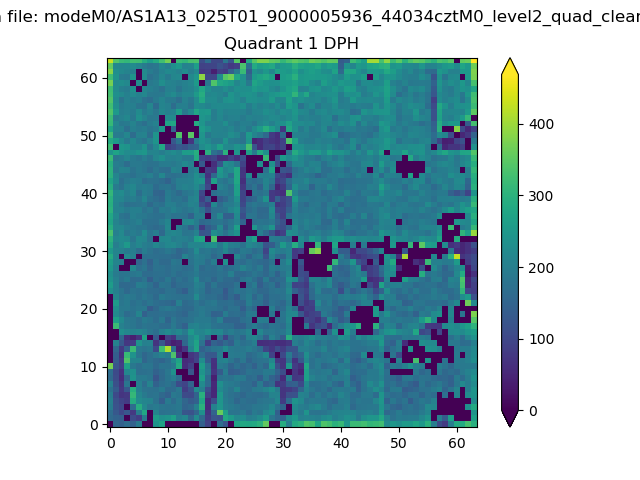 |
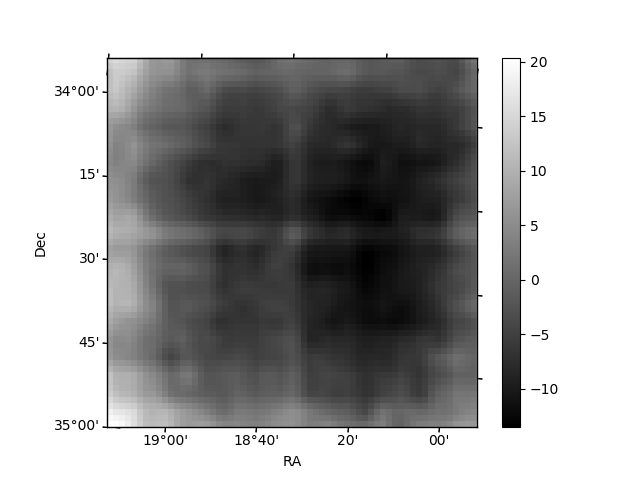
Quadrant B |
|---|---|---|---|
| Quadrant D | 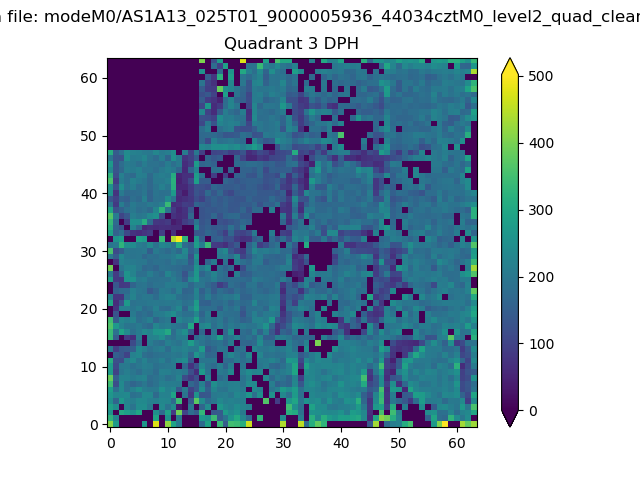 |
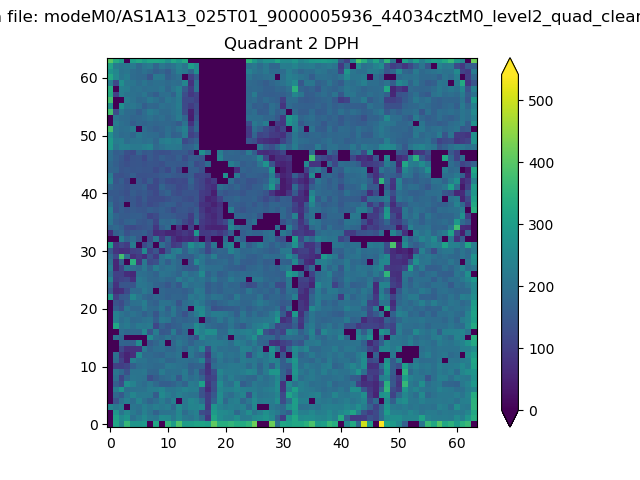 |
Quadrant C |
| Plot type | Count rate plots | Images |
|---|---|---|
| Comparison with Poisson distribution Blue bars denote a histogram of data divided into 1 sec bins. Red curve is a Poisson curve with rate = median count rate of data. |
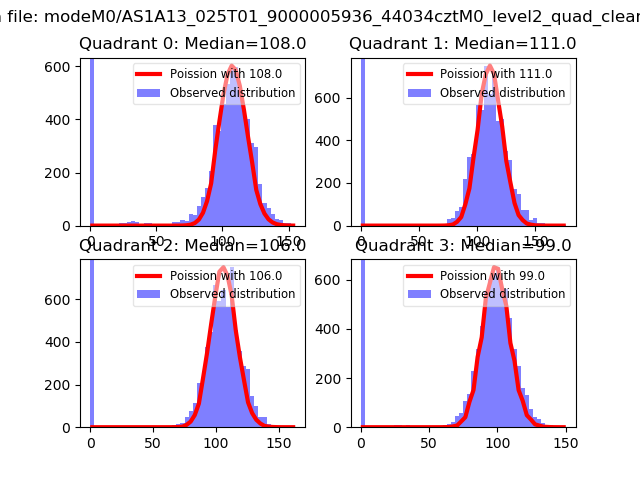 |
 |
| Quadrant-wise count rates Data is divided into 100 sec bins |
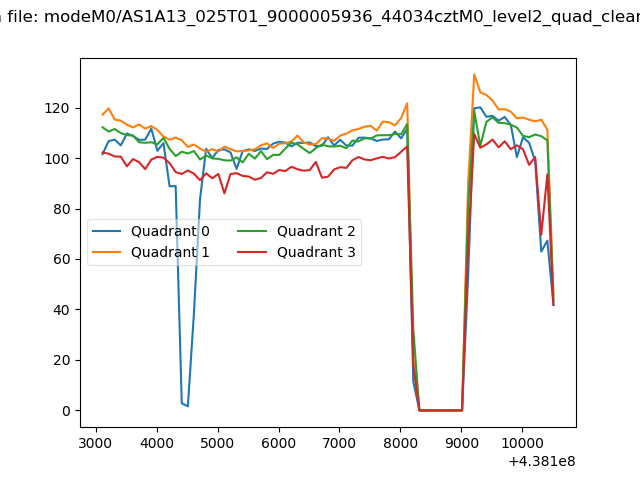 |
|
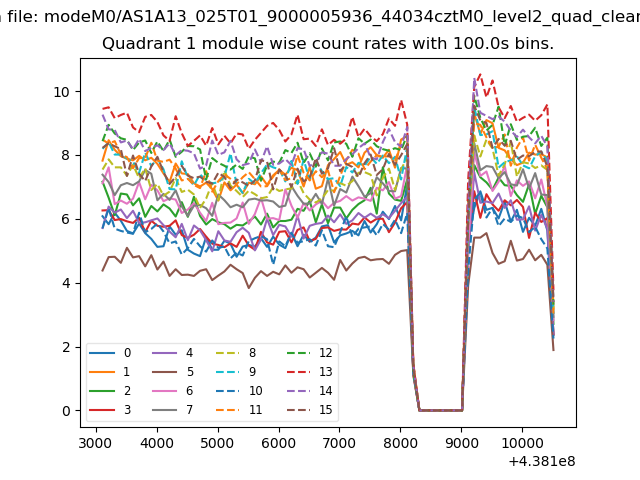
| Module-wise count rates for Quadrant A Data is divided into 100 sec bins |
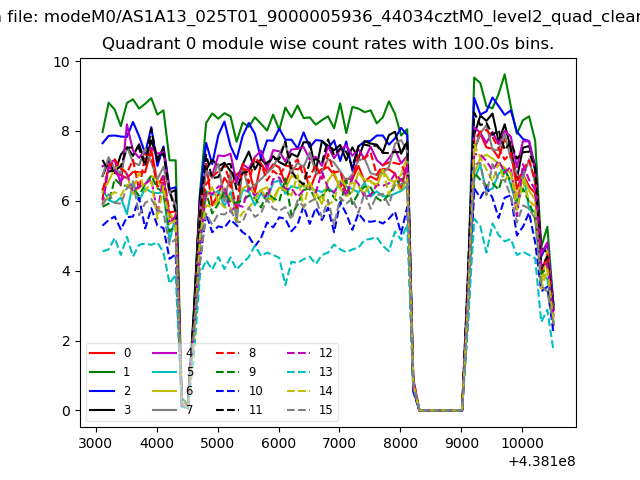 |
 |
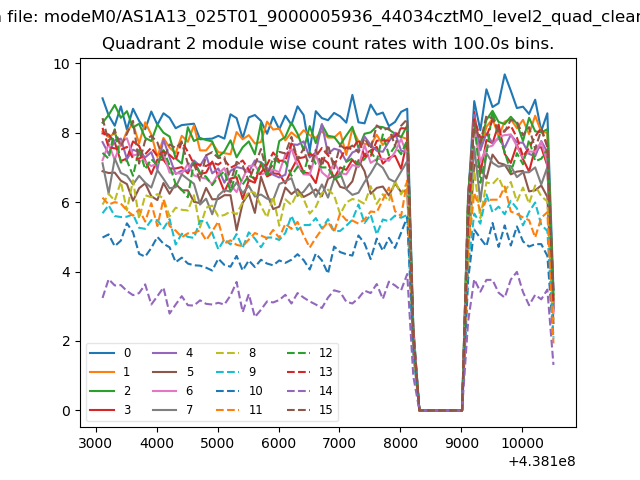
| Module-wise count rates for Quadrant B Data is divided into 100 sec bins |
 |
 |
| Module-wise count rates for Quadrant C Data is divided into 100 sec bins |
 |
 |
| Module-wise count rates for Quadrant D Data is divided into 100 sec bins |
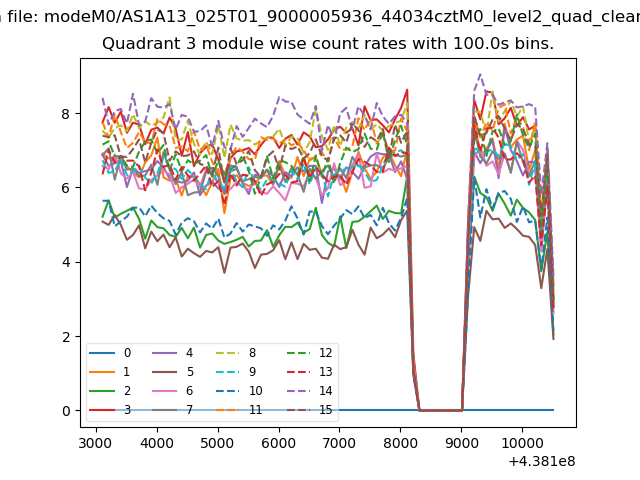 |
 |
| Parameter | Plot |
|---|---|
| CZT HV Monitor | 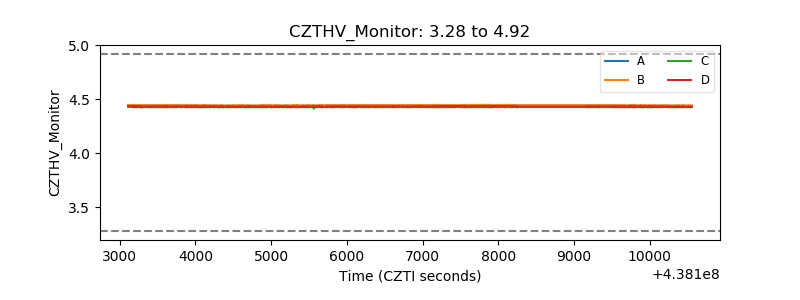 |
| D_VDD | 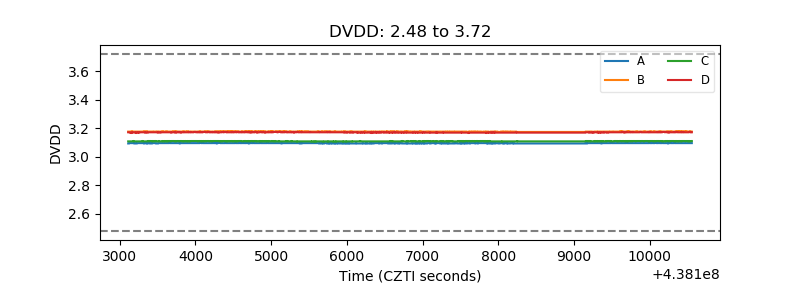 |
| Temperature 1 | 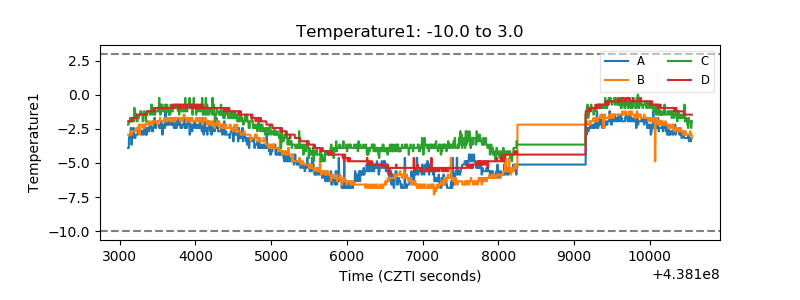 |
| Veto HV Monitor | 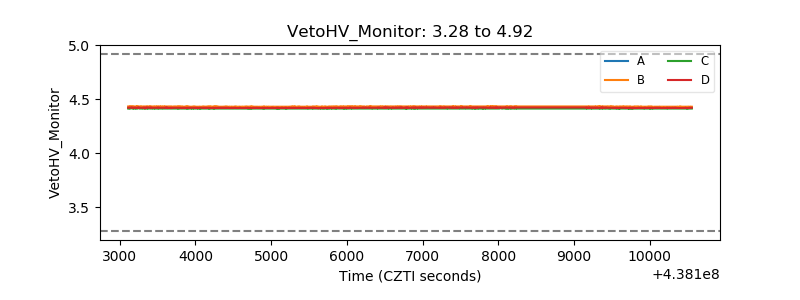 |
| Veto LLD | 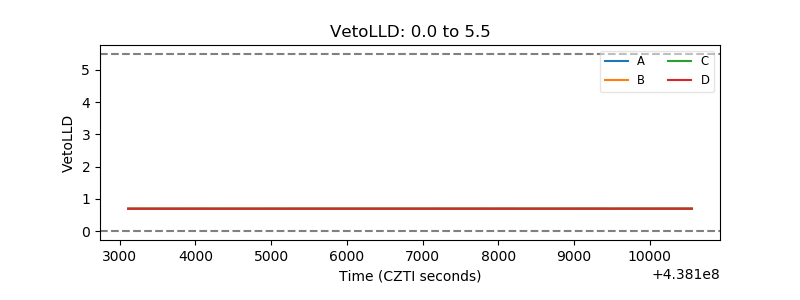 |
| Alpha Counter | 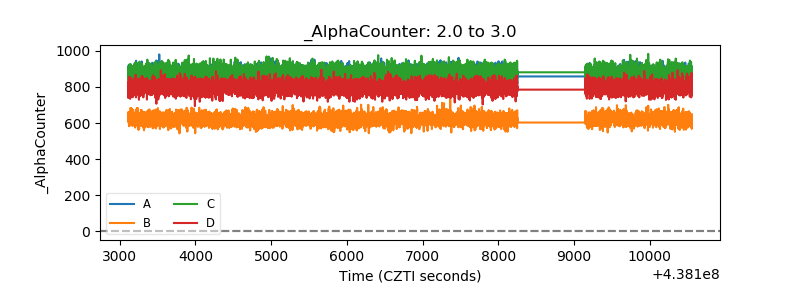 |
| _CPM_Rate | 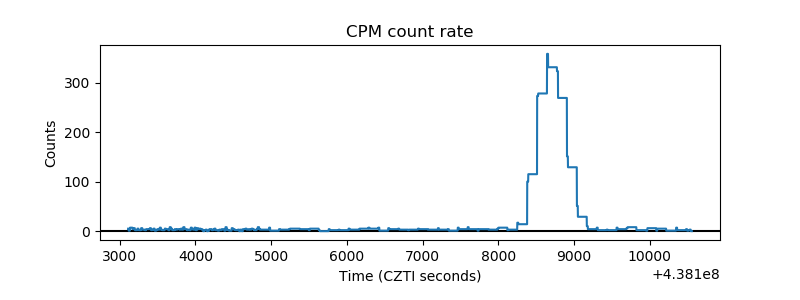 |
| CZT Counter | 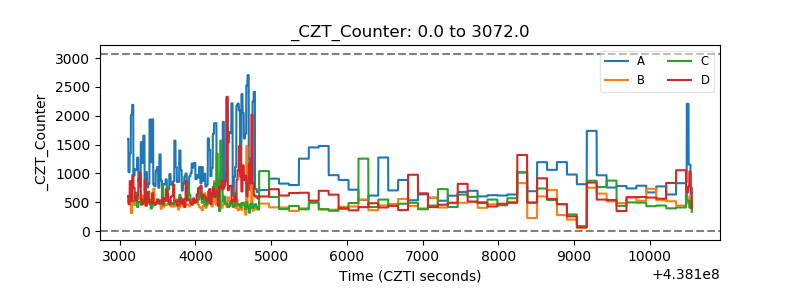 |
| +2.5 Volts monitor | 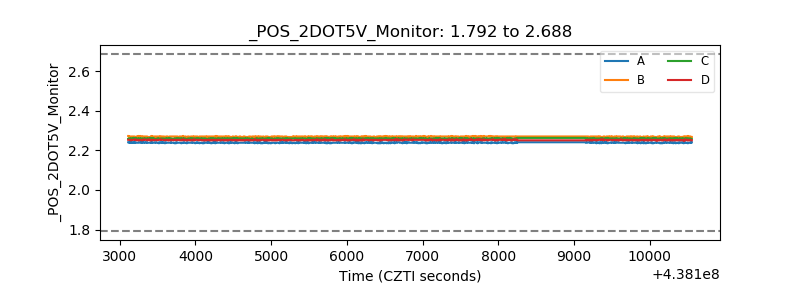 |
| +5 Volts monitor | 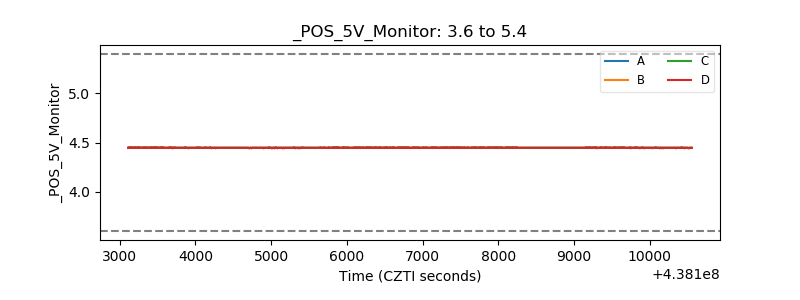 |
| _ROLL_ROT | 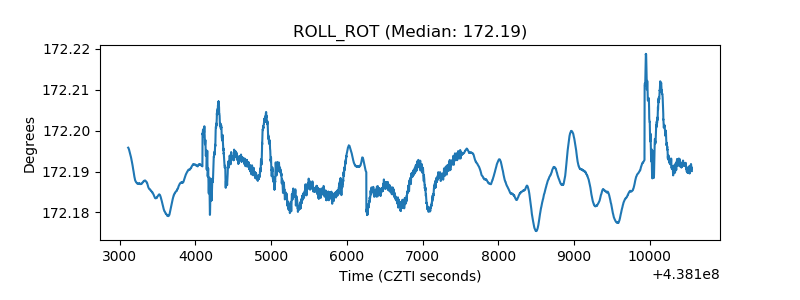 |
| _Roll_DEC | 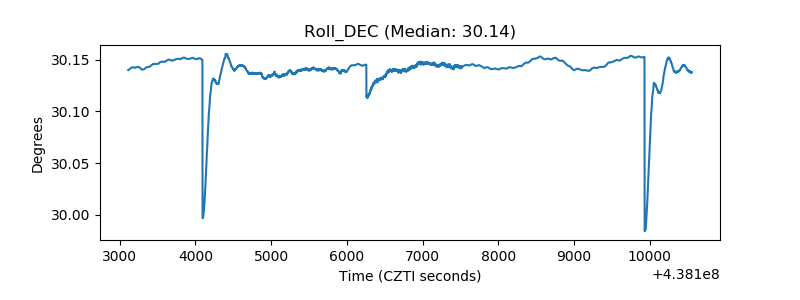 |
| _Roll_RA | 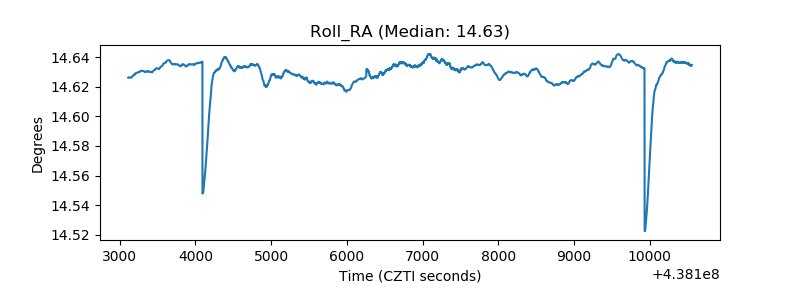 |
| Veto Counter | 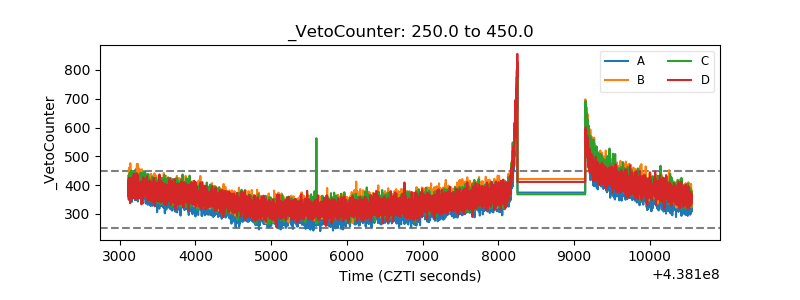 |