| Param | Original file | Final file |
|---|---|---|
| Filename | modeM0/AS1A13_025T01_9000005936_44036cztM0_level2.fits | modeM0/AS1A13_025T01_9000005936_44036cztM0_level2_quad_clean.evt |
| Size (bytes) | 502,269,120 | 108,858,240 |
| Size | 479.0 MB | 103.8 MB |
| Events in quadrant A | 4,995,858 | 719,029 |
| Events in quadrant B | 3,347,216 | 757,873 |
| Events in quadrant C | 3,643,678 | 722,718 |
| Events in quadrant D | 6,088,887 | 632,183 |
| Mode M9 | |||
|---|---|---|---|
| Quadrant | BADHDUFLAG | Total packets | Discarded packets |
| A | 0 | 15 | 0 |
| B | 0 | 16 | 0 |
| C | 0 | 16 | 0 |
| D | 0 | 16 | 0 |
| Mode M0 | |||
|---|---|---|---|
| Quadrant | BADHDUFLAG | Total packets | Discarded packets |
| A | 0 | 19288 | 2 |
| B | 0 | 14498 | 2 |
| C | 0 | 15378 | 2 |
| D | 0 | 22599 | 2 |
| Mode SS | |||
|---|---|---|---|
| Quadrant | BADHDUFLAG | Total packets | Discarded packets |
| A | 0 | 136 | 0 |
| B | 0 | 136 | 0 |
| C | 0 | 136 | 0 |
| D | 0 | 136 | 0 |
| Quadrant | Total seconds | Saturated seconds | Saturation percentage |
|---|---|---|---|
| A | 6657 | 309 | 4.641731% |
| B | 6656 | 68 | 1.021635% |
| C | 6656 | 121 | 1.817909% |
| D | 6656 | 584 | 8.774038% |
Noise dominated data is calculated using 1-second bins in cleaned event files. If a bin has >2000 counts, and if more than 50% of those come from <1% of pixels, then it is considered to be noise-dominated and hence unusable.
| Quadrant | # 1 sec bins | Bins with >0 counts | Bins with >2000 counts | High rate bins dominated by noise | Noise dominated (total time) | Noise dominated (detector-on time) | Marked lightcurve |
|---|---|---|---|---|---|---|---|
| A | 7692 | 6658 | 115 | 115 | 1.50% | 1.73% | 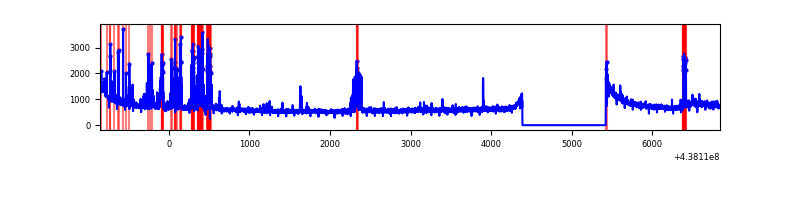 |
| B | 7691 | 6657 | 7 | 7 | 0.09% | 0.11% | 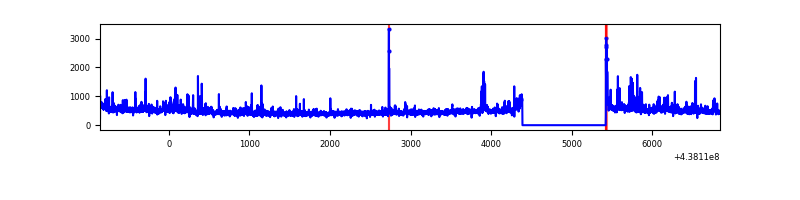 |
| C | 7691 | 6657 | 62 | 62 | 0.81% | 0.93% | 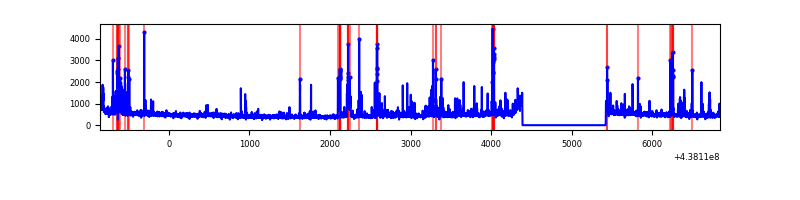 |
| D | 7691 | 6657 | 474 | 474 | 6.16% | 7.12% | 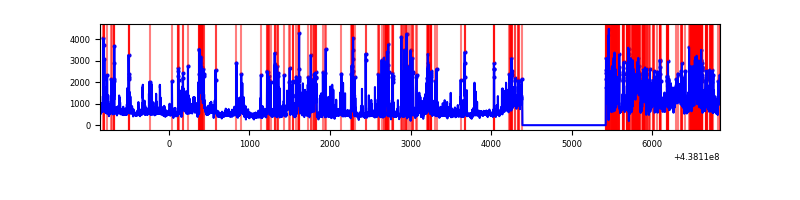 |
Top three noisy pixels from each quadrant. If the there are fewer than three noisy pixels in the level2.evt file, extra rows are filled as -1
| Pixel properties | Quadrant properties | ||||||
|---|---|---|---|---|---|---|---|
| Quadrant | DetID | PixID | Counts | Sigma | Mean | Median | Sigma |
| A | 10 | 83 | 1352320 | 8740.84 | 748 | 730 | 154.6 |
| A | 14 | 238 | 346470 | 2235.93 | 748 | 730 | 154.6 |
| A | 15 | 223 | 260448 | 1679.62 | 748 | 730 | 154.6 |
| B | 0 | 200 | 114388 | 760.68 | 755 | 731 | 149.4 |
| B | 0 | 213 | 76613 | 507.86 | 755 | 731 | 149.4 |
| B | 3 | 112 | 41446 | 272.5 | 755 | 731 | 149.4 |
| C | 14 | 254 | 251238 | 1427.46 | 744 | 748 | 175.5 |
| C | 1 | 241 | 242020 | 1374.92 | 744 | 748 | 175.5 |
| C | 3 | 233 | 126476 | 716.48 | 744 | 748 | 175.5 |
| D | 1 | 52 | 1987104 | 10737.97 | 729 | 706 | 185.0 |
| D | 5 | 235 | 540053 | 2915.57 | 729 | 706 | 185.0 |
| D | 4 | 222 | 177336 | 954.81 | 729 | 706 | 185.0 |
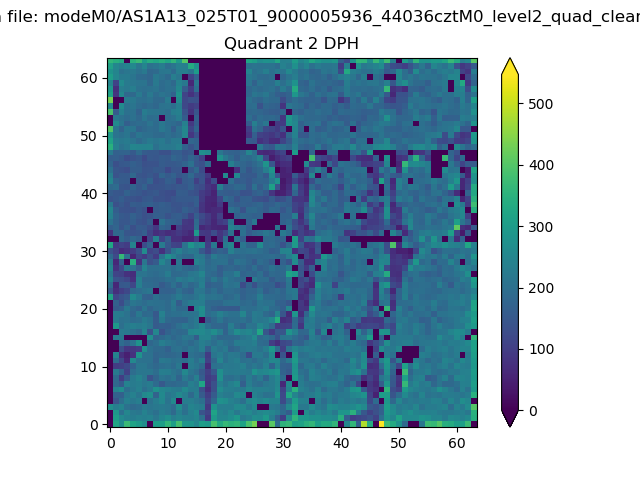
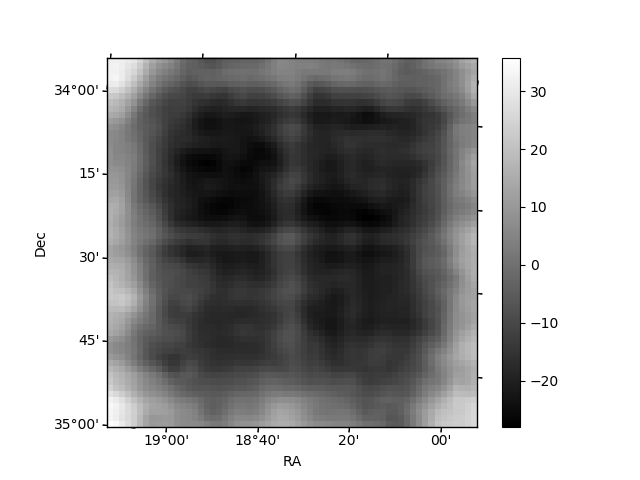
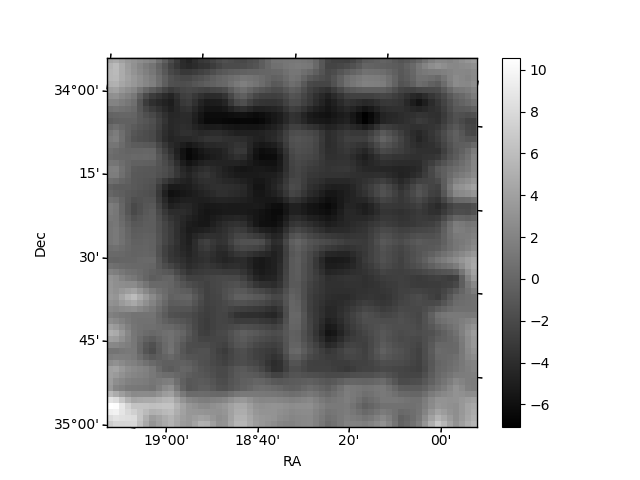
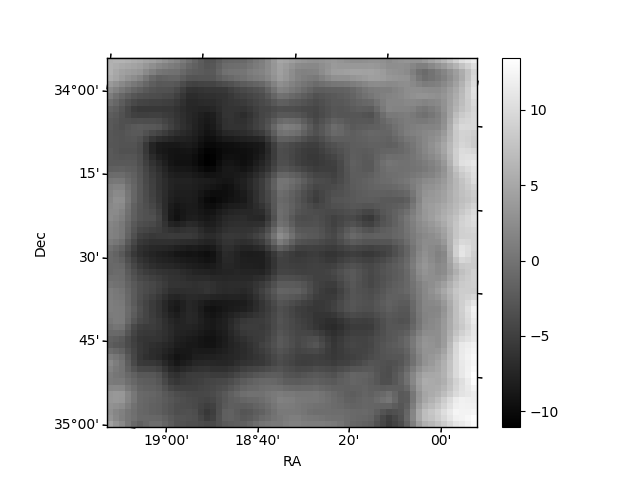
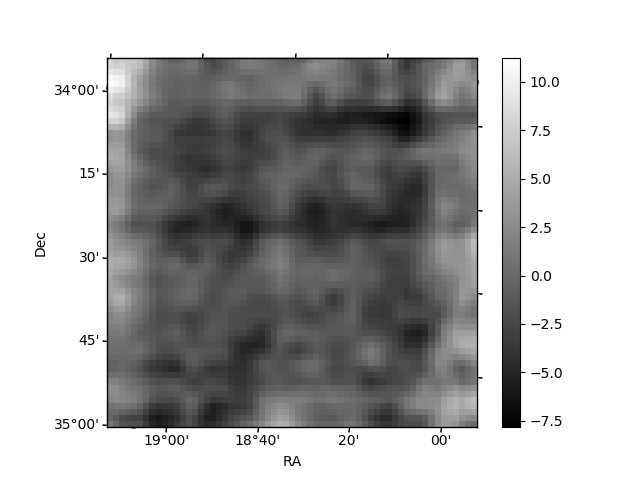
Histogram calculated using DETX and DETY for each event in the final _common_clean file
| Quadrant A | 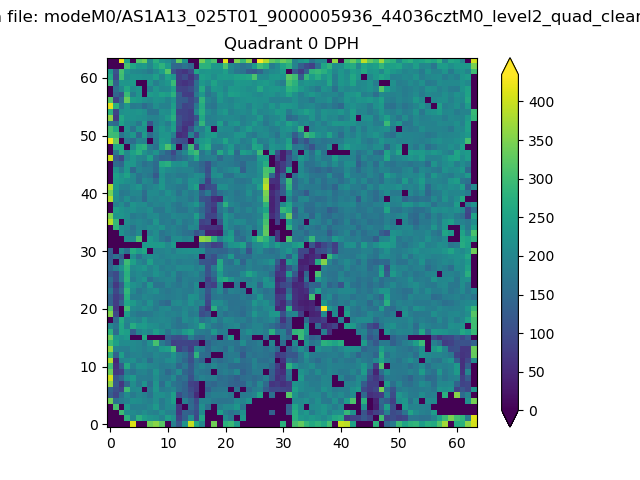 |
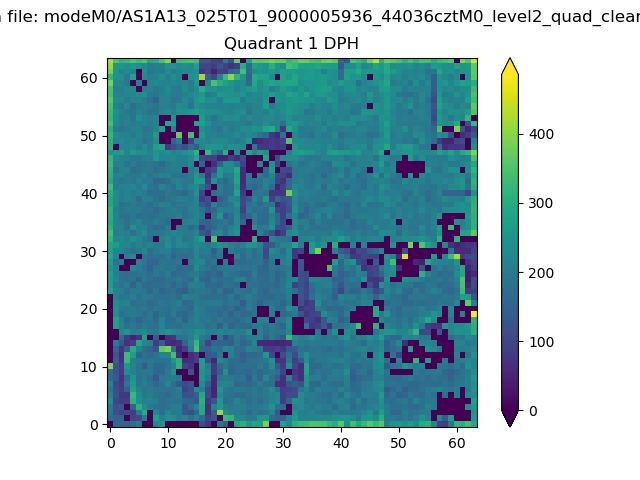 |
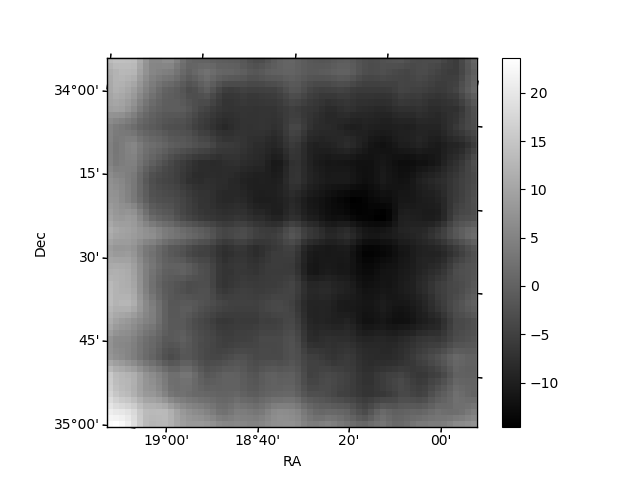
Quadrant B |
|---|---|---|---|
| Quadrant D | 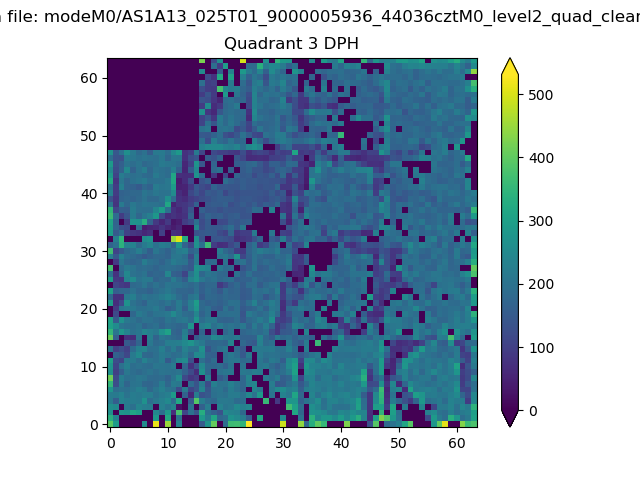 |
 |
Quadrant C |
| Plot type | Count rate plots | Images |
|---|---|---|
| Comparison with Poisson distribution Blue bars denote a histogram of data divided into 1 sec bins. Red curve is a Poisson curve with rate = median count rate of data. |
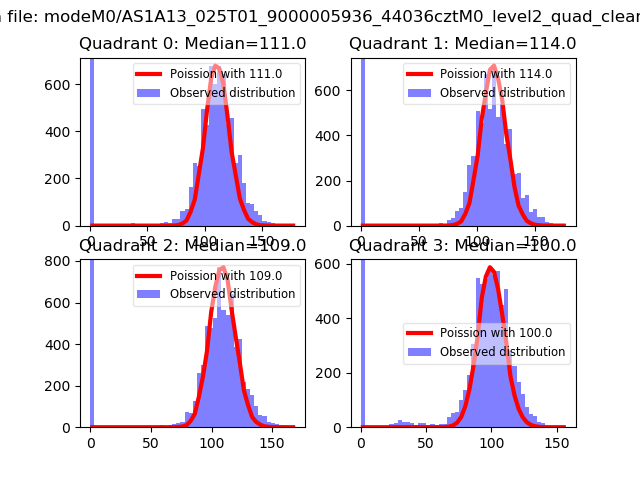 |
 |
| Quadrant-wise count rates Data is divided into 100 sec bins |
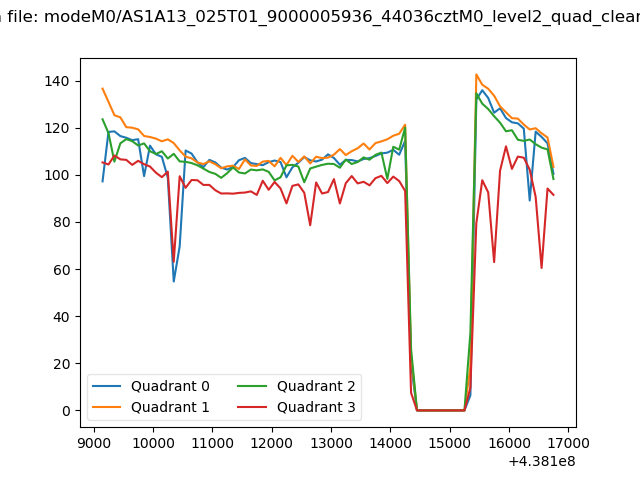 |
|
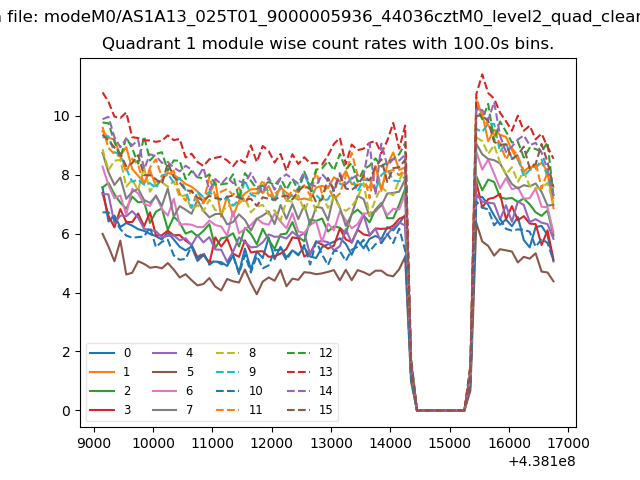
| Module-wise count rates for Quadrant A Data is divided into 100 sec bins |
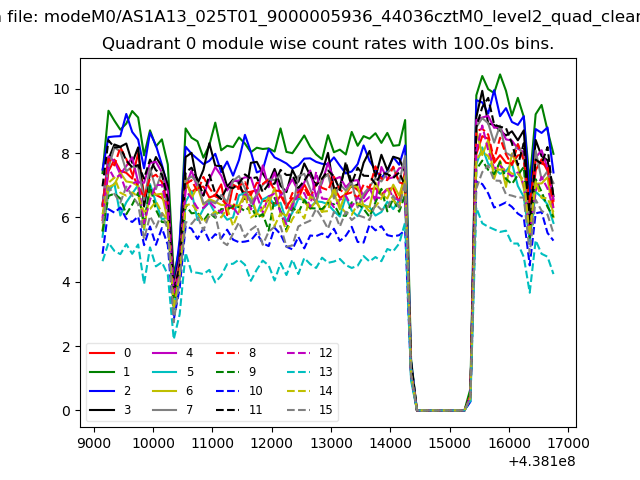 |
 |
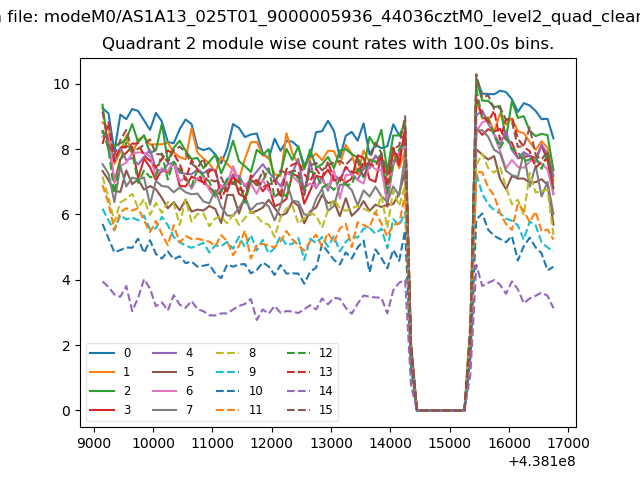
| Module-wise count rates for Quadrant B Data is divided into 100 sec bins |
 |
 |
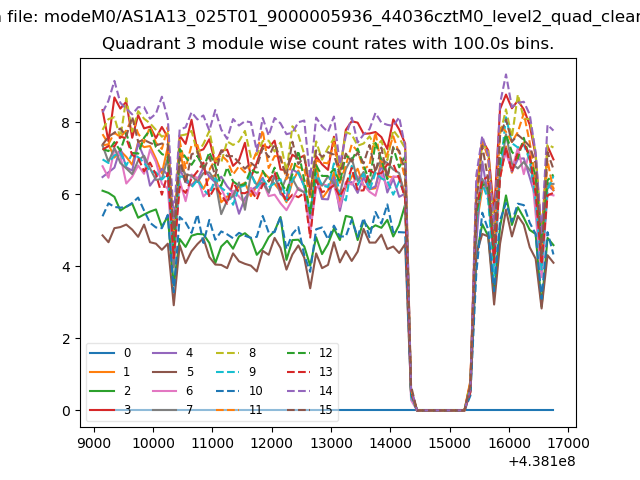
| Module-wise count rates for Quadrant C Data is divided into 100 sec bins |
 |
 |
| Module-wise count rates for Quadrant D Data is divided into 100 sec bins |
 |
 |
| Parameter | Plot |
|---|---|
| CZT HV Monitor | 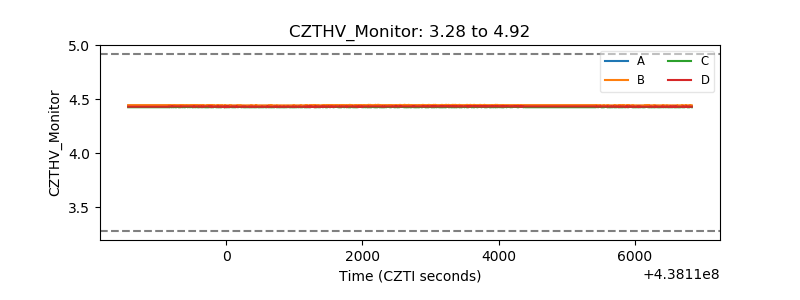 |
| D_VDD | 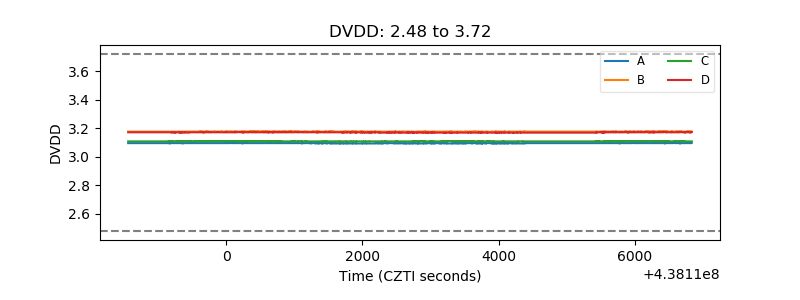 |
| Temperature 1 | 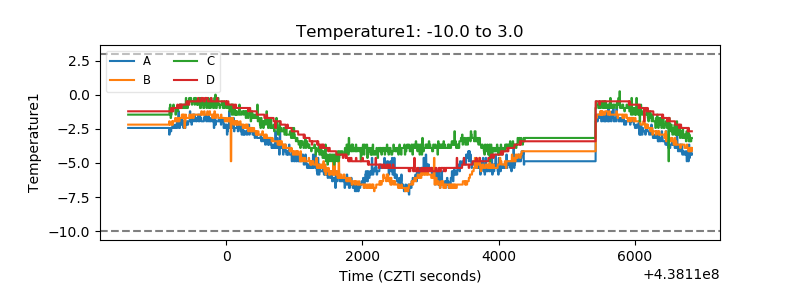 |
| Veto HV Monitor | 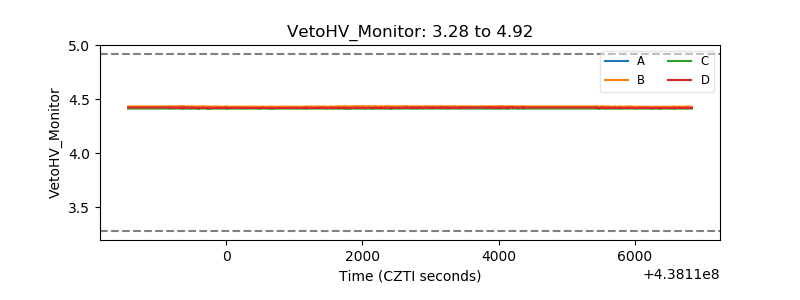 |
| Veto LLD | 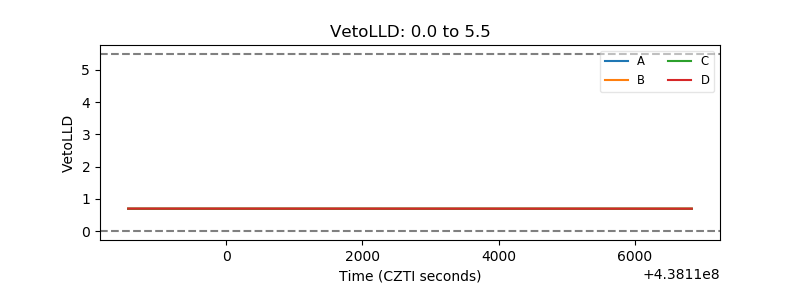 |
| Alpha Counter | 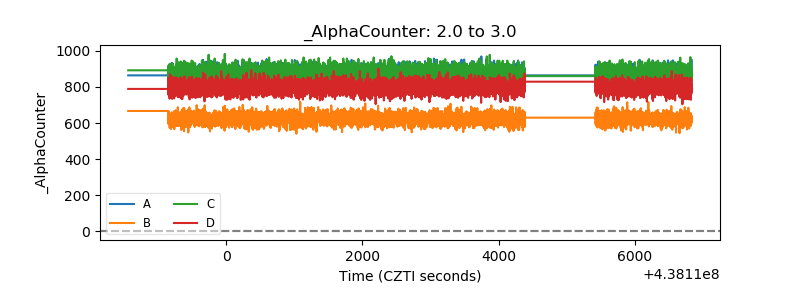 |
| _CPM_Rate | 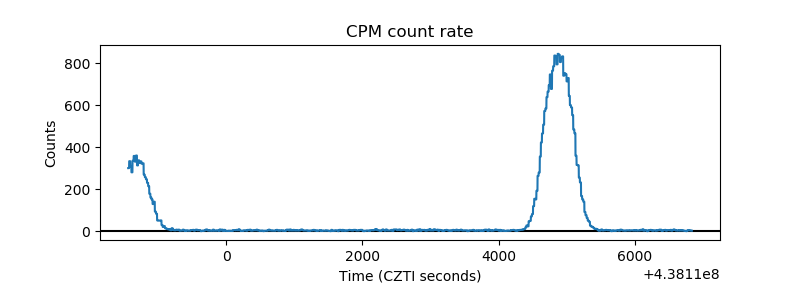 |
| CZT Counter |  |
| +2.5 Volts monitor | 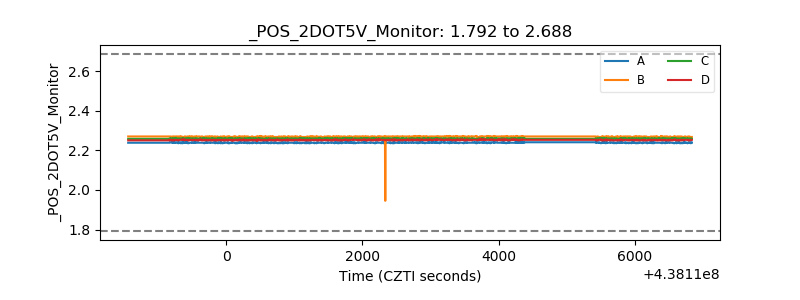 |
| +5 Volts monitor | 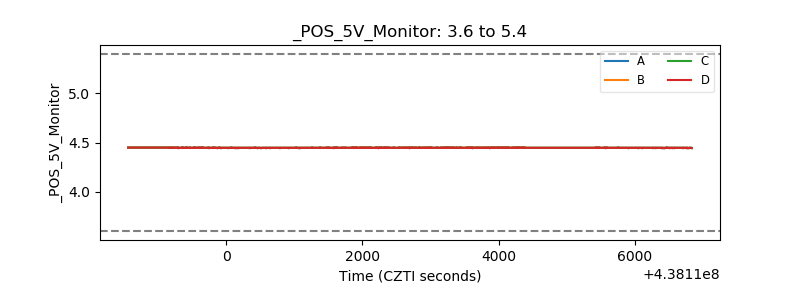 |
| _ROLL_ROT | 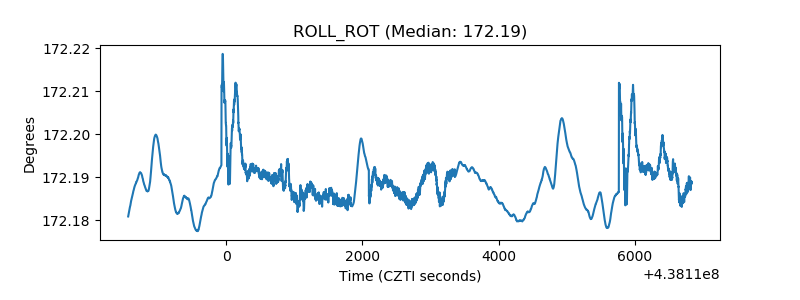 |
| _Roll_DEC | 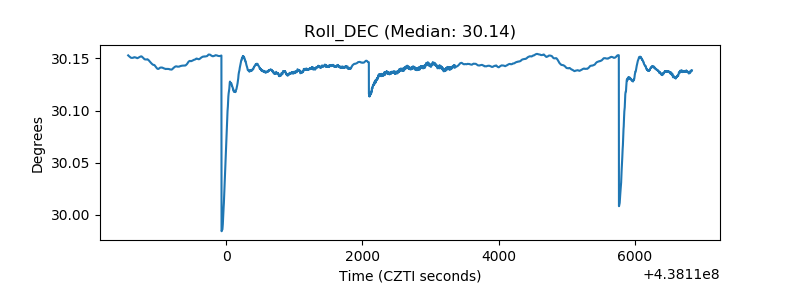 |
| _Roll_RA | 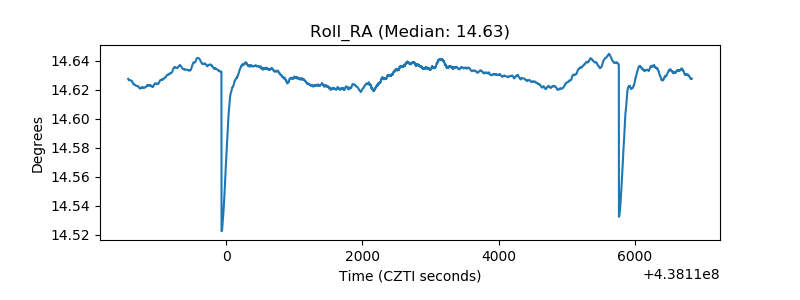 |
| Veto Counter | 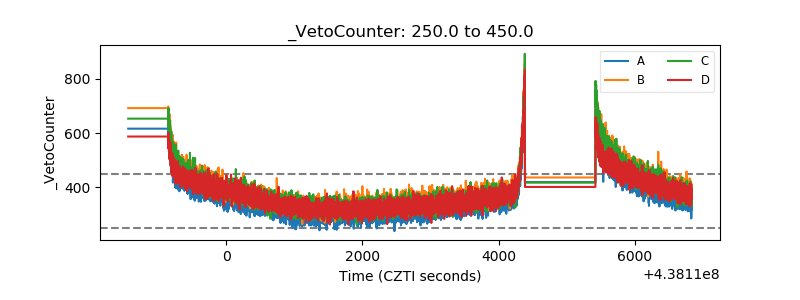 |