| Param | Original file | Final file |
|---|---|---|
| Filename | modeM0/AS1A13_025T01_9000005936_44037cztM0_level2.fits | modeM0/AS1A13_025T01_9000005936_44037cztM0_level2_quad_clean.evt |
| Size (bytes) | 509,613,120 | 108,884,160 |
| Size | 486.0 MB | 103.8 MB |
| Events in quadrant A | 4,720,955 | 736,813 |
| Events in quadrant B | 3,382,982 | 762,120 |
| Events in quadrant C | 3,793,292 | 723,090 |
| Events in quadrant D | 6,468,858 | 626,367 |
| Mode M9 | |||
|---|---|---|---|
| Quadrant | BADHDUFLAG | Total packets | Discarded packets |
| A | 0 | 14 | 0 |
| B | 0 | 15 | 0 |
| C | 0 | 15 | 0 |
| D | 0 | 15 | 0 |
| Mode M0 | |||
|---|---|---|---|
| Quadrant | BADHDUFLAG | Total packets | Discarded packets |
| A | 0 | 18697 | 2 |
| B | 0 | 14400 | 2 |
| C | 0 | 15589 | 2 |
| D | 0 | 23712 | 2 |
| Mode SS | |||
|---|---|---|---|
| Quadrant | BADHDUFLAG | Total packets | Discarded packets |
| A | 0 | 132 | 0 |
| B | 0 | 132 | 0 |
| C | 0 | 132 | 0 |
| D | 0 | 132 | 0 |
| Quadrant | Total seconds | Saturated seconds | Saturation percentage |
|---|---|---|---|
| A | 6424 | 179 | 2.786426% |
| B | 6424 | 68 | 1.058531% |
| C | 6424 | 167 | 2.599626% |
| D | 6424 | 635 | 9.884807% |
Noise dominated data is calculated using 1-second bins in cleaned event files. If a bin has >2000 counts, and if more than 50% of those come from <1% of pixels, then it is considered to be noise-dominated and hence unusable.
| Quadrant | # 1 sec bins | Bins with >0 counts | Bins with >2000 counts | High rate bins dominated by noise | Noise dominated (total time) | Noise dominated (detector-on time) | Marked lightcurve |
|---|---|---|---|---|---|---|---|
| A | 7554 | 6425 | 39 | 39 | 0.52% | 0.61% | 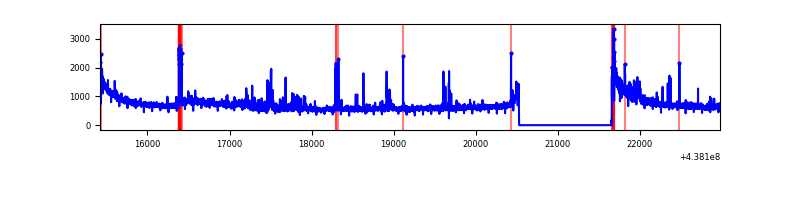 |
| B | 7554 | 6424 | 10 | 10 | 0.13% | 0.16% | 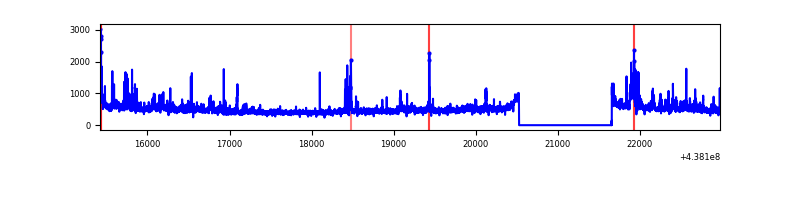 |
| C | 7554 | 6425 | 128 | 128 | 1.69% | 1.99% | 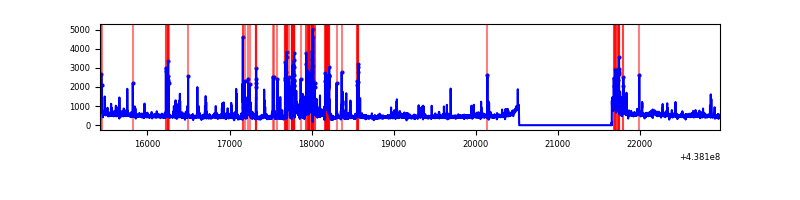 |
| D | 7554 | 6425 | 553 | 553 | 7.32% | 8.61% | 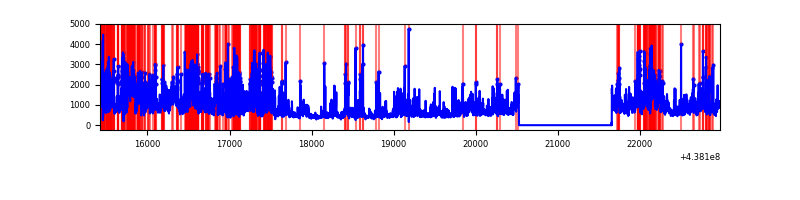 |
Top three noisy pixels from each quadrant. If the there are fewer than three noisy pixels in the level2.evt file, extra rows are filled as -1
| Pixel properties | Quadrant properties | ||||||
|---|---|---|---|---|---|---|---|
| Quadrant | DetID | PixID | Counts | Sigma | Mean | Median | Sigma |
| A | 10 | 83 | 1351735 | 8869.13 | 740 | 723 | 152.3 |
| A | 15 | 223 | 312466 | 2046.53 | 740 | 723 | 152.3 |
| A | 15 | 222 | 108759 | 709.23 | 740 | 723 | 152.3 |
| B | 0 | 200 | 167164 | 1154.11 | 742 | 720 | 144.2 |
| B | 0 | 213 | 147403 | 1017.09 | 742 | 720 | 144.2 |
| B | 0 | 183 | 38908 | 264.79 | 742 | 720 | 144.2 |
| C | 1 | 241 | 608029 | 3579.6 | 728 | 732 | 169.7 |
| C | 3 | 233 | 193809 | 1138.06 | 728 | 732 | 169.7 |
| C | 14 | 254 | 136017 | 797.41 | 728 | 732 | 169.7 |
| D | 1 | 52 | 2657083 | 14935.34 | 712 | 691 | 177.9 |
| D | 7 | 80 | 278749 | 1563.36 | 712 | 691 | 177.9 |
| D | 5 | 235 | 150029 | 839.64 | 712 | 691 | 177.9 |
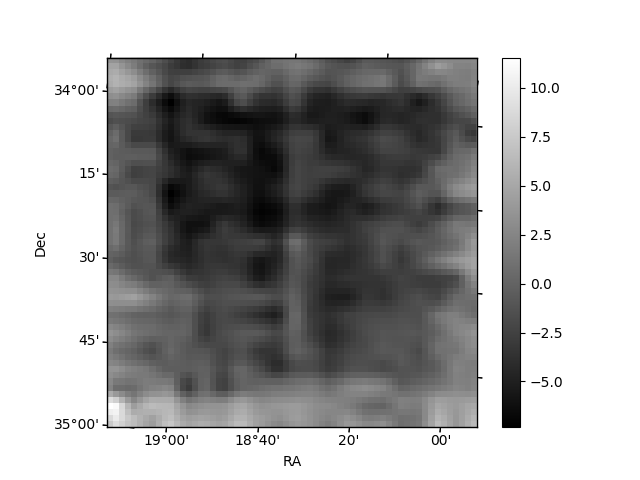
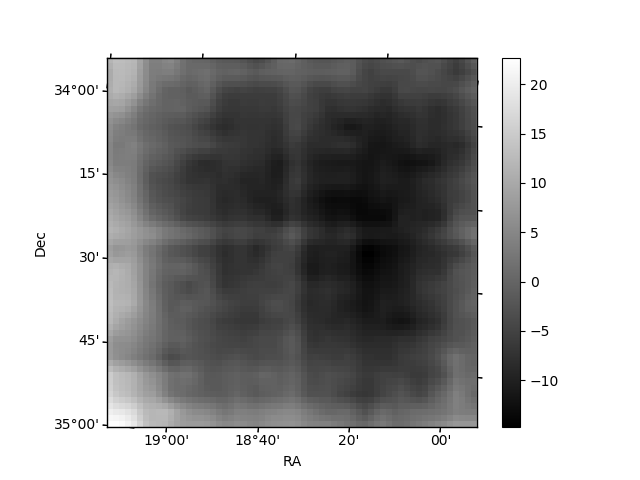
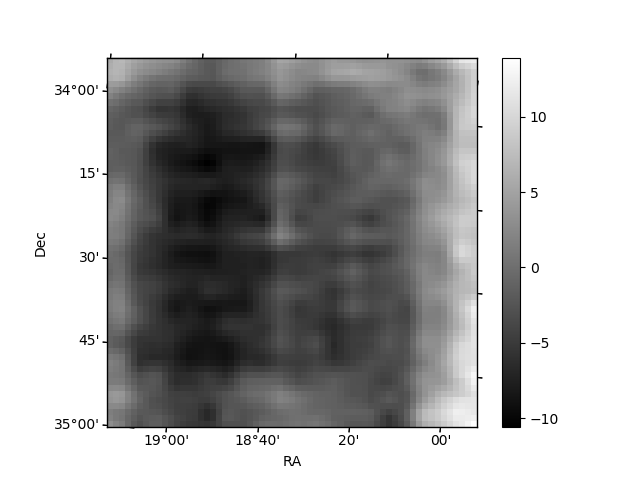
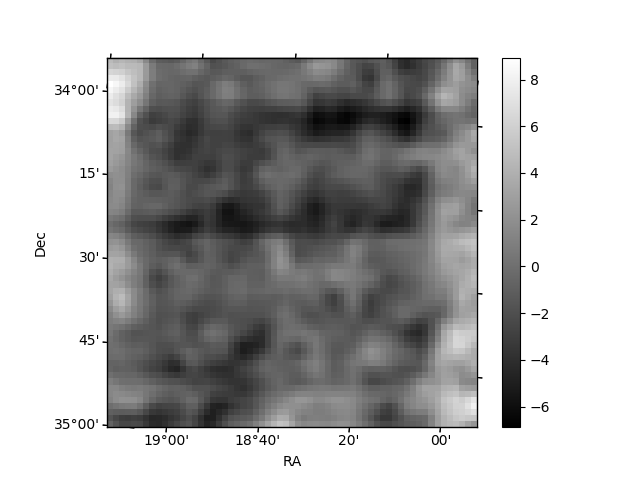
Histogram calculated using DETX and DETY for each event in the final _common_clean file
| Quadrant A | 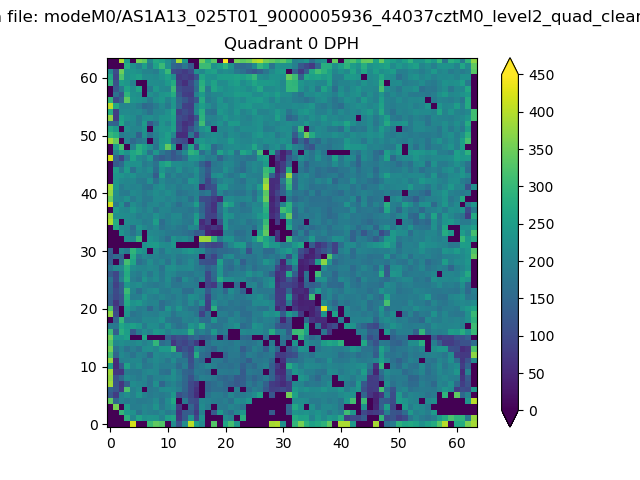 |
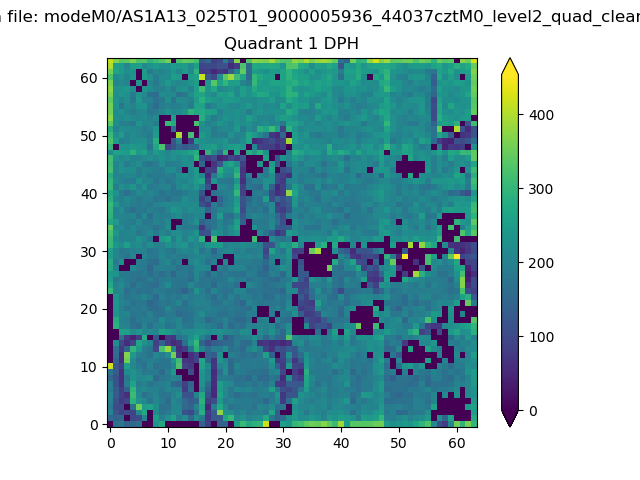 |
Quadrant B |
|---|---|---|---|
| Quadrant D | 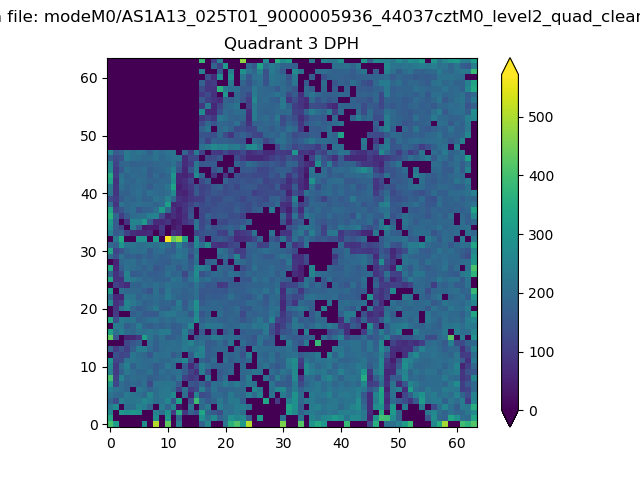 |
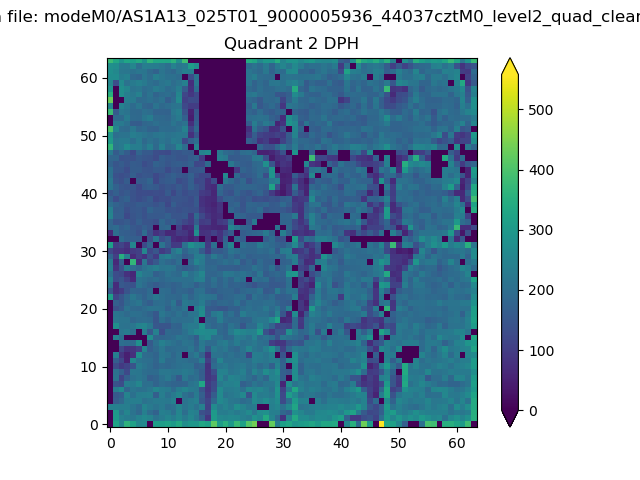 |
Quadrant C |
| Plot type | Count rate plots | Images |
|---|---|---|
| Comparison with Poisson distribution Blue bars denote a histogram of data divided into 1 sec bins. Red curve is a Poisson curve with rate = median count rate of data. |
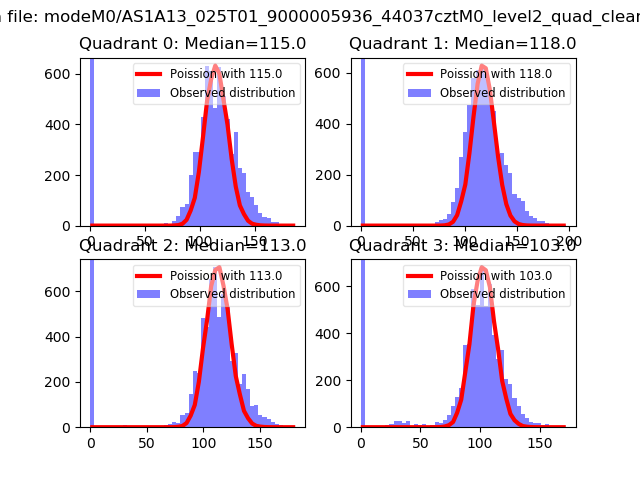 |
 |
| Quadrant-wise count rates Data is divided into 100 sec bins |
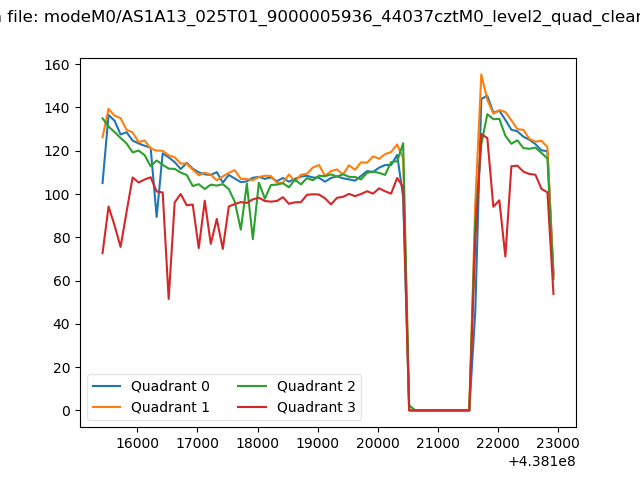 |
|
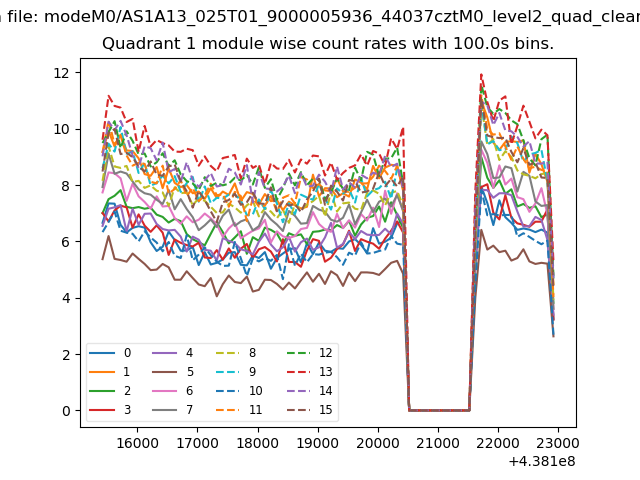
| Module-wise count rates for Quadrant A Data is divided into 100 sec bins |
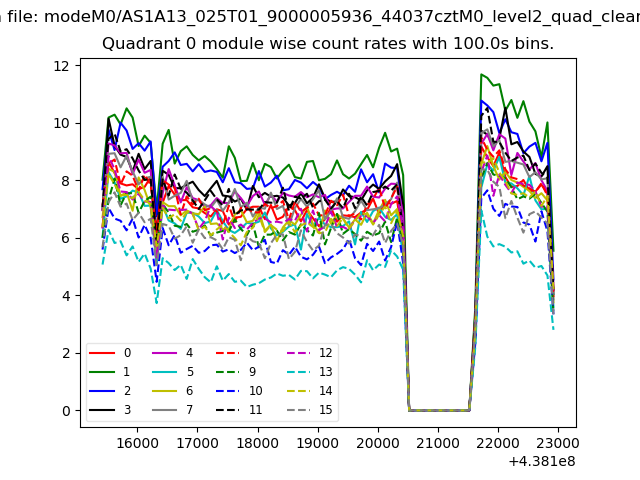 |
 |
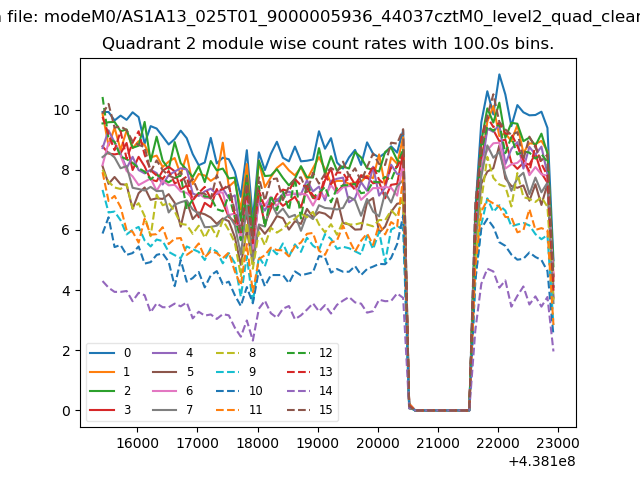
| Module-wise count rates for Quadrant B Data is divided into 100 sec bins |
 |
 |
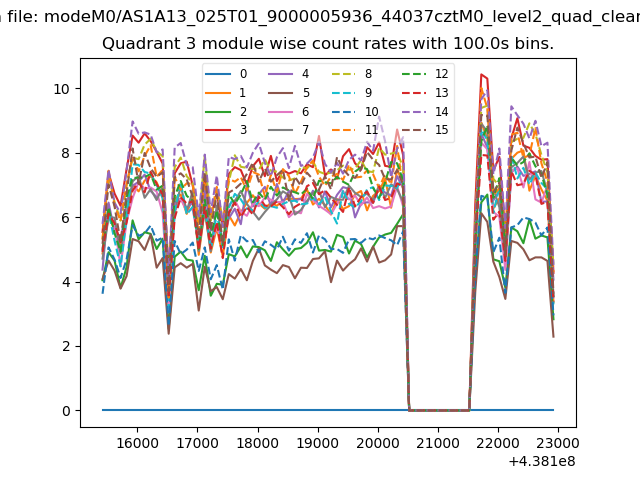
| Module-wise count rates for Quadrant C Data is divided into 100 sec bins |
 |
 |
| Module-wise count rates for Quadrant D Data is divided into 100 sec bins |
 |
 |
| Parameter | Plot |
|---|---|
| CZT HV Monitor | 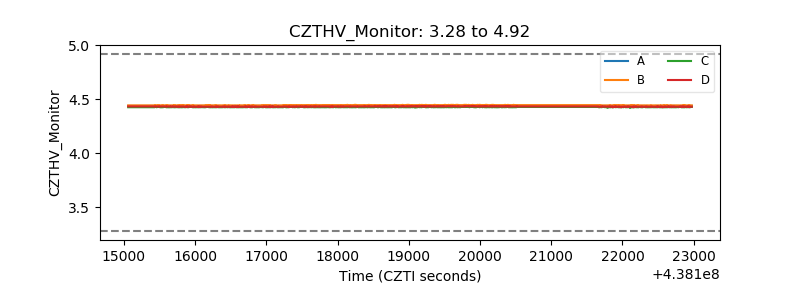 |
| D_VDD | 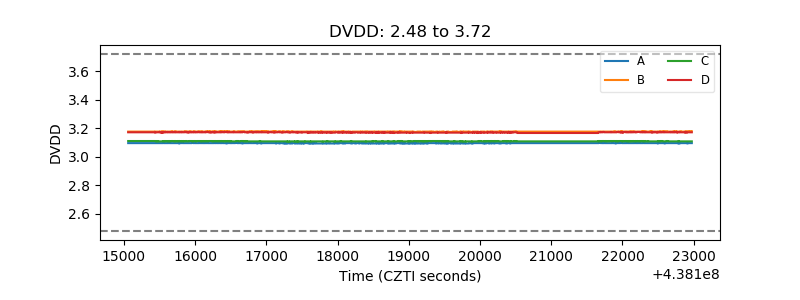 |
| Temperature 1 | 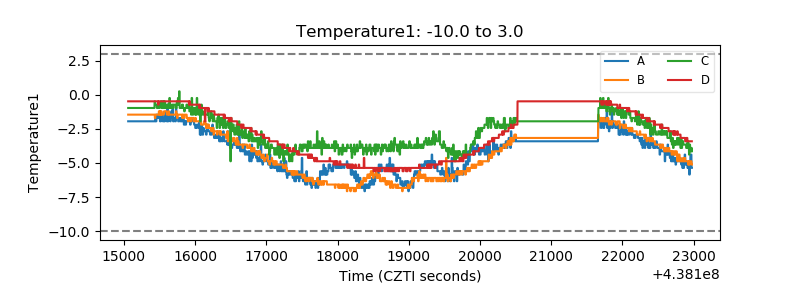 |
| Veto HV Monitor | 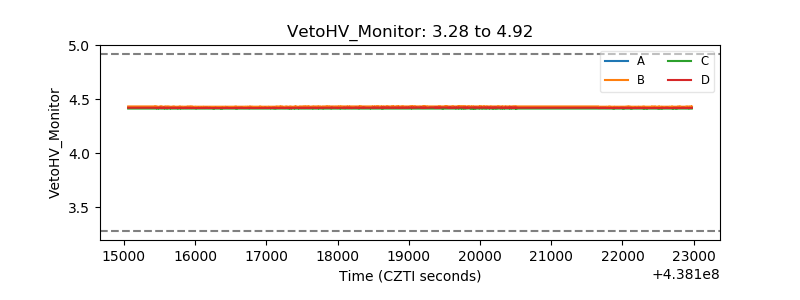 |
| Veto LLD | 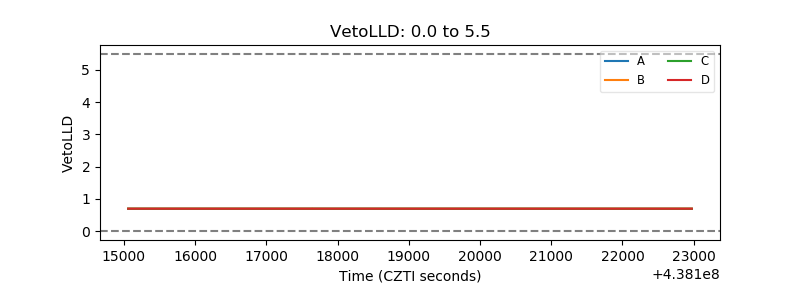 |
| Alpha Counter | 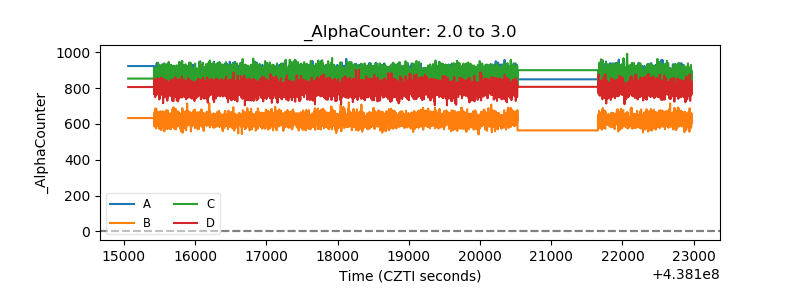 |
| _CPM_Rate | 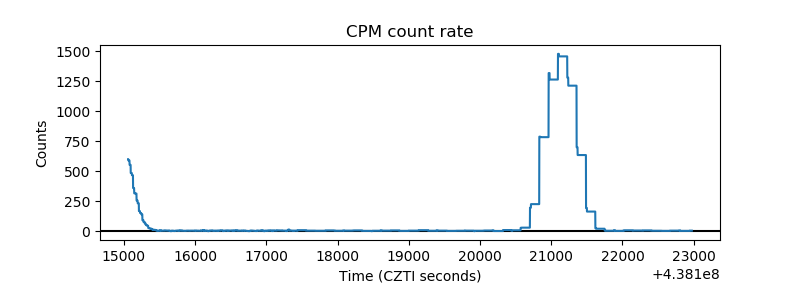 |
| CZT Counter |  |
| +2.5 Volts monitor | 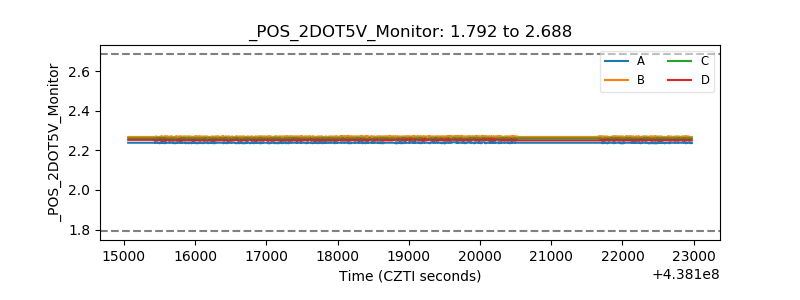 |
| +5 Volts monitor | 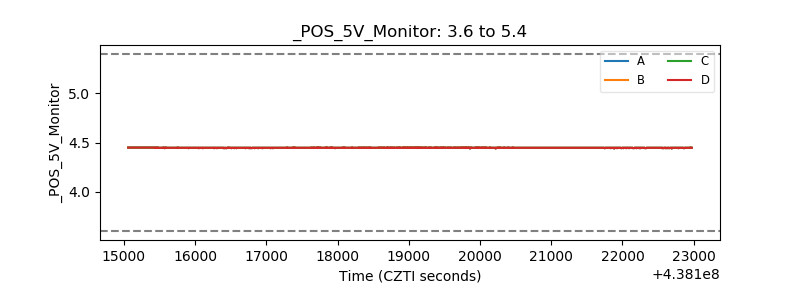 |
| _ROLL_ROT | 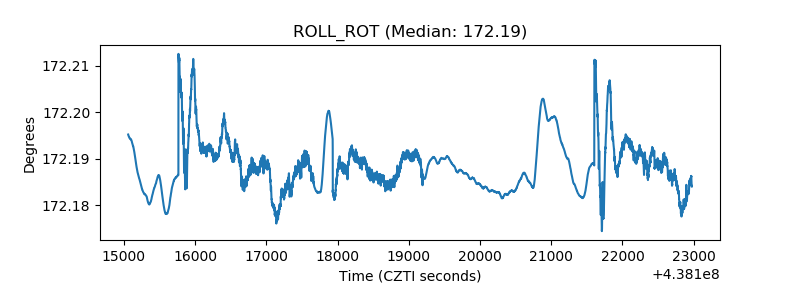 |
| _Roll_DEC | 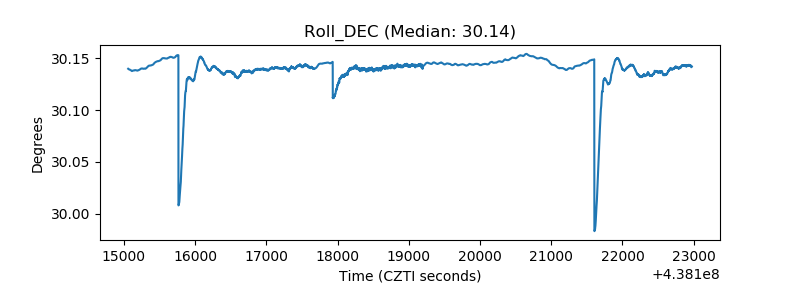 |
| _Roll_RA |  |
| Veto Counter | 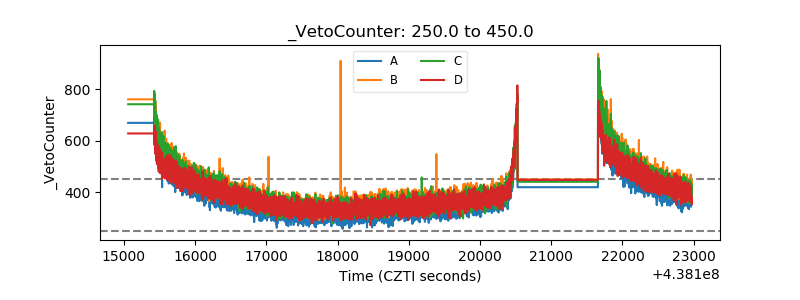 |