| Param | Original file | Final file |
|---|---|---|
| Filename | modeM0/AS1A13_025T01_9000005936_44038cztM0_level2.fits | modeM0/AS1A13_025T01_9000005936_44038cztM0_level2_quad_clean.evt |
| Size (bytes) | 476,749,440 | 111,790,080 |
| Size | 454.7 MB | 106.6 MB |
| Events in quadrant A | 4,438,435 | 756,228 |
| Events in quadrant B | 3,364,168 | 782,253 |
| Events in quadrant C | 3,366,526 | 747,171 |
| Events in quadrant D | 5,982,383 | 652,674 |
| Mode M9 | |||
|---|---|---|---|
| Quadrant | BADHDUFLAG | Total packets | Discarded packets |
| A | 0 | 14 | 0 |
| B | 0 | 15 | 0 |
| C | 0 | 15 | 0 |
| D | 0 | 15 | 0 |
| Mode M0 | |||
|---|---|---|---|
| Quadrant | BADHDUFLAG | Total packets | Discarded packets |
| A | 0 | 17763 | 2 |
| B | 0 | 14270 | 2 |
| C | 0 | 14256 | 2 |
| D | 0 | 22272 | 2 |
| Mode SS | |||
|---|---|---|---|
| Quadrant | BADHDUFLAG | Total packets | Discarded packets |
| A | 0 | 132 | 0 |
| B | 0 | 132 | 0 |
| C | 0 | 132 | 0 |
| D | 0 | 132 | 0 |
| Quadrant | Total seconds | Saturated seconds | Saturation percentage |
|---|---|---|---|
| A | 6394 | 136 | 2.126994% |
| B | 6394 | 75 | 1.172975% |
| C | 6394 | 94 | 1.470128% |
| D | 6393 | 473 | 7.398717% |
Noise dominated data is calculated using 1-second bins in cleaned event files. If a bin has >2000 counts, and if more than 50% of those come from <1% of pixels, then it is considered to be noise-dominated and hence unusable.
| Quadrant | # 1 sec bins | Bins with >0 counts | Bins with >2000 counts | High rate bins dominated by noise | Noise dominated (total time) | Noise dominated (detector-on time) | Marked lightcurve |
|---|---|---|---|---|---|---|---|
| A | 7604 | 6395 | 20 | 20 | 0.26% | 0.31% | 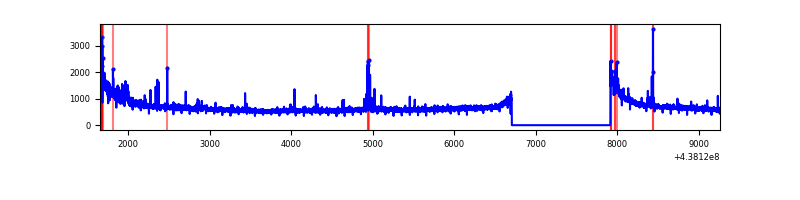 |
| B | 7604 | 6394 | 21 | 21 | 0.28% | 0.33% |  |
| C | 7604 | 6395 | 44 | 44 | 0.58% | 0.69% | 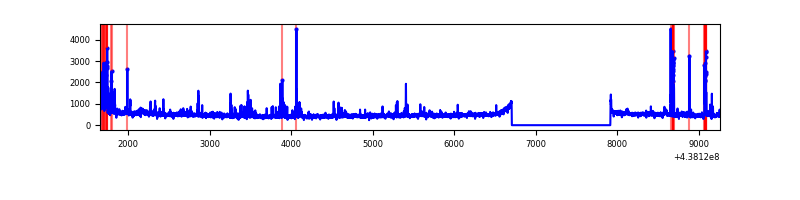 |
| D | 7603 | 6394 | 408 | 408 | 5.37% | 6.38% | 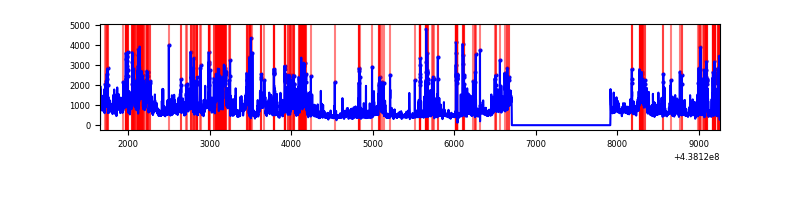 |
Top three noisy pixels from each quadrant. If the there are fewer than three noisy pixels in the level2.evt file, extra rows are filled as -1
| Pixel properties | Quadrant properties | ||||||
|---|---|---|---|---|---|---|---|
| Quadrant | DetID | PixID | Counts | Sigma | Mean | Median | Sigma |
| A | 10 | 83 | 1337658 | 8693.17 | 749 | 734 | 153.8 |
| A | 15 | 222 | 79942 | 515.04 | 749 | 734 | 153.8 |
| A | 14 | 238 | 46278 | 296.14 | 749 | 734 | 153.8 |
| B | 0 | 200 | 124992 | 848.59 | 753 | 731 | 146.4 |
| B | 0 | 213 | 109968 | 745.99 | 753 | 731 | 146.4 |
| B | 4 | 170 | 63357 | 427.68 | 753 | 731 | 146.4 |
| C | 3 | 233 | 223928 | 1279.89 | 741 | 745 | 174.4 |
| C | 1 | 241 | 172703 | 986.13 | 741 | 745 | 174.4 |
| C | 14 | 254 | 62333 | 353.19 | 741 | 745 | 174.4 |
| D | 1 | 52 | 1737859 | 9482.13 | 721 | 699 | 183.2 |
| D | 5 | 222 | 263093 | 1432.25 | 721 | 699 | 183.2 |
| D | 13 | 249 | 202276 | 1100.29 | 721 | 699 | 183.2 |
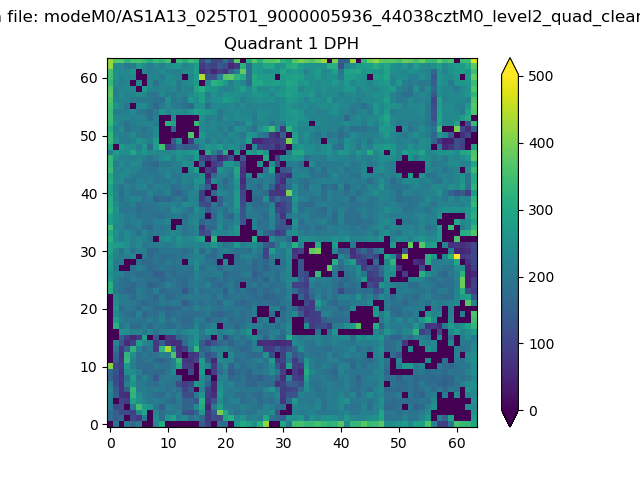
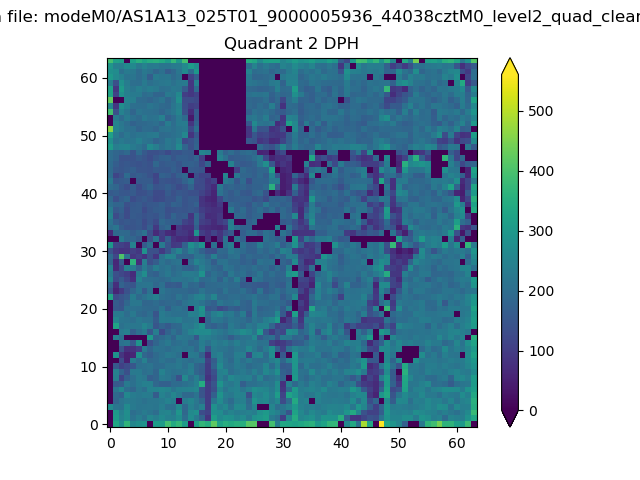
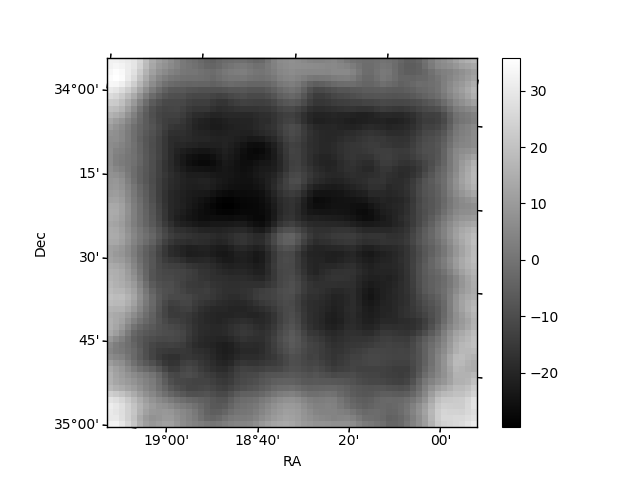
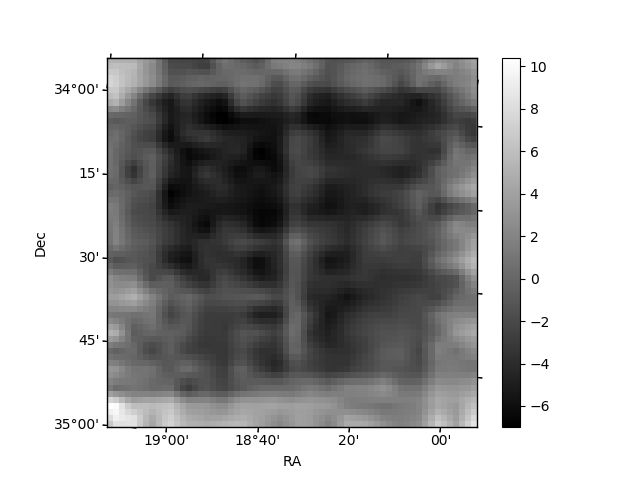
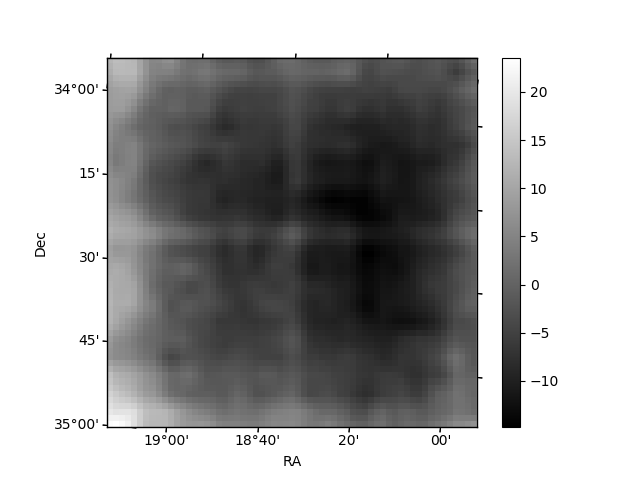
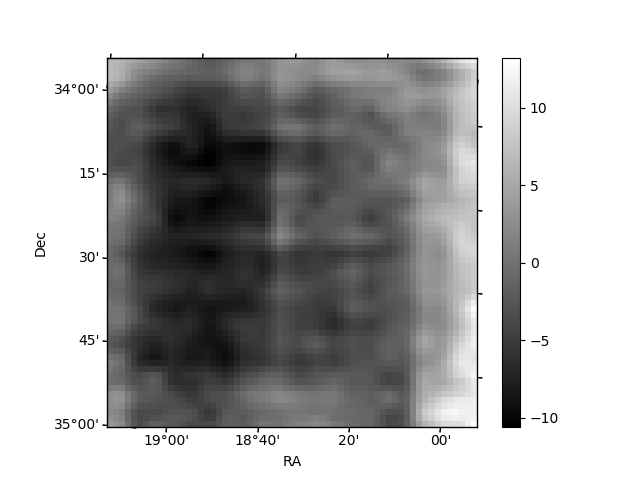
Histogram calculated using DETX and DETY for each event in the final _common_clean file
| Quadrant A | 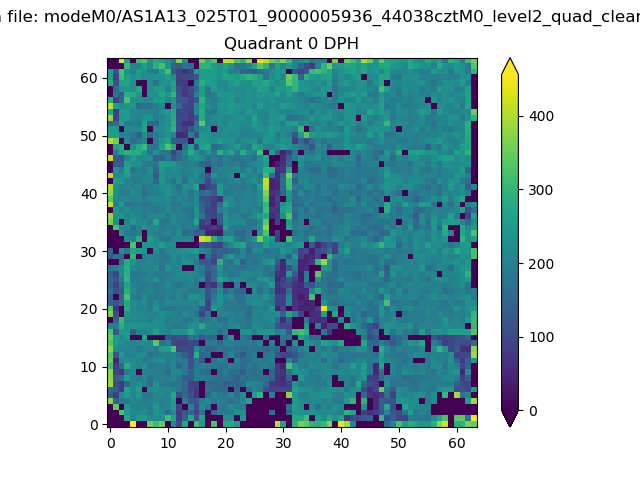 |
 |
Quadrant B |
|---|---|---|---|
| Quadrant D | 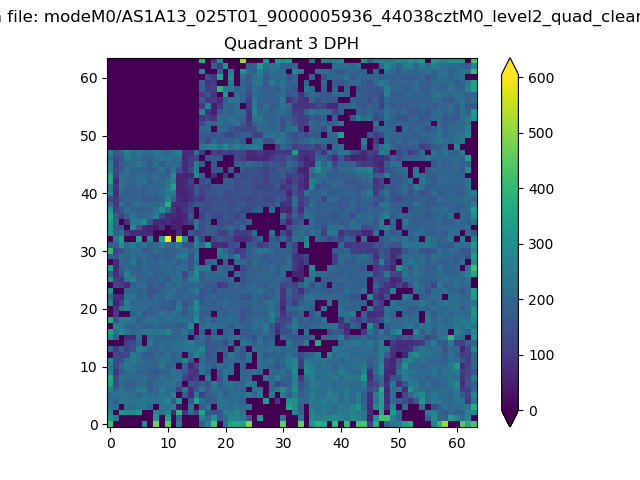 |
 |
Quadrant C |
| Plot type | Count rate plots | Images |
|---|---|---|
| Comparison with Poisson distribution Blue bars denote a histogram of data divided into 1 sec bins. Red curve is a Poisson curve with rate = median count rate of data. |
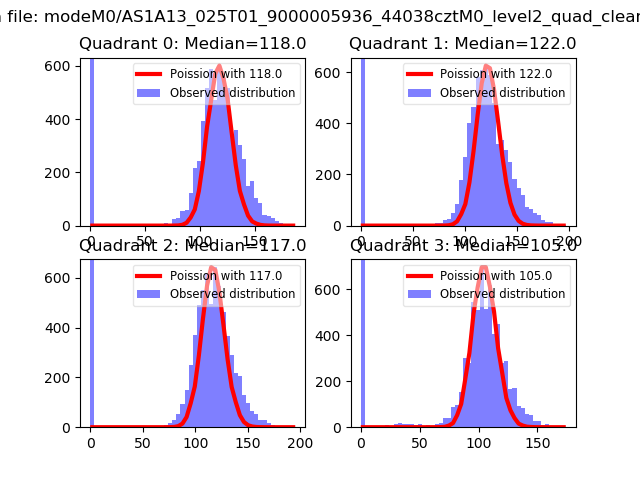 |
 |
| Quadrant-wise count rates Data is divided into 100 sec bins |
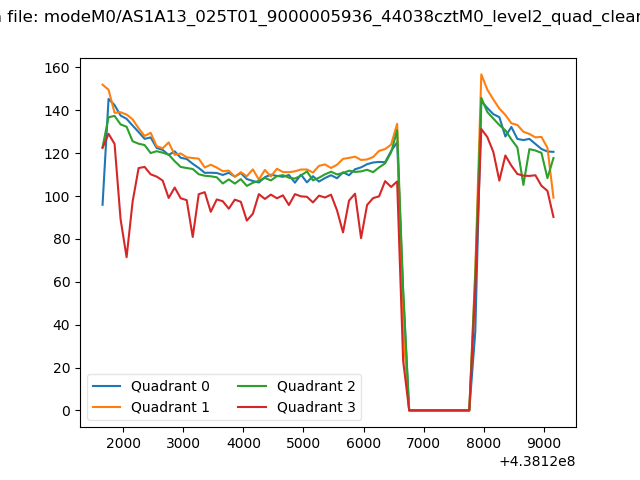 |
|
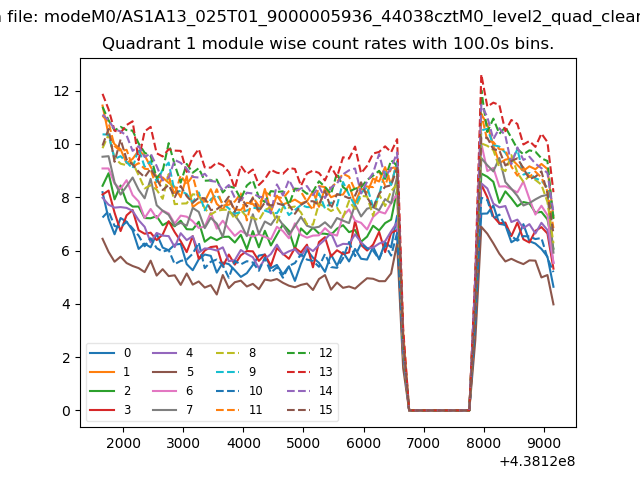
| Module-wise count rates for Quadrant A Data is divided into 100 sec bins |
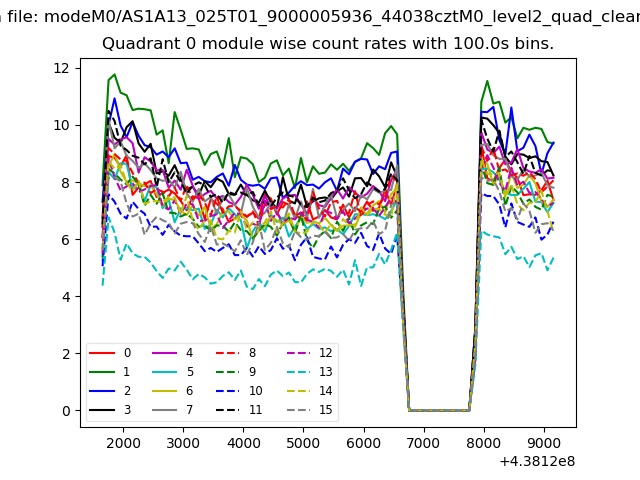 |
 |
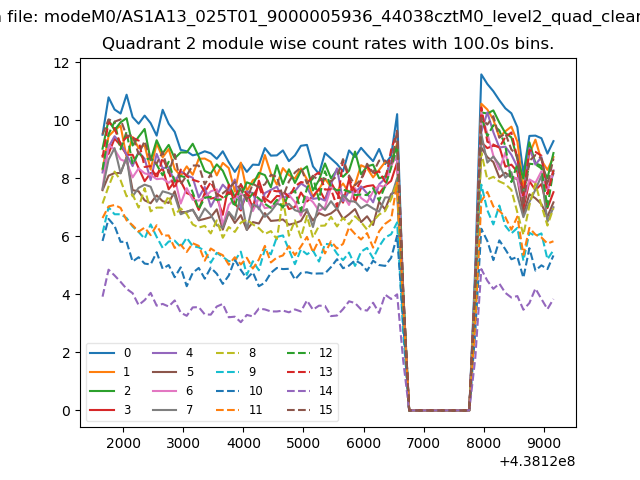
| Module-wise count rates for Quadrant B Data is divided into 100 sec bins |
 |
 |
| Module-wise count rates for Quadrant C Data is divided into 100 sec bins |
 |
 |
| Module-wise count rates for Quadrant D Data is divided into 100 sec bins |
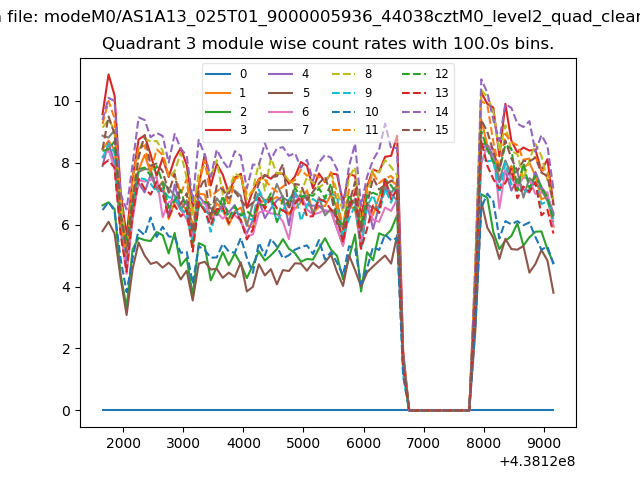 |
 |
| Parameter | Plot |
|---|---|
| CZT HV Monitor | 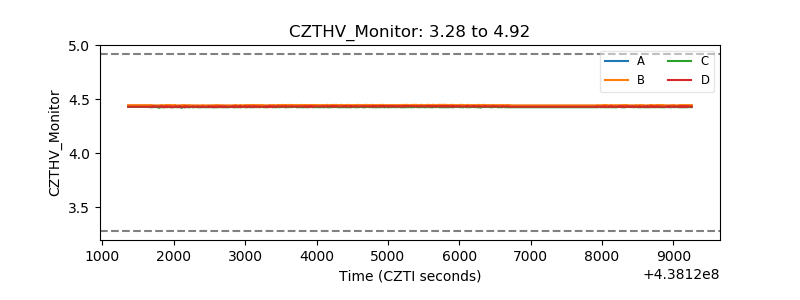 |
| D_VDD | 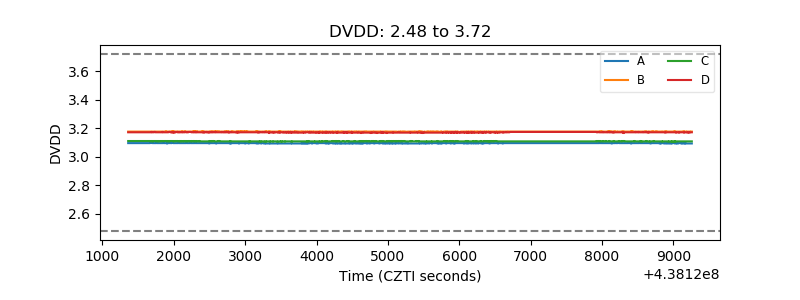 |
| Temperature 1 | 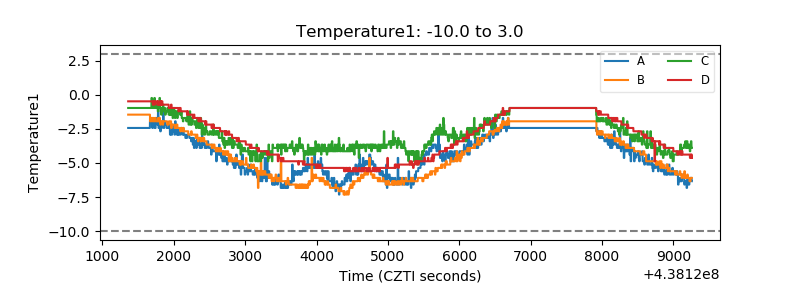 |
| Veto HV Monitor | 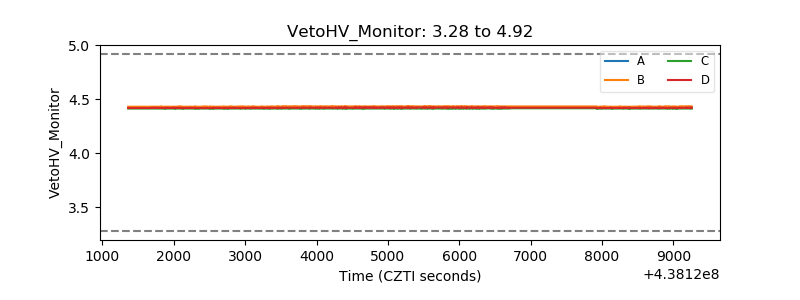 |
| Veto LLD | 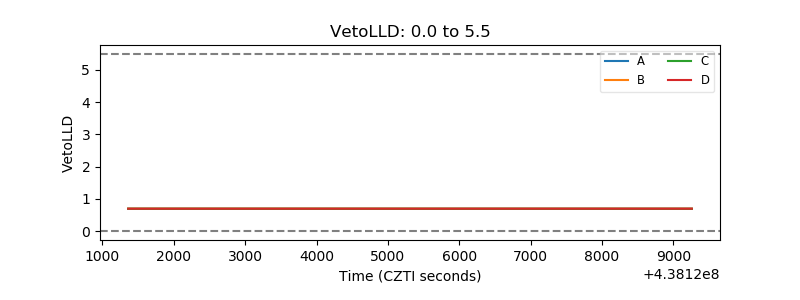 |
| Alpha Counter | 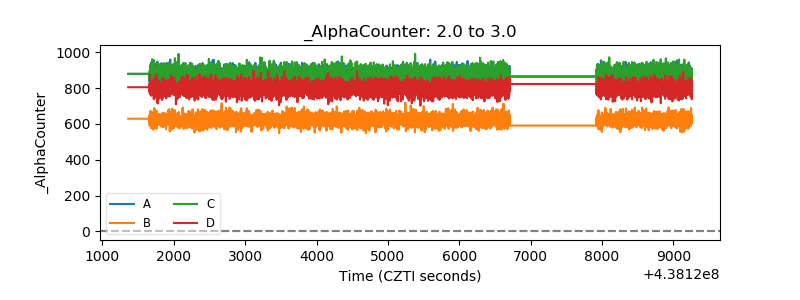 |
| _CPM_Rate | 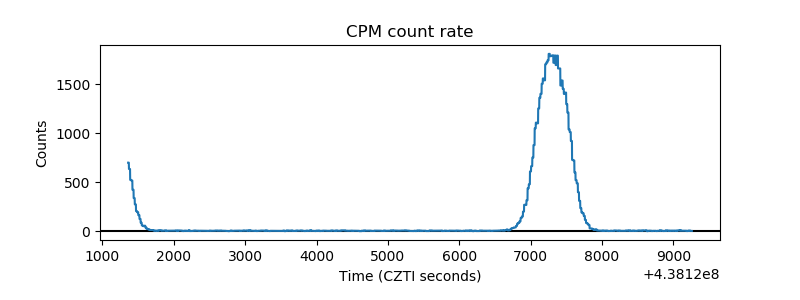 |
| CZT Counter | 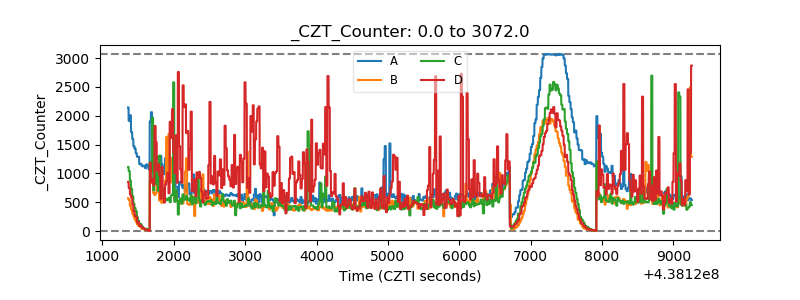 |
| +2.5 Volts monitor | 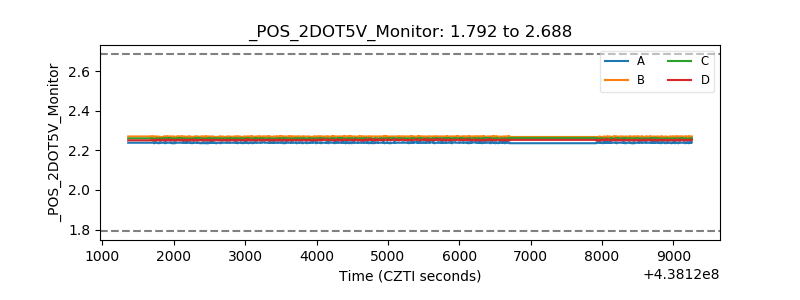 |
| +5 Volts monitor | 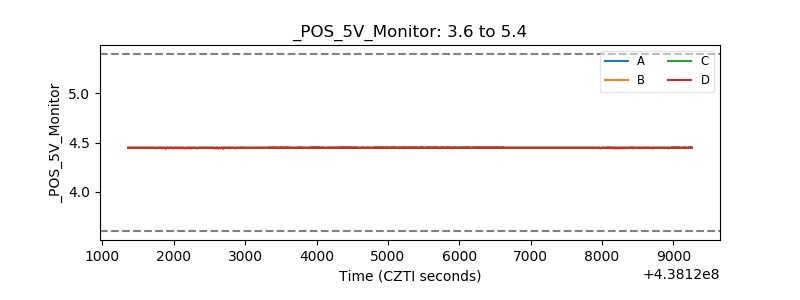 |
| _ROLL_ROT | 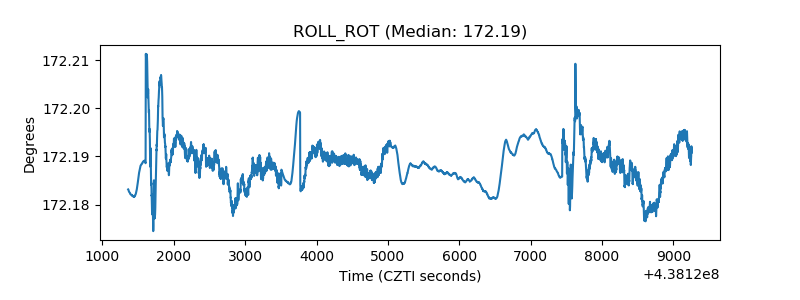 |
| _Roll_DEC | 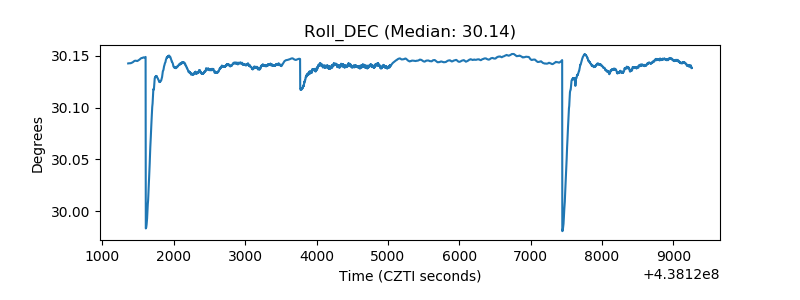 |
| _Roll_RA | 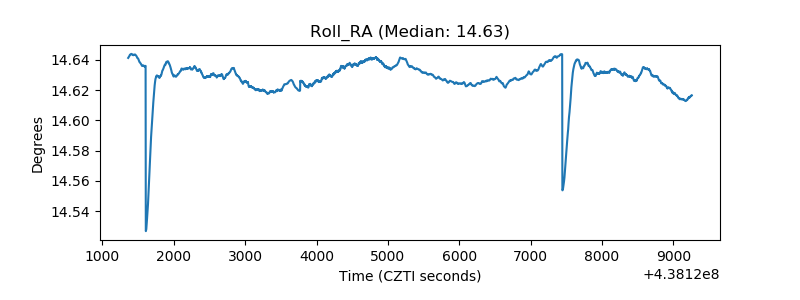 |
| Veto Counter | 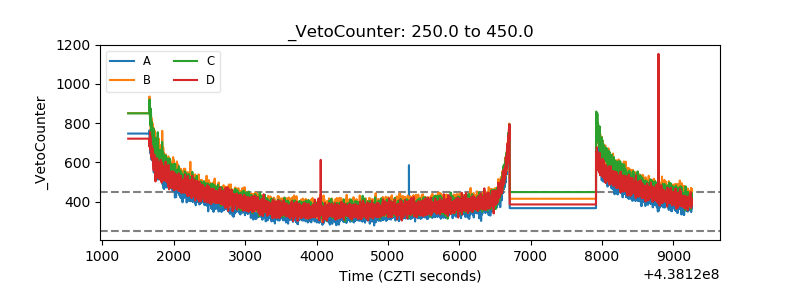 |