| Param | Original file | Final file |
|---|---|---|
| Filename | modeM0/AS1A13_025T01_9000005936_44039cztM0_level2.fits | modeM0/AS1A13_025T01_9000005936_44039cztM0_level2_quad_clean.evt |
| Size (bytes) | 445,821,120 | 109,609,920 |
| Size | 425.2 MB | 104.5 MB |
| Events in quadrant A | 4,214,334 | 741,427 |
| Events in quadrant B | 3,316,354 | 768,129 |
| Events in quadrant C | 3,623,117 | 727,822 |
| Events in quadrant D | 4,866,127 | 647,598 |
| Mode M9 | |||
|---|---|---|---|
| Quadrant | BADHDUFLAG | Total packets | Discarded packets |
| A | 0 | 13 | 0 |
| B | 0 | 14 | 0 |
| C | 0 | 14 | 0 |
| D | 0 | 14 | 0 |
| Mode M0 | |||
|---|---|---|---|
| Quadrant | BADHDUFLAG | Total packets | Discarded packets |
| A | 0 | 16910 | 2 |
| B | 0 | 13931 | 2 |
| C | 0 | 14925 | 2 |
| D | 0 | 18743 | 2 |
| Mode SS | |||
|---|---|---|---|
| Quadrant | BADHDUFLAG | Total packets | Discarded packets |
| A | 0 | 126 | 0 |
| B | 0 | 126 | 0 |
| C | 0 | 126 | 0 |
| D | 0 | 126 | 0 |
| Quadrant | Total seconds | Saturated seconds | Saturation percentage |
|---|---|---|---|
| A | 6221 | 91 | 1.462787% |
| B | 6221 | 81 | 1.302041% |
| C | 6221 | 112 | 1.800354% |
| D | 6221 | 299 | 4.806301% |
Noise dominated data is calculated using 1-second bins in cleaned event files. If a bin has >2000 counts, and if more than 50% of those come from <1% of pixels, then it is considered to be noise-dominated and hence unusable.
| Quadrant | # 1 sec bins | Bins with >0 counts | Bins with >2000 counts | High rate bins dominated by noise | Noise dominated (total time) | Noise dominated (detector-on time) | Marked lightcurve |
|---|---|---|---|---|---|---|---|
| A | 7476 | 6222 | 15 | 15 | 0.20% | 0.24% | 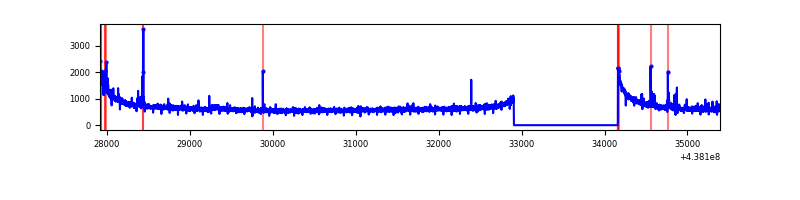 |
| B | 7476 | 6222 | 29 | 29 | 0.39% | 0.47% | 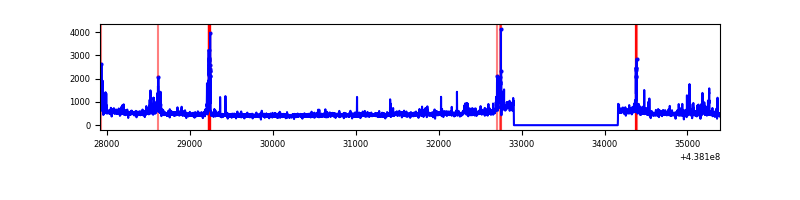 |
| C | 7476 | 6222 | 51 | 51 | 0.68% | 0.82% | 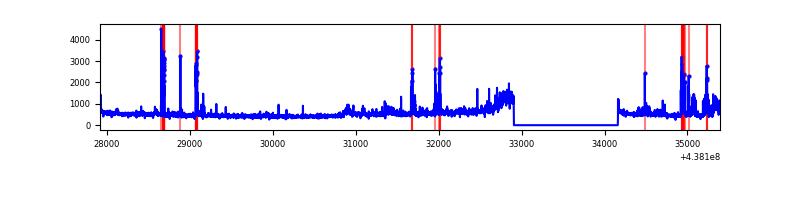 |
| D | 7476 | 6222 | 264 | 264 | 3.53% | 4.24% | 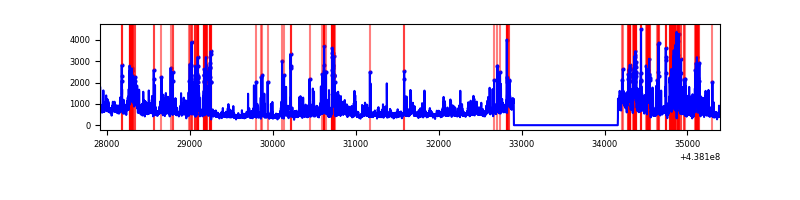 |
Top three noisy pixels from each quadrant. If the there are fewer than three noisy pixels in the level2.evt file, extra rows are filled as -1
| Pixel properties | Quadrant properties | ||||||
|---|---|---|---|---|---|---|---|
| Quadrant | DetID | PixID | Counts | Sigma | Mean | Median | Sigma |
| A | 10 | 83 | 1269397 | 8433.54 | 728 | 715 | 150.4 |
| A | 14 | 238 | 44023 | 287.89 | 728 | 715 | 150.4 |
| A | 15 | 223 | 31266 | 203.09 | 728 | 715 | 150.4 |
| B | 0 | 200 | 153742 | 1078.74 | 732 | 712 | 141.9 |
| B | 4 | 170 | 75581 | 527.77 | 732 | 712 | 141.9 |
| B | 4 | 171 | 56934 | 396.32 | 732 | 712 | 141.9 |
| C | 3 | 233 | 395350 | 2318.41 | 720 | 724 | 170.2 |
| C | 1 | 241 | 298933 | 1751.97 | 720 | 724 | 170.2 |
| C | 5 | 250 | 70772 | 411.53 | 720 | 724 | 170.2 |
| D | 1 | 52 | 1104456 | 6152.27 | 705 | 682 | 179.4 |
| D | 5 | 235 | 226285 | 1257.48 | 705 | 682 | 179.4 |
| D | 5 | 222 | 155906 | 865.2 | 705 | 682 | 179.4 |
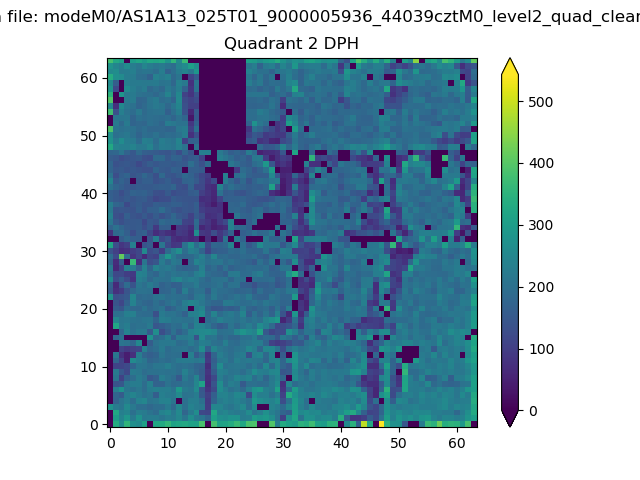
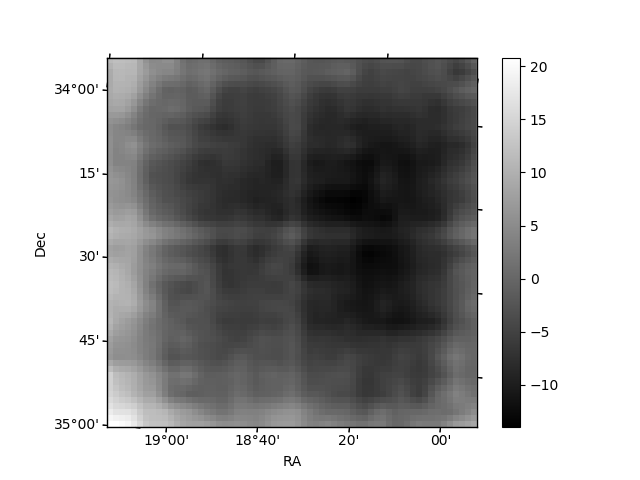
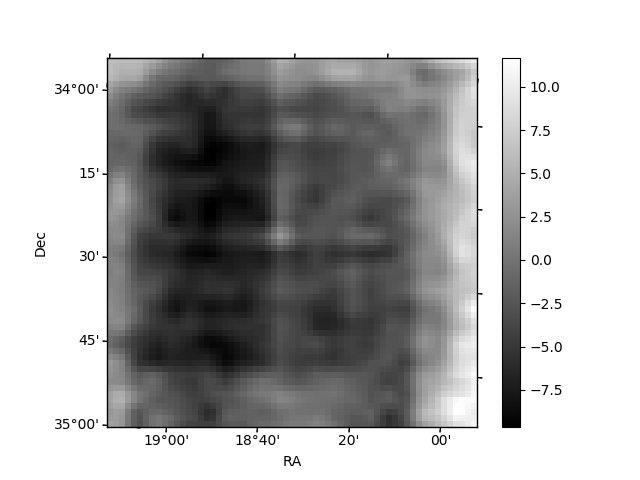
Histogram calculated using DETX and DETY for each event in the final _common_clean file
| Quadrant A | 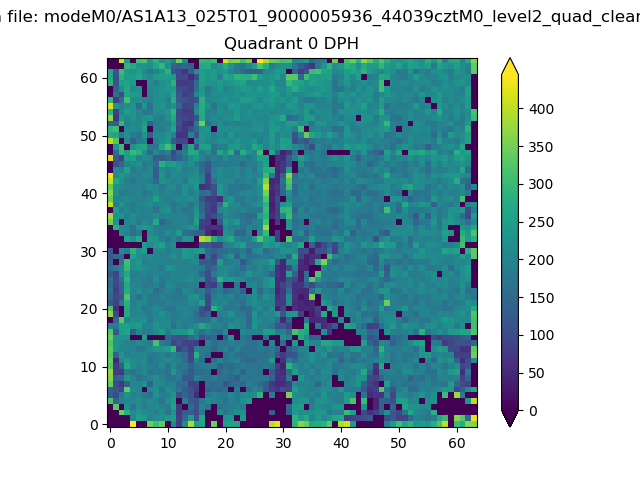 |
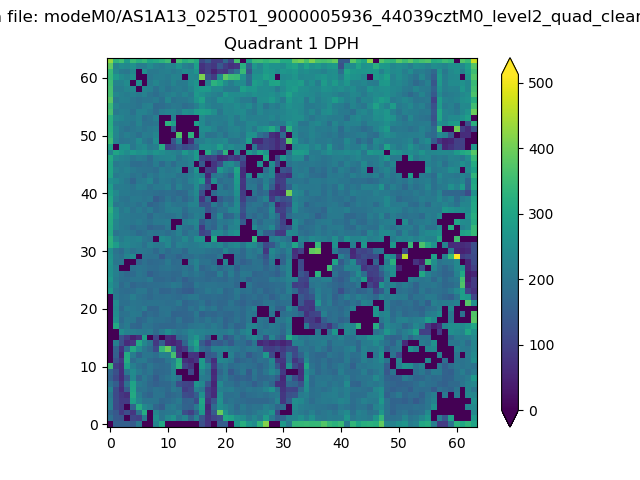 |
Quadrant B |
|---|---|---|---|
| Quadrant D | 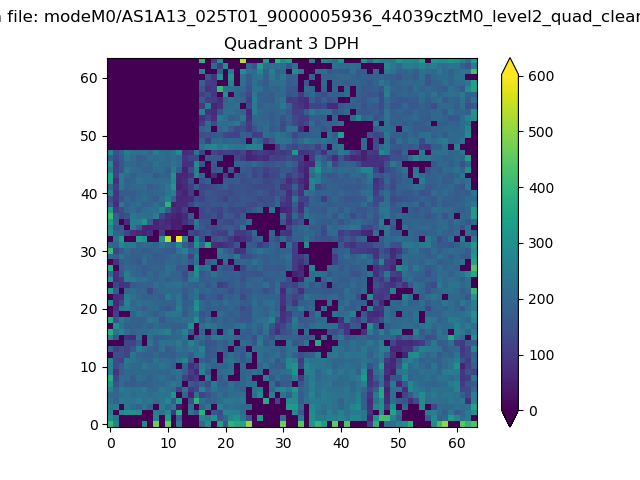 |
 |
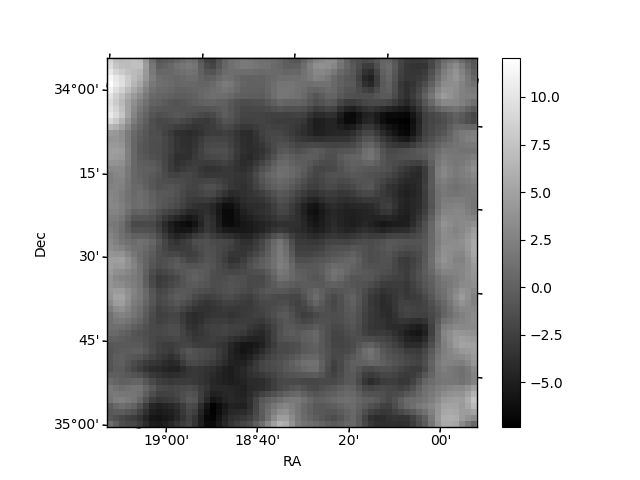
Quadrant C |
| Plot type | Count rate plots | Images |
|---|---|---|
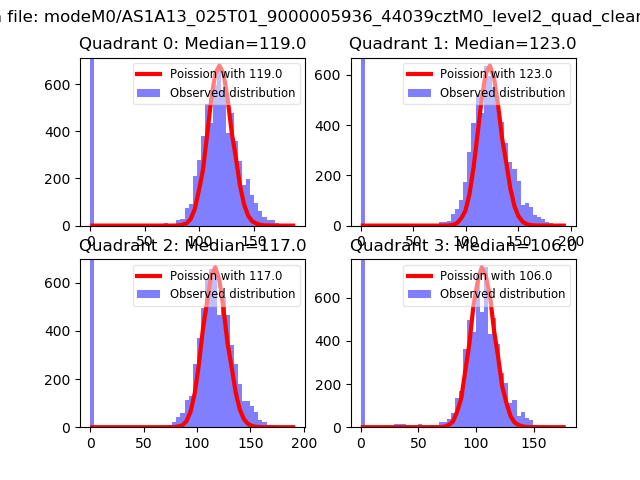
| Comparison with Poisson distribution Blue bars denote a histogram of data divided into 1 sec bins. Red curve is a Poisson curve with rate = median count rate of data. |
 |
 |
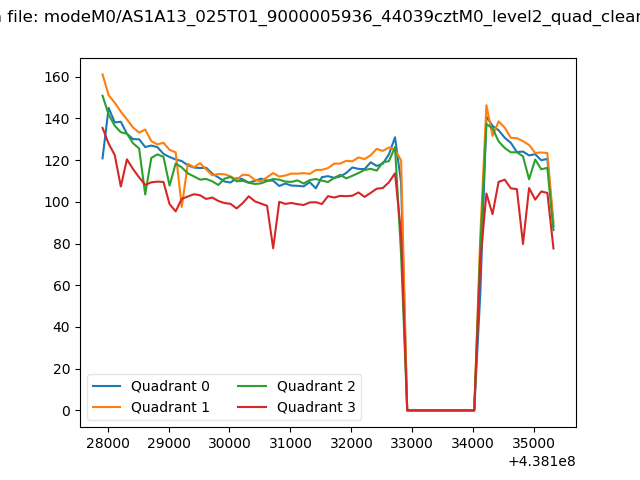
| Quadrant-wise count rates Data is divided into 100 sec bins |
 |
|
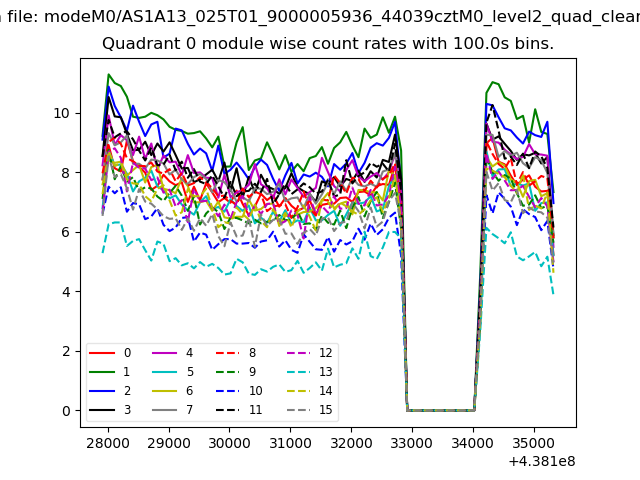
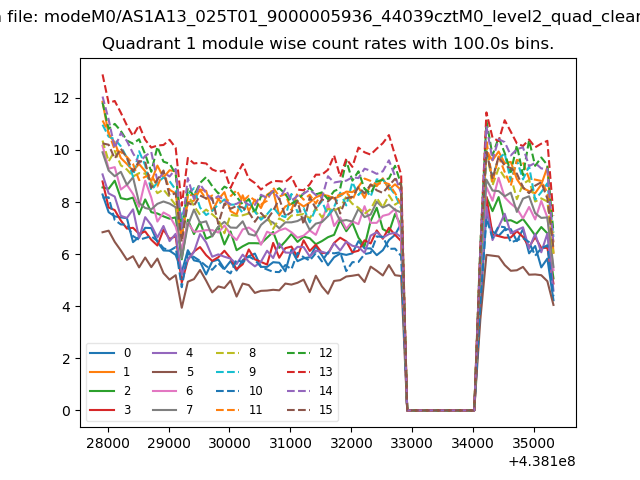
| Module-wise count rates for Quadrant A Data is divided into 100 sec bins |
 |
 |
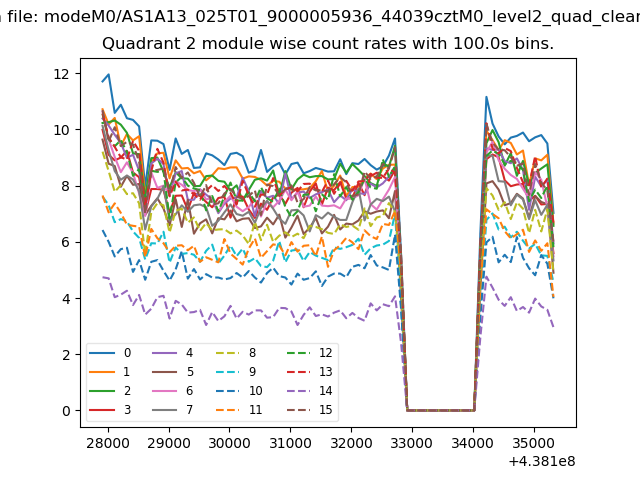
| Module-wise count rates for Quadrant B Data is divided into 100 sec bins |
 |
 |
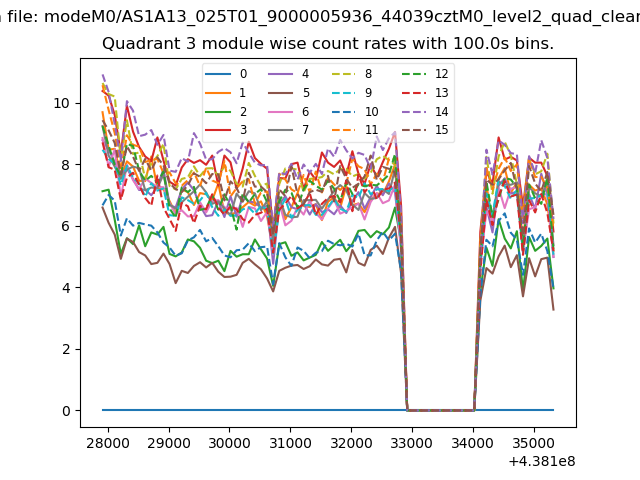
| Module-wise count rates for Quadrant C Data is divided into 100 sec bins |
 |
 |
| Module-wise count rates for Quadrant D Data is divided into 100 sec bins |
 |
 |
| Parameter | Plot |
|---|---|
| CZT HV Monitor | 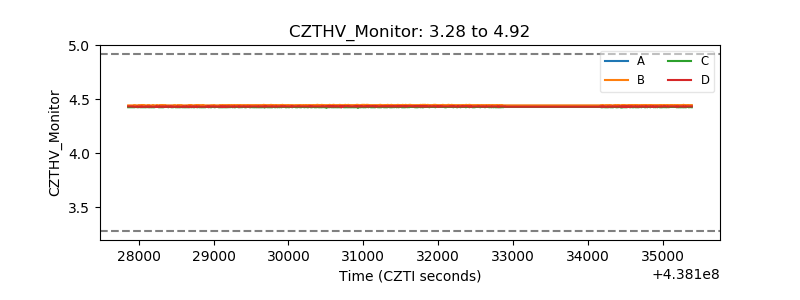 |
| D_VDD | 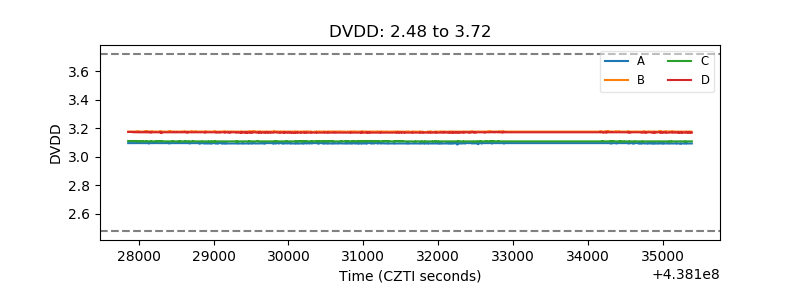 |
| Temperature 1 | 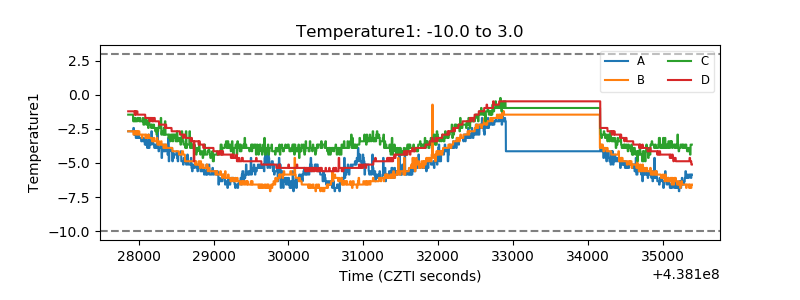 |
| Veto HV Monitor | 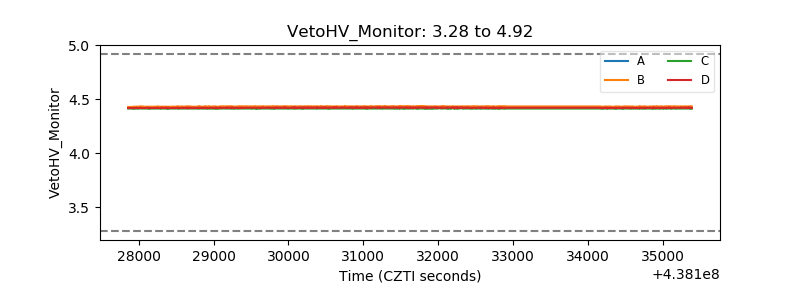 |
| Veto LLD | 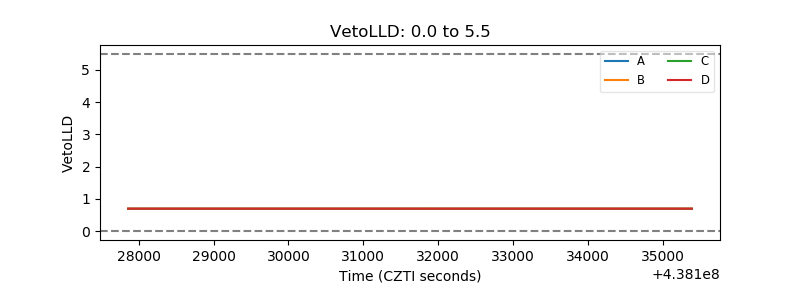 |
| Alpha Counter | 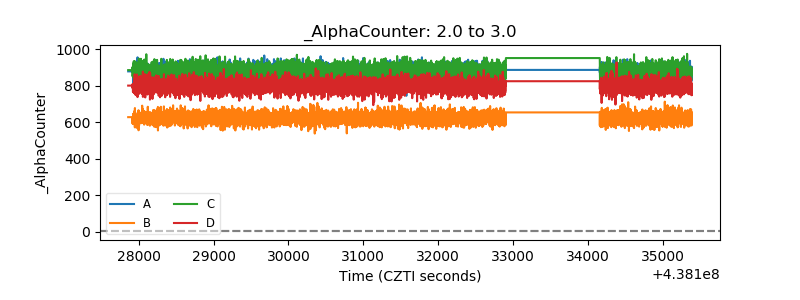 |
| _CPM_Rate | 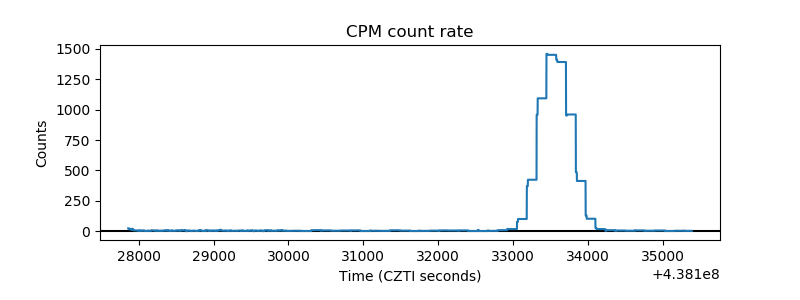 |
| CZT Counter | 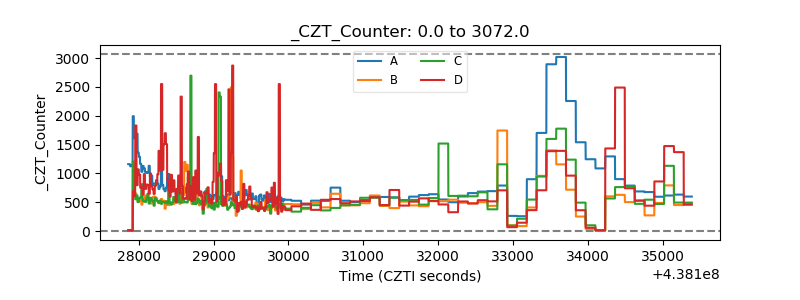 |
| +2.5 Volts monitor | 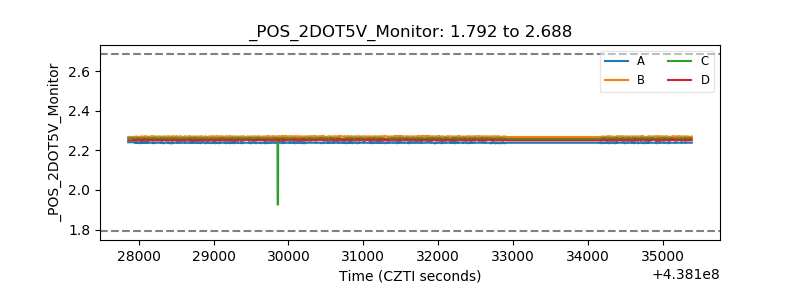 |
| +5 Volts monitor | 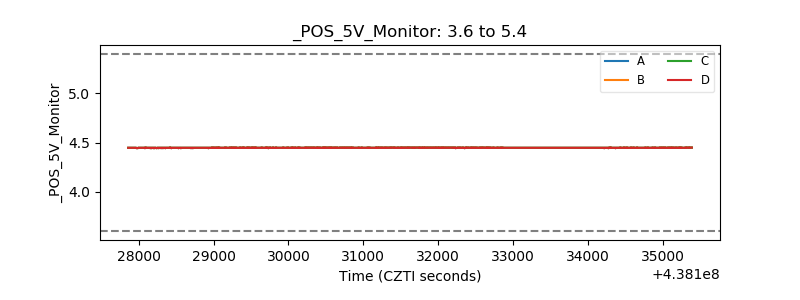 |
| _ROLL_ROT | 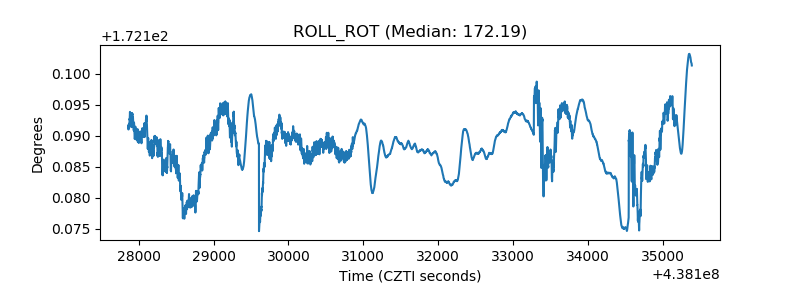 |
| _Roll_DEC | 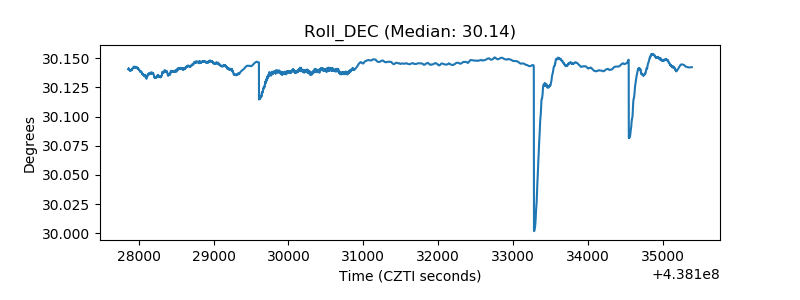 |
| _Roll_RA |  |
| Veto Counter | 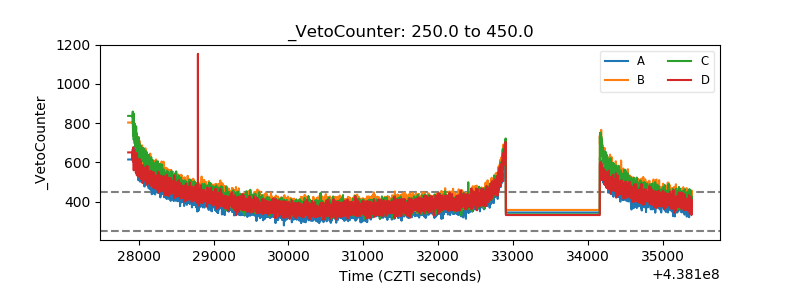 |