| Param | Original file | Final file |
|---|---|---|
| Filename | modeM0/AS1A13_025T01_9000005936_44040cztM0_level2.fits | modeM0/AS1A13_025T01_9000005936_44040cztM0_level2_quad_clean.evt |
| Size (bytes) | 486,288,000 | 109,900,800 |
| Size | 463.8 MB | 104.8 MB |
| Events in quadrant A | 4,340,601 | 743,088 |
| Events in quadrant B | 3,403,240 | 773,094 |
| Events in quadrant C | 3,938,086 | 731,458 |
| Events in quadrant D | 5,820,079 | 632,929 |
| Mode M9 | |||
|---|---|---|---|
| Quadrant | BADHDUFLAG | Total packets | Discarded packets |
| A | 0 | 26 | 0 |
| B | 0 | 26 | 0 |
| C | 0 | 26 | 0 |
| D | 0 | 26 | 0 |
| Mode M0 | |||
|---|---|---|---|
| Quadrant | BADHDUFLAG | Total packets | Discarded packets |
| A | 0 | 17143 | 2 |
| B | 0 | 14283 | 2 |
| C | 0 | 16019 | 2 |
| D | 0 | 21757 | 2 |
| Mode SS | |||
|---|---|---|---|
| Quadrant | BADHDUFLAG | Total packets | Discarded packets |
| A | 0 | 128 | 0 |
| B | 0 | 128 | 0 |
| C | 0 | 128 | 0 |
| D | 0 | 128 | 0 |
| Quadrant | Total seconds | Saturated seconds | Saturation percentage |
|---|---|---|---|
| A | 6426 | 136 | 2.116402% |
| B | 6426 | 99 | 1.540616% |
| C | 6426 | 177 | 2.754435% |
| D | 6426 | 549 | 8.543417% |
Noise dominated data is calculated using 1-second bins in cleaned event files. If a bin has >2000 counts, and if more than 50% of those come from <1% of pixels, then it is considered to be noise-dominated and hence unusable.
| Quadrant | # 1 sec bins | Bins with >0 counts | Bins with >2000 counts | High rate bins dominated by noise | Noise dominated (total time) | Noise dominated (detector-on time) | Marked lightcurve |
|---|---|---|---|---|---|---|---|
| A | 8891 | 6428 | 31 | 31 | 0.35% | 0.48% | 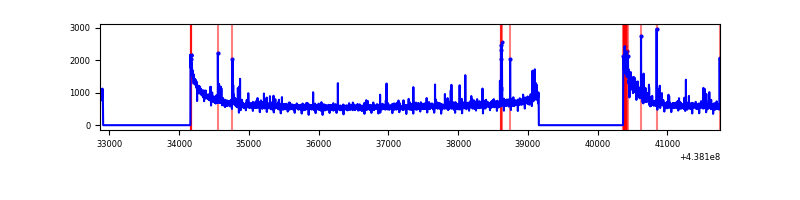 |
| B | 8891 | 6428 | 25 | 25 | 0.28% | 0.39% | 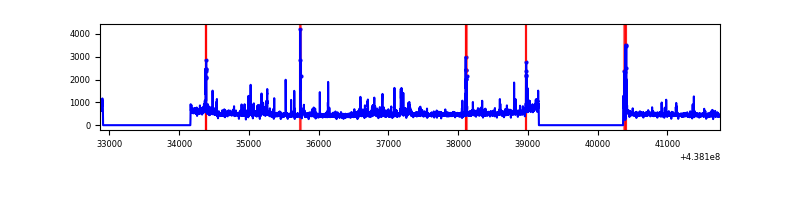 |
| C | 8891 | 6427 | 111 | 111 | 1.25% | 1.73% | 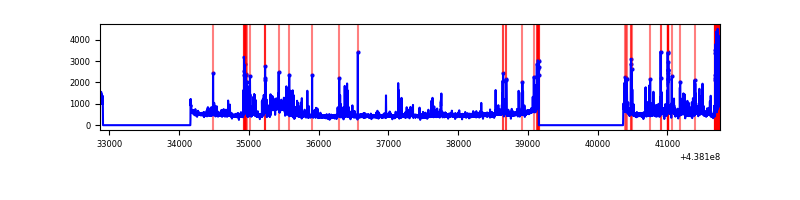 |
| D | 8891 | 6426 | 471 | 471 | 5.30% | 7.33% | 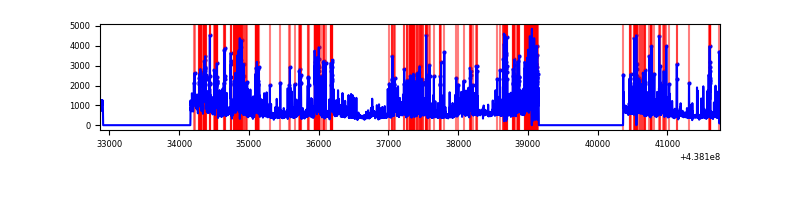 |
Top three noisy pixels from each quadrant. If the there are fewer than three noisy pixels in the level2.evt file, extra rows are filled as -1
| Pixel properties | Quadrant properties | ||||||
|---|---|---|---|---|---|---|---|
| Quadrant | DetID | PixID | Counts | Sigma | Mean | Median | Sigma |
| A | 10 | 83 | 1265699 | 8164.08 | 744 | 728 | 154.9 |
| A | 15 | 222 | 112753 | 723.0 | 744 | 728 | 154.9 |
| A | 14 | 238 | 66000 | 421.26 | 744 | 728 | 154.9 |
| B | 0 | 213 | 144493 | 979.54 | 748 | 725 | 146.8 |
| B | 4 | 171 | 78805 | 531.98 | 748 | 725 | 146.8 |
| B | 4 | 170 | 62465 | 420.65 | 748 | 725 | 146.8 |
| C | 1 | 241 | 898232 | 5199.59 | 732 | 737 | 172.6 |
| C | 3 | 233 | 81607 | 468.52 | 732 | 737 | 172.6 |
| C | 14 | 254 | 71567 | 410.35 | 732 | 737 | 172.6 |
| D | 1 | 52 | 2193588 | 12452.18 | 700 | 680 | 176.1 |
| D | 5 | 235 | 376411 | 2133.55 | 700 | 680 | 176.1 |
| D | 2 | 249 | 131389 | 742.22 | 700 | 680 | 176.1 |
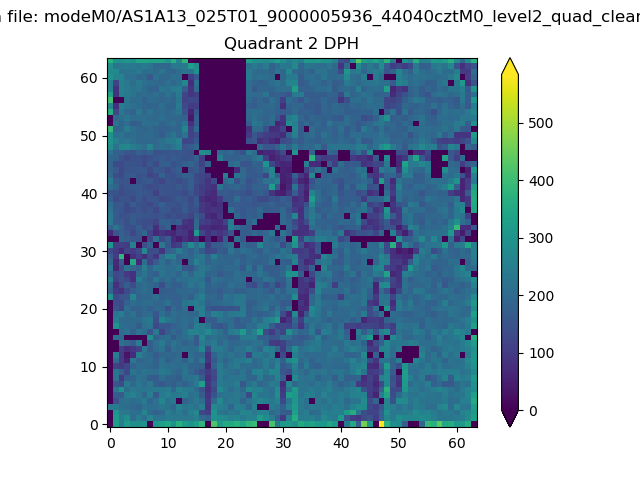
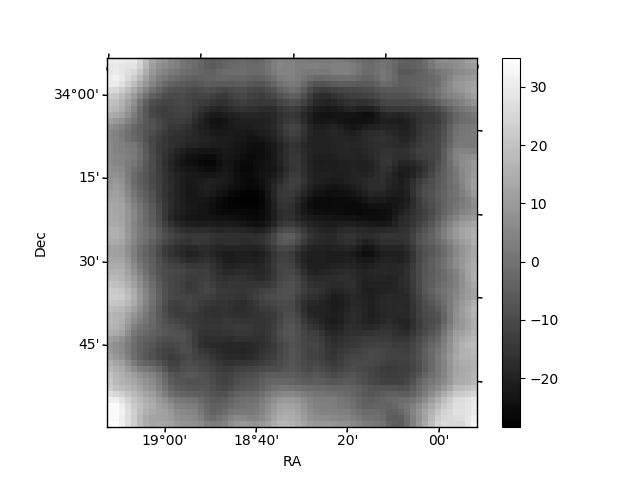
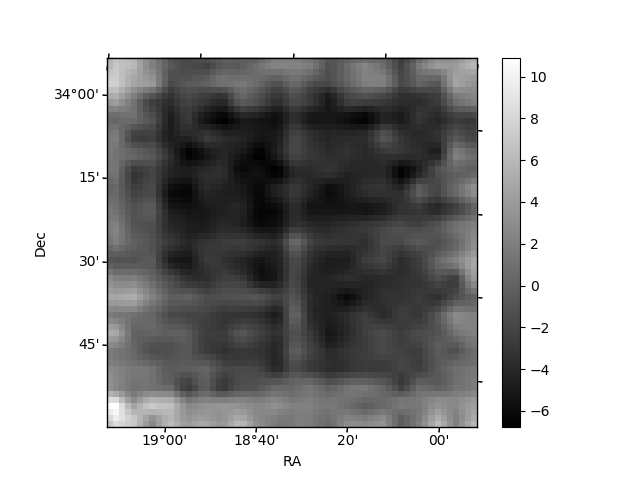
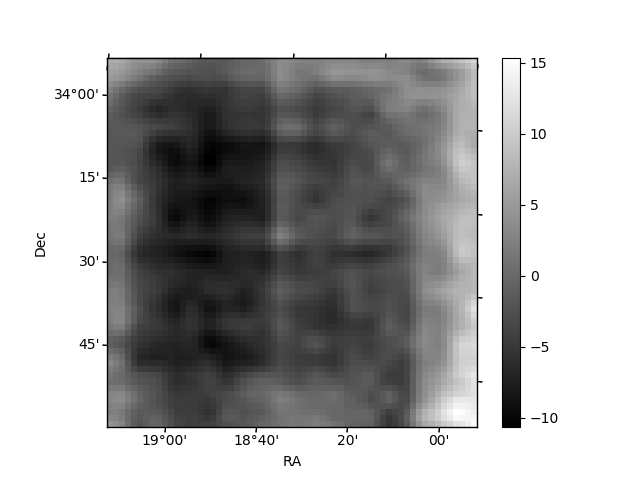
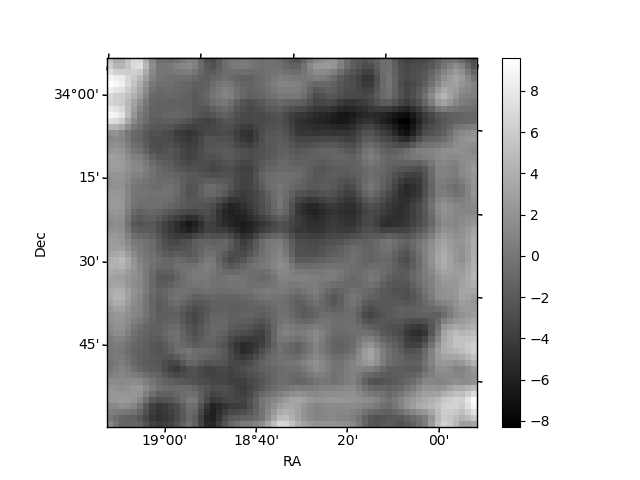
Histogram calculated using DETX and DETY for each event in the final _common_clean file
| Quadrant A | 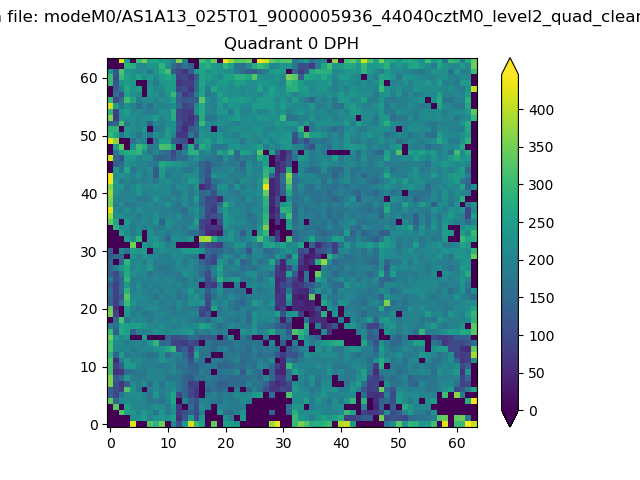 |
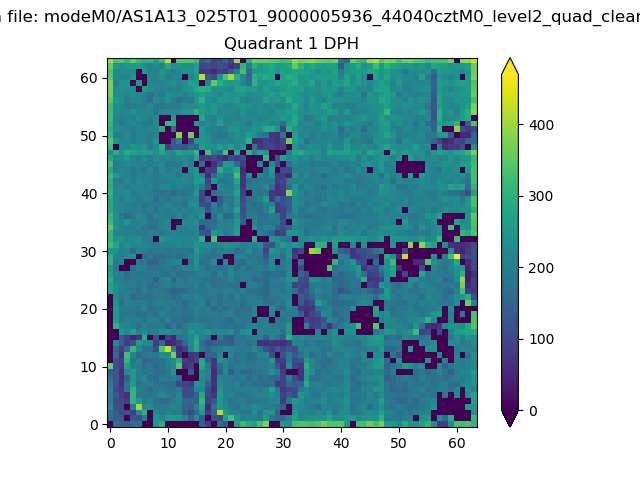 |
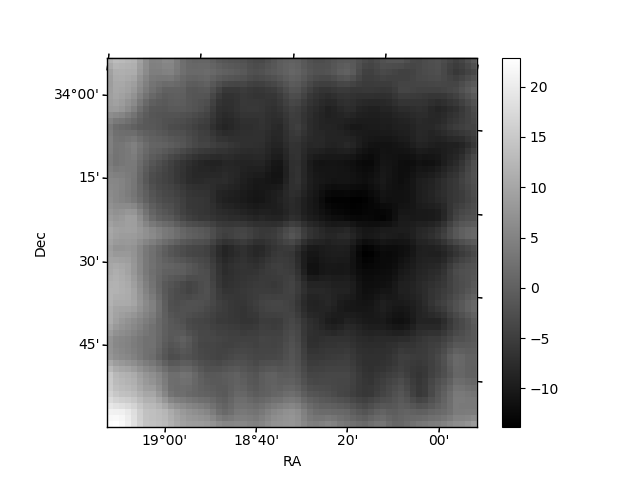
Quadrant B |
|---|---|---|---|
| Quadrant D | 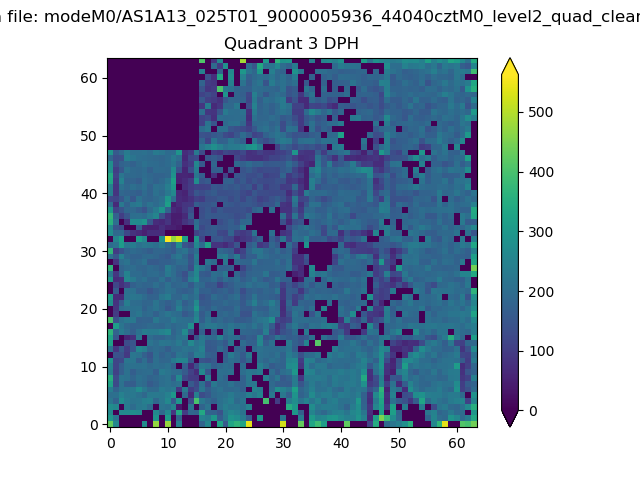 |
 |
Quadrant C |
| Plot type | Count rate plots | Images |
|---|---|---|
| Comparison with Poisson distribution Blue bars denote a histogram of data divided into 1 sec bins. Red curve is a Poisson curve with rate = median count rate of data. |
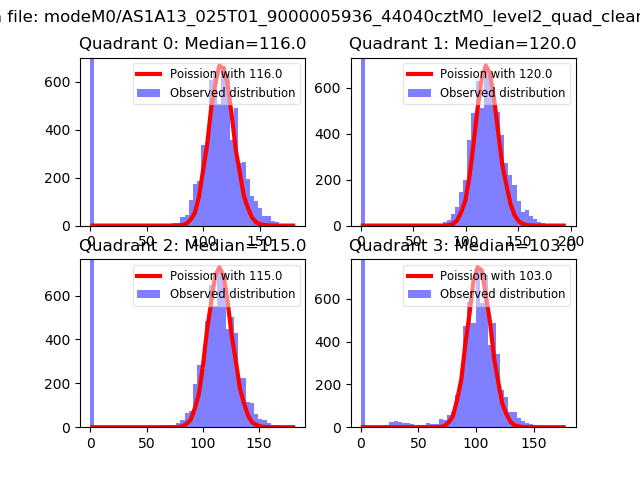 |
 |
| Quadrant-wise count rates Data is divided into 100 sec bins |
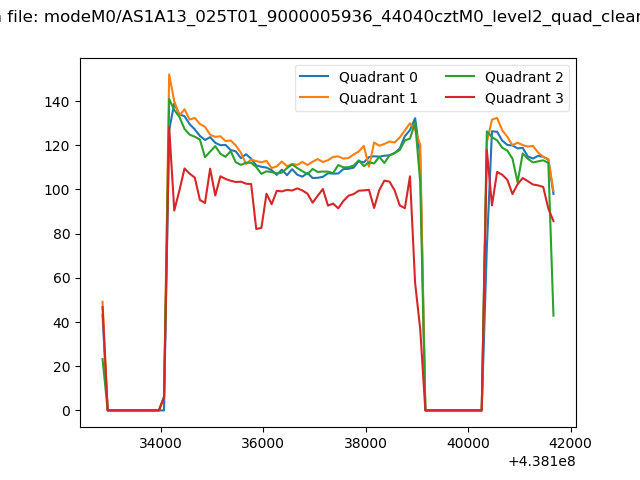 |
|
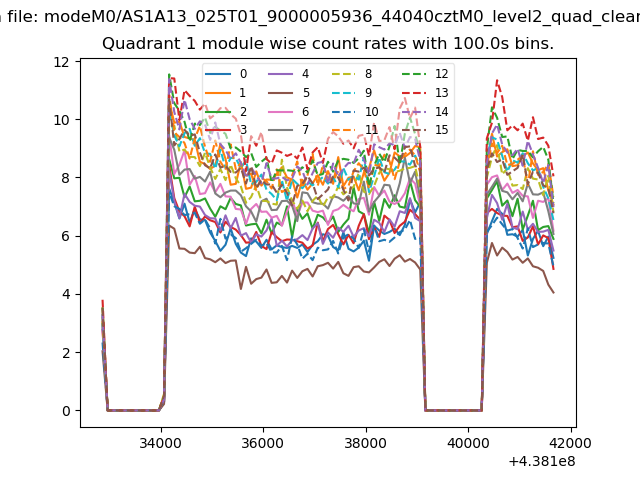
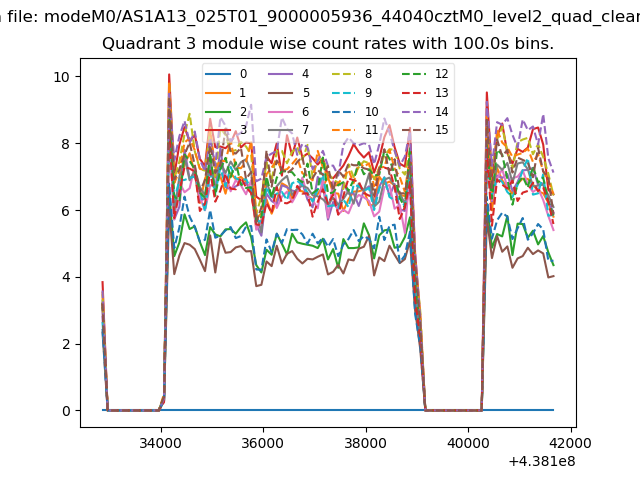
| Module-wise count rates for Quadrant A Data is divided into 100 sec bins |
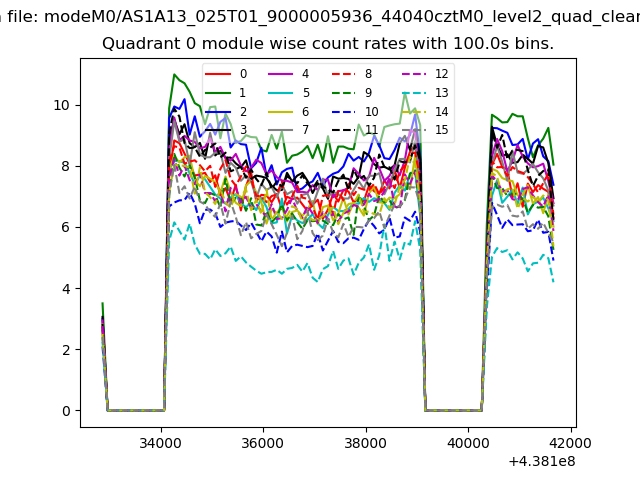 |
 |
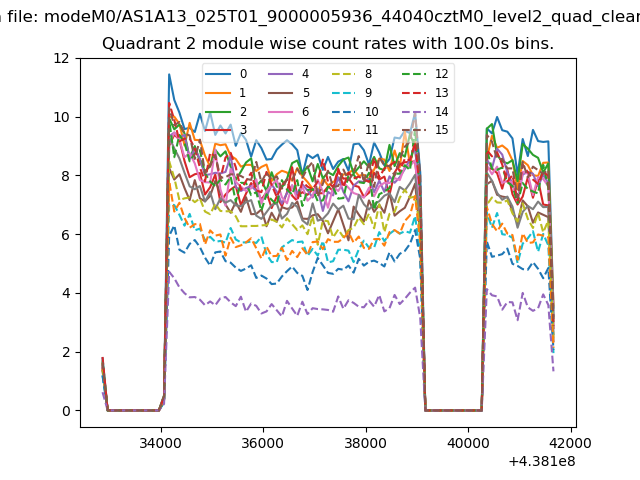
| Module-wise count rates for Quadrant B Data is divided into 100 sec bins |
 |
 |
| Module-wise count rates for Quadrant C Data is divided into 100 sec bins |
 |
 |
| Module-wise count rates for Quadrant D Data is divided into 100 sec bins |
 |
 |
| Parameter | Plot |
|---|---|
| CZT HV Monitor | 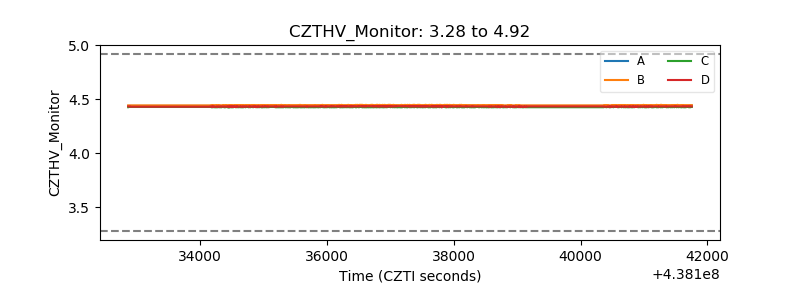 |
| D_VDD | 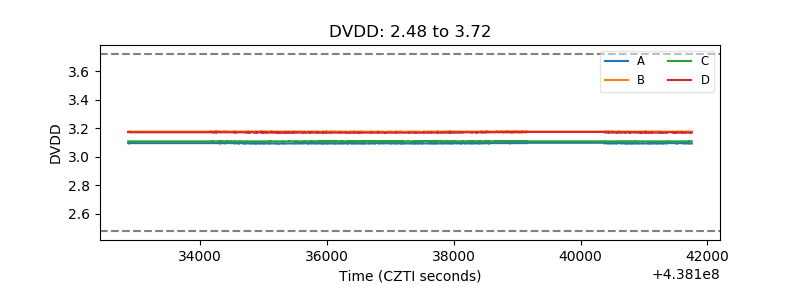 |
| Temperature 1 | 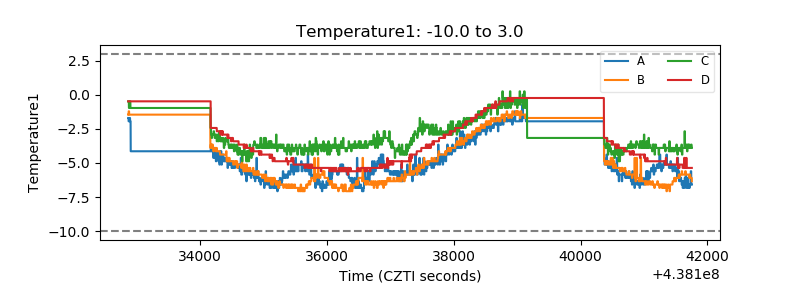 |
| Veto HV Monitor | 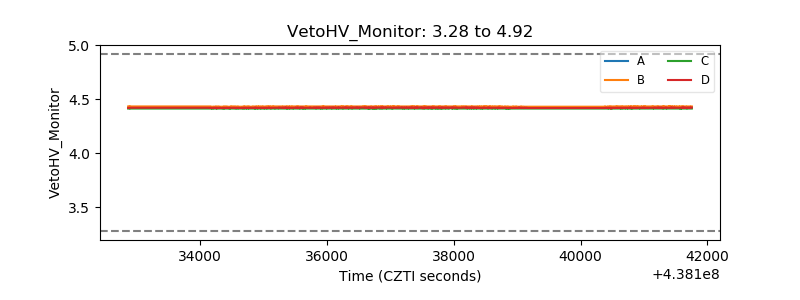 |
| Veto LLD | 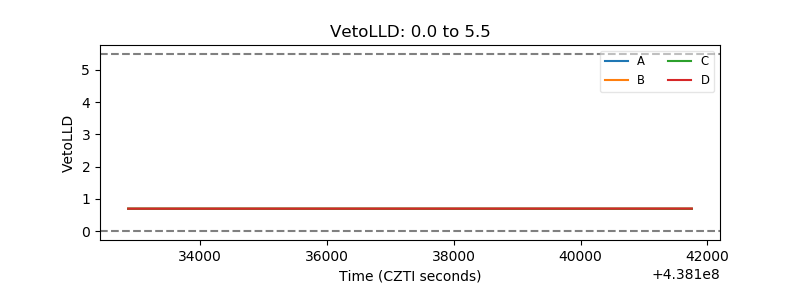 |
| Alpha Counter | 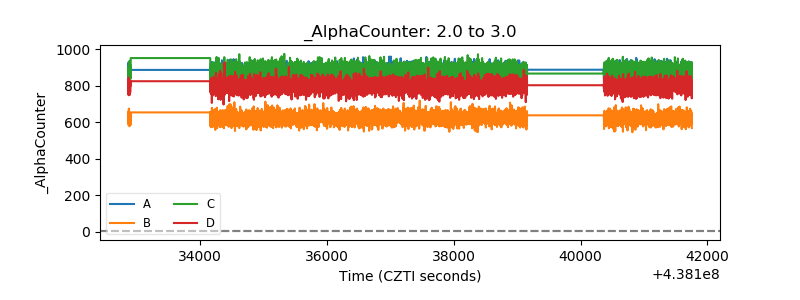 |
| _CPM_Rate | 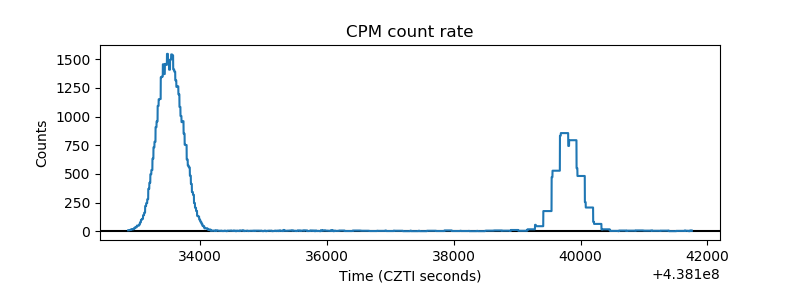 |
| CZT Counter | 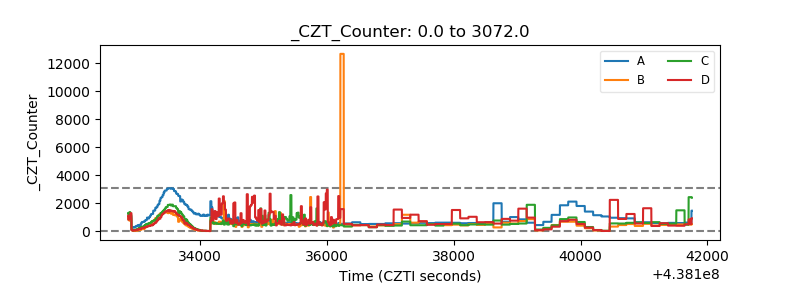 |
| +2.5 Volts monitor | 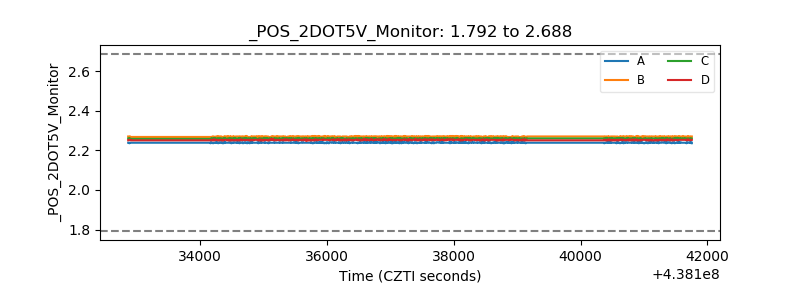 |
| +5 Volts monitor | 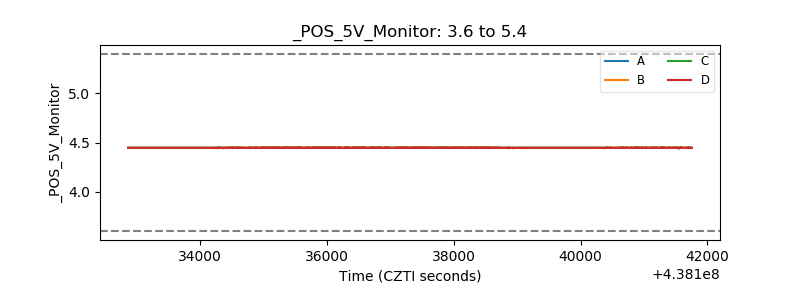 |
| _ROLL_ROT | 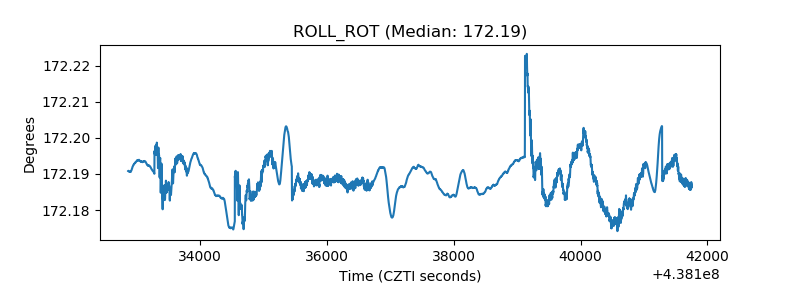 |
| _Roll_DEC | 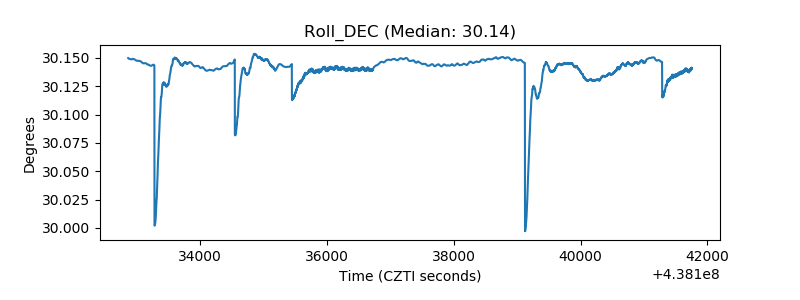 |
| _Roll_RA | 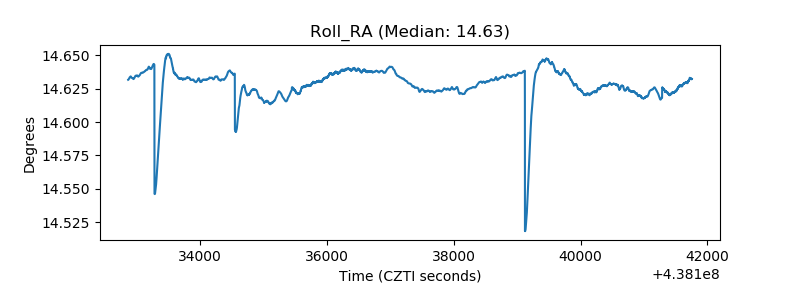 |
| Veto Counter | 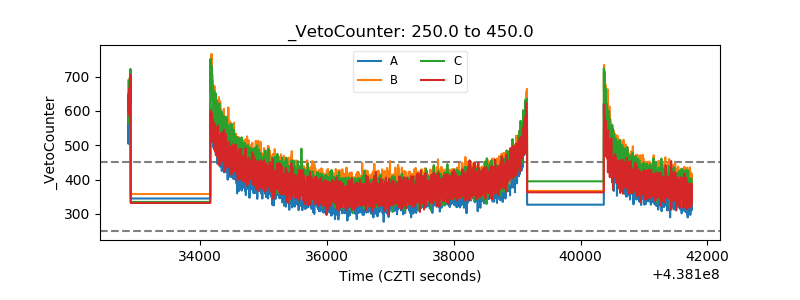 |