| Param | Original file | Final file |
|---|---|---|
| Filename | modeM0/AS1A13_025T01_9000005936_44041cztM0_level2.fits | modeM0/AS1A13_025T01_9000005936_44041cztM0_level2_quad_clean.evt |
| Size (bytes) | 552,660,480 | 106,067,520 |
| Size | 527.1 MB | 101.2 MB |
| Events in quadrant A | 6,224,622 | 652,814 |
| Events in quadrant B | 3,294,198 | 761,611 |
| Events in quadrant C | 5,068,110 | 697,397 |
| Events in quadrant D | 5,355,500 | 637,382 |
| Mode M9 | |||
|---|---|---|---|
| Quadrant | BADHDUFLAG | Total packets | Discarded packets |
| A | 0 | 24 | 0 |
| B | 0 | 24 | 0 |
| C | 0 | 24 | 0 |
| D | 0 | 24 | 0 |
| Mode M0 | |||
|---|---|---|---|
| Quadrant | BADHDUFLAG | Total packets | Discarded packets |
| A | 0 | 22847 | 2 |
| B | 0 | 14218 | 2 |
| C | 0 | 19632 | 2 |
| D | 0 | 20552 | 2 |
| Mode SS | |||
|---|---|---|---|
| Quadrant | BADHDUFLAG | Total packets | Discarded packets |
| A | 0 | 134 | 0 |
| B | 0 | 134 | 0 |
| C | 0 | 134 | 0 |
| D | 0 | 134 | 0 |
| Quadrant | Total seconds | Saturated seconds | Saturation percentage |
|---|---|---|---|
| A | 6638 | 901 | 13.573365% |
| B | 6639 | 103 | 1.551438% |
| C | 6639 | 525 | 7.907817% |
| D | 6639 | 499 | 7.516192% |
Noise dominated data is calculated using 1-second bins in cleaned event files. If a bin has >2000 counts, and if more than 50% of those come from <1% of pixels, then it is considered to be noise-dominated and hence unusable.
| Quadrant | # 1 sec bins | Bins with >0 counts | Bins with >2000 counts | High rate bins dominated by noise | Noise dominated (total time) | Noise dominated (detector-on time) | Marked lightcurve |
|---|---|---|---|---|---|---|---|
| A | 8898 | 6640 | 622 | 622 | 6.99% | 9.37% | 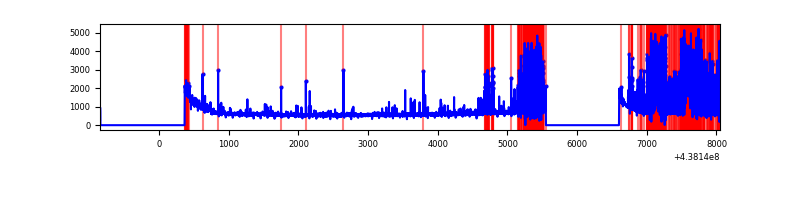 |
| B | 8899 | 6641 | 15 | 15 | 0.17% | 0.23% | 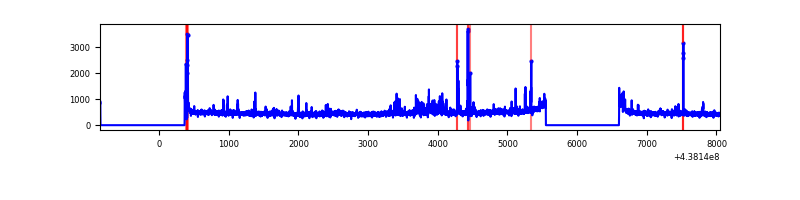 |
| C | 8899 | 6640 | 505 | 505 | 5.67% | 7.61% | 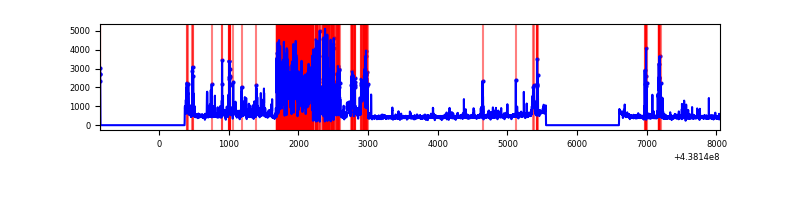 |
| D | 8899 | 6640 | 359 | 359 | 4.03% | 5.41% | 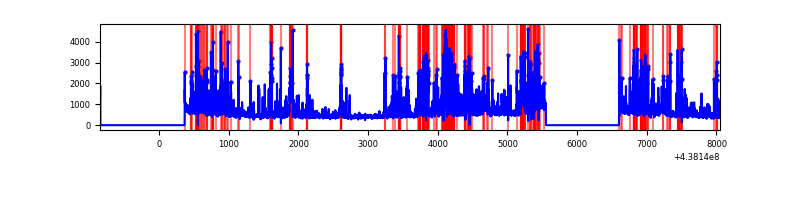 |
Top three noisy pixels from each quadrant. If the there are fewer than three noisy pixels in the level2.evt file, extra rows are filled as -1
| Pixel properties | Quadrant properties | ||||||
|---|---|---|---|---|---|---|---|
| Quadrant | DetID | PixID | Counts | Sigma | Mean | Median | Sigma |
| A | 15 | 222 | 2228124 | 15325.5 | 705 | 692 | 145.3 |
| A | 10 | 83 | 1231228 | 8466.51 | 705 | 692 | 145.3 |
| A | 14 | 238 | 19112 | 126.74 | 705 | 692 | 145.3 |
| B | 0 | 213 | 111074 | 736.5 | 759 | 733 | 149.8 |
| B | 0 | 200 | 52402 | 344.88 | 759 | 733 | 149.8 |
| B | 15 | 36 | 41610 | 272.85 | 759 | 733 | 149.8 |
| C | 1 | 241 | 1943997 | 11408.51 | 726 | 730 | 170.3 |
| C | 14 | 254 | 238254 | 1394.45 | 726 | 730 | 170.3 |
| C | 3 | 233 | 28062 | 160.46 | 726 | 730 | 170.3 |
| D | 1 | 52 | 1182488 | 6482.82 | 718 | 697 | 182.3 |
| D | 5 | 235 | 509885 | 2793.19 | 718 | 697 | 182.3 |
| D | 5 | 222 | 336351 | 1841.26 | 718 | 697 | 182.3 |
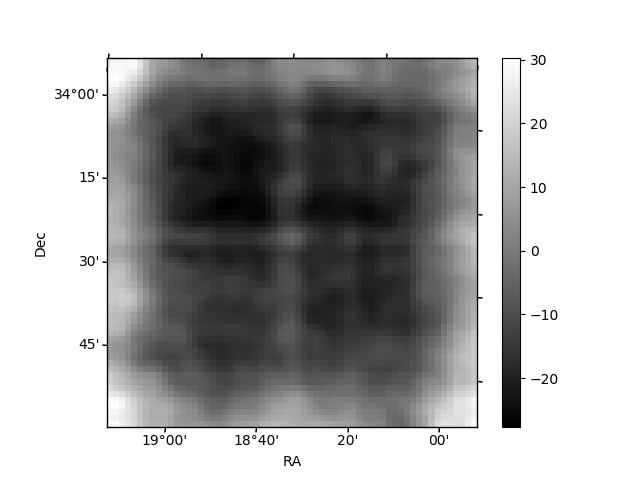
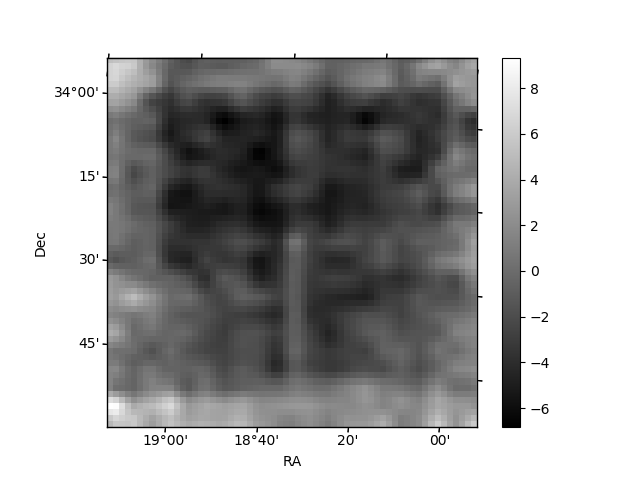
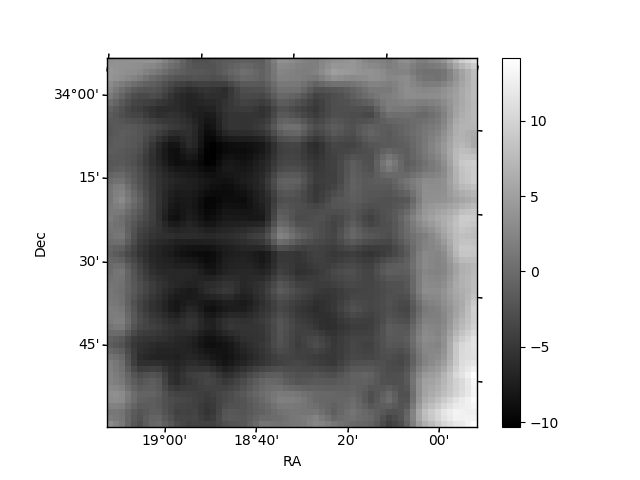
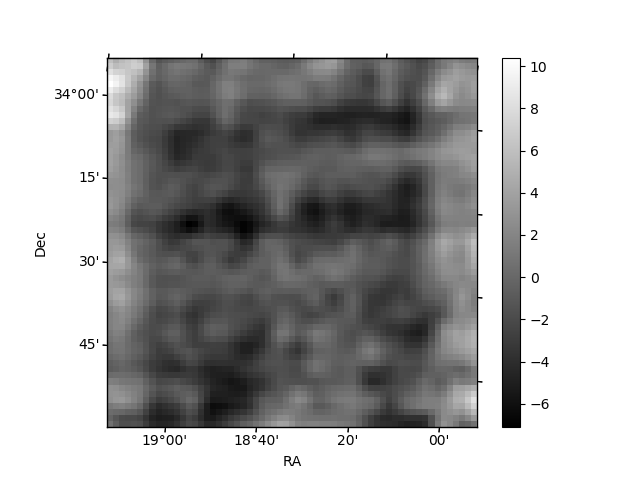
Histogram calculated using DETX and DETY for each event in the final _common_clean file
| Quadrant A | 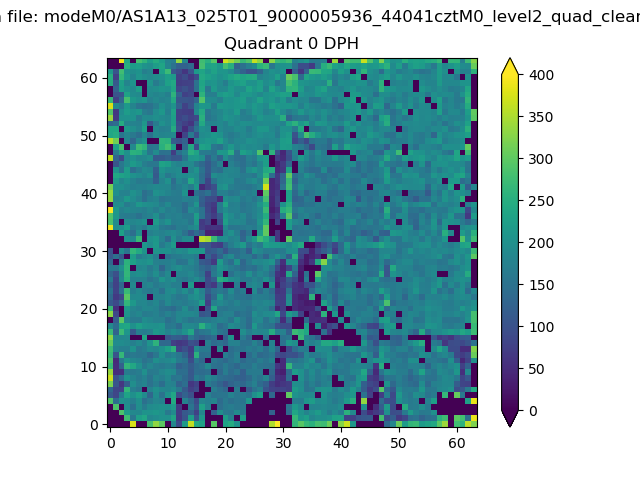 |
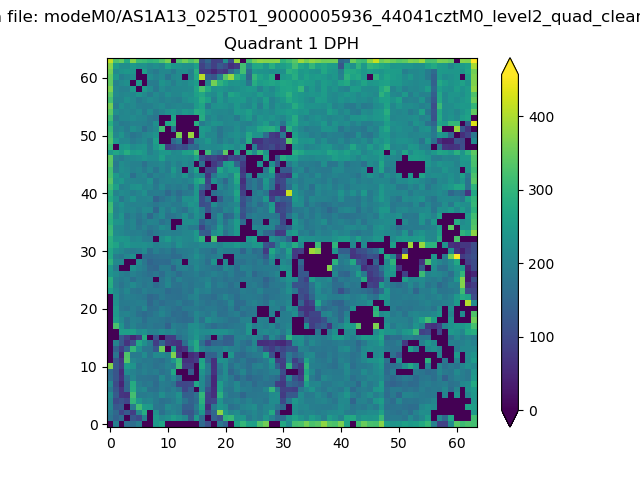 |
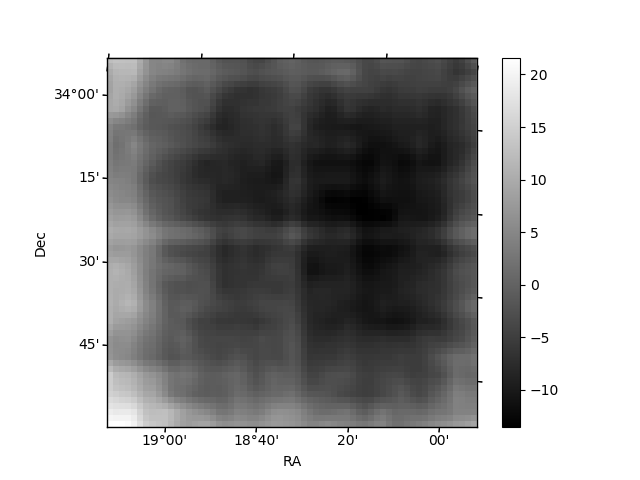
Quadrant B |
|---|---|---|---|
| Quadrant D | 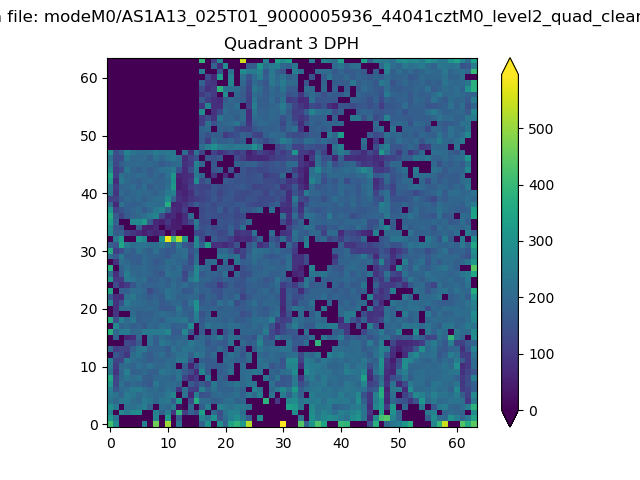 |
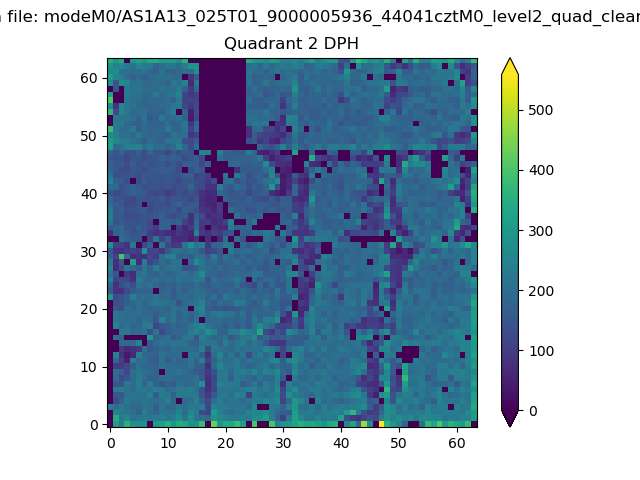 |
Quadrant C |
| Plot type | Count rate plots | Images |
|---|---|---|
| Comparison with Poisson distribution Blue bars denote a histogram of data divided into 1 sec bins. Red curve is a Poisson curve with rate = median count rate of data. |
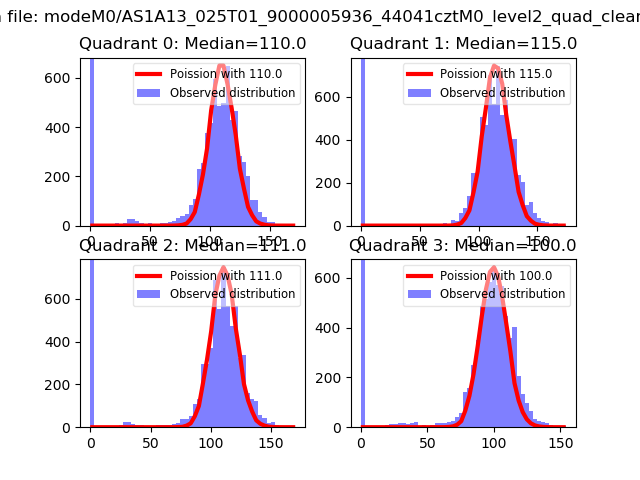 |
 |
| Quadrant-wise count rates Data is divided into 100 sec bins |
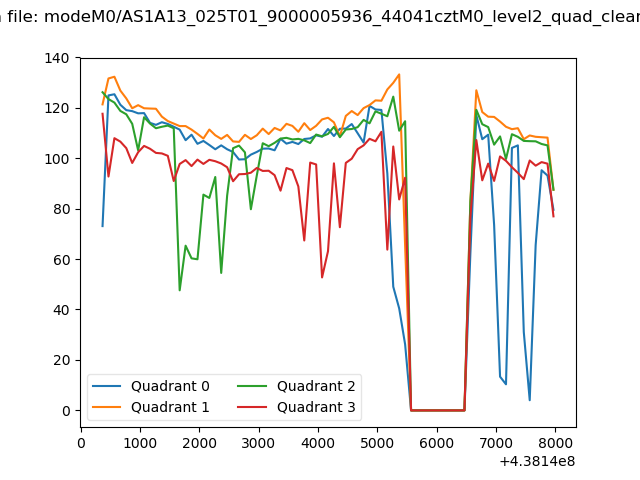 |
|
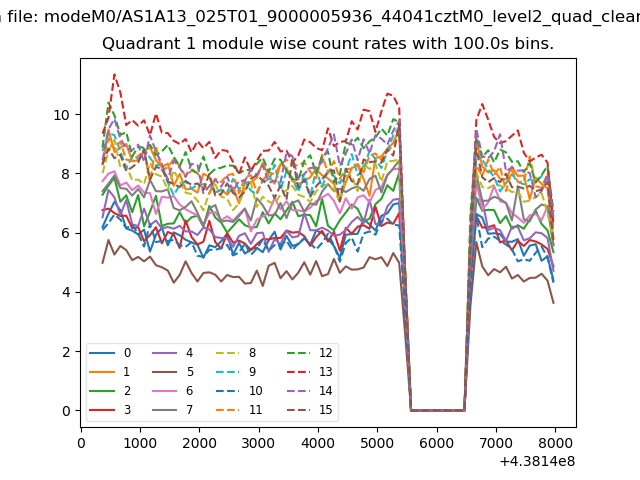
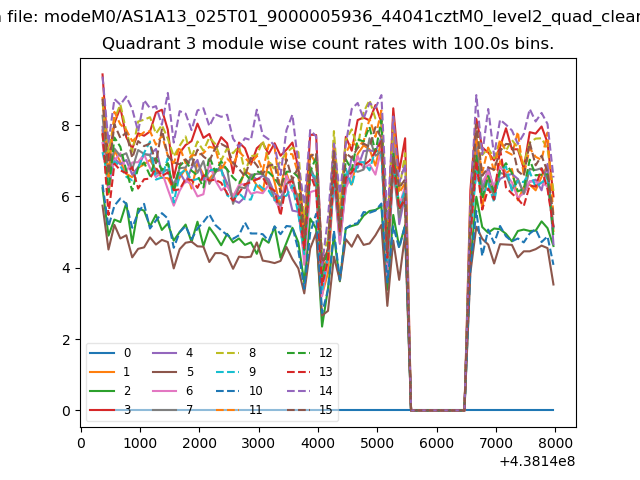
| Module-wise count rates for Quadrant A Data is divided into 100 sec bins |
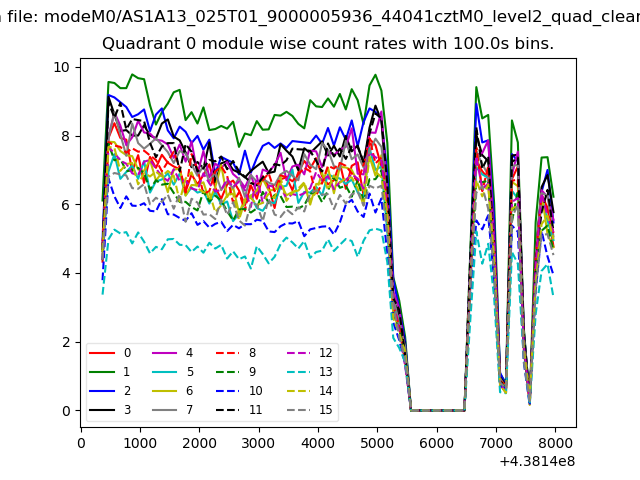 |
 |
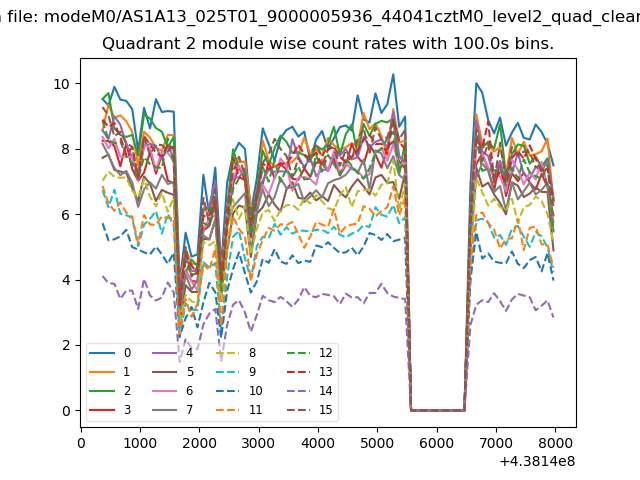
| Module-wise count rates for Quadrant B Data is divided into 100 sec bins |
 |
 |
| Module-wise count rates for Quadrant C Data is divided into 100 sec bins |
 |
 |
| Module-wise count rates for Quadrant D Data is divided into 100 sec bins |
 |
 |
| Parameter | Plot |
|---|---|
| CZT HV Monitor | 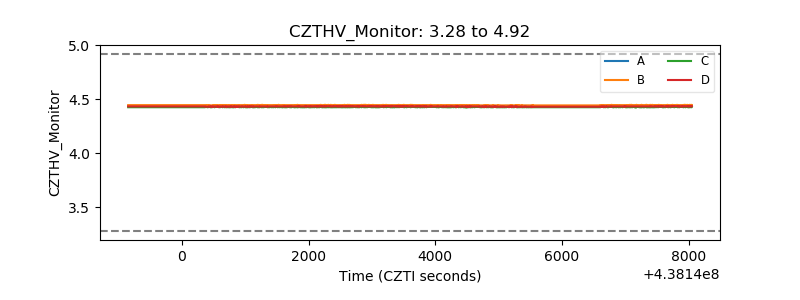 |
| D_VDD | 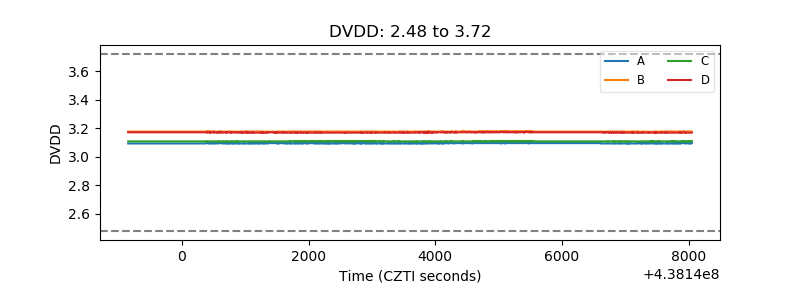 |
| Temperature 1 | 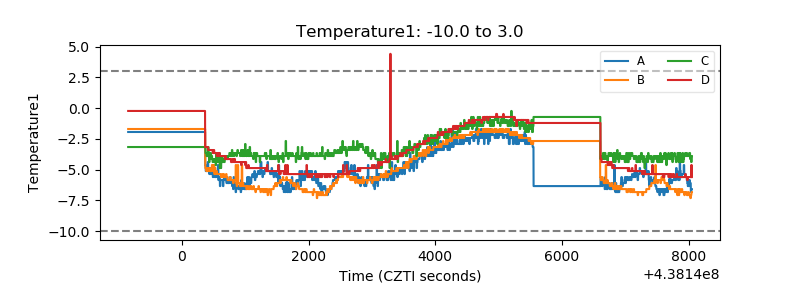 |
| Veto HV Monitor | 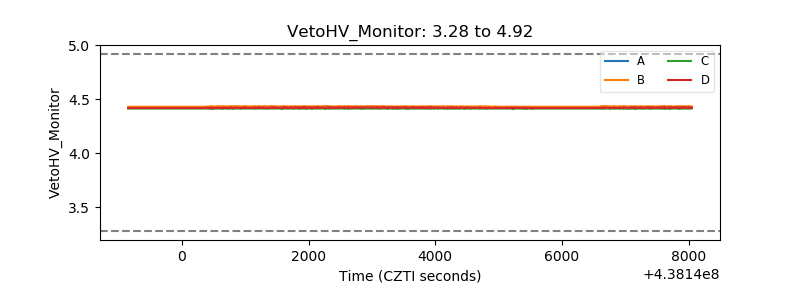 |
| Veto LLD | 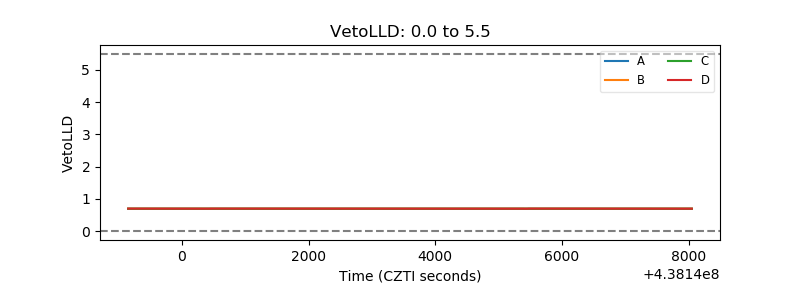 |
| Alpha Counter | 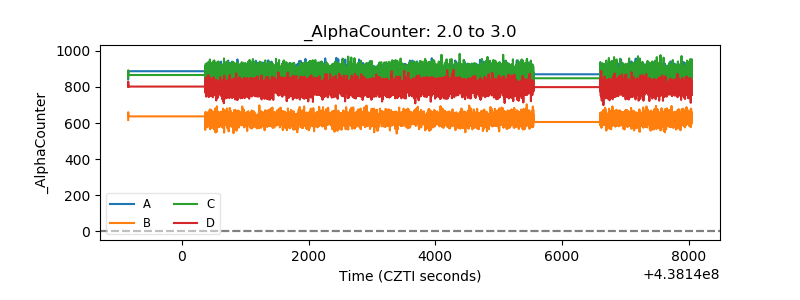 |
| _CPM_Rate | 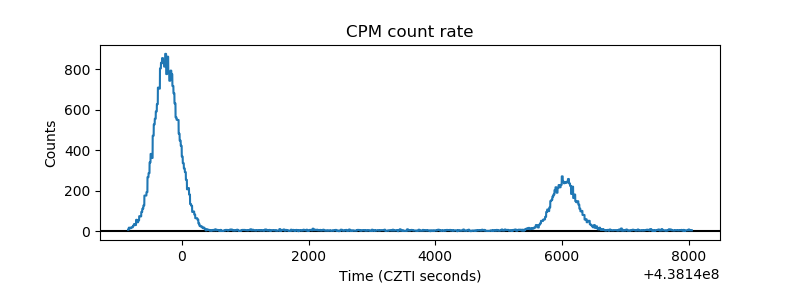 |
| CZT Counter | 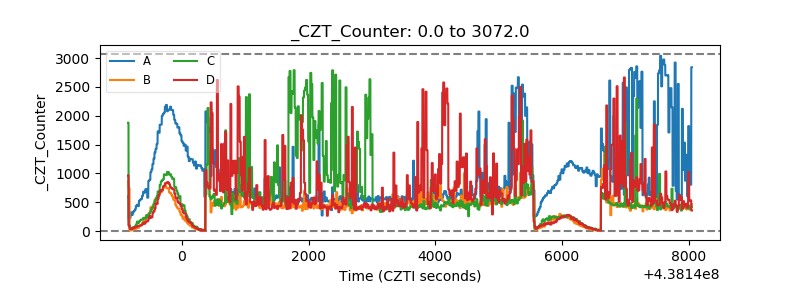 |
| +2.5 Volts monitor |  |
| +5 Volts monitor | 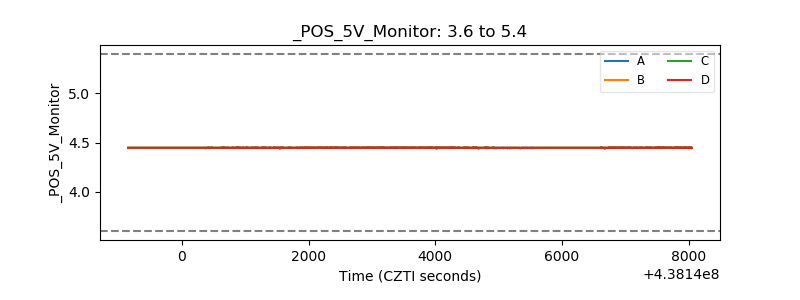 |
| _ROLL_ROT | 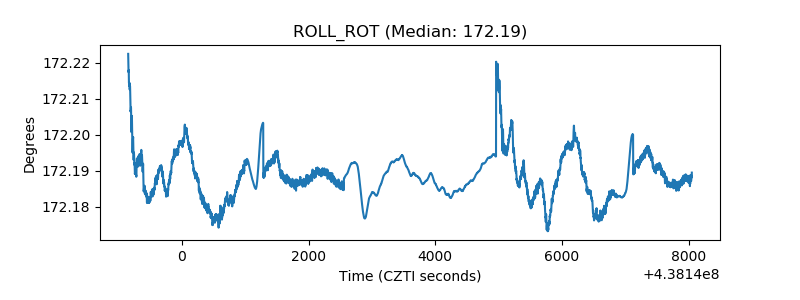 |
| _Roll_DEC | 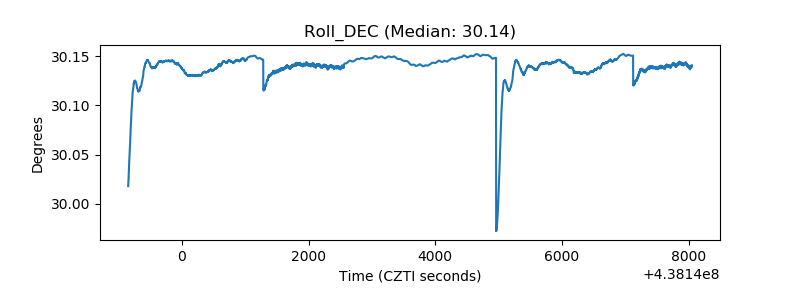 |
| _Roll_RA | 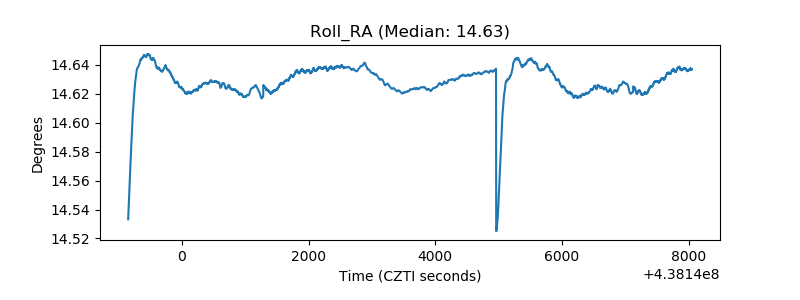 |
| Veto Counter | 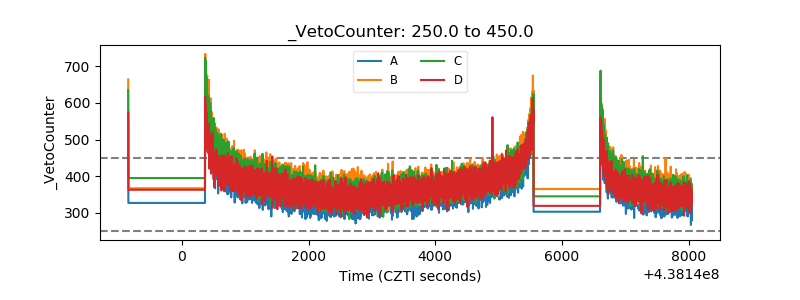 |