| Param | Original file | Final file |
|---|---|---|
| Filename | modeM0/AS1A13_025T01_9000005936_44042cztM0_level2.fits | modeM0/AS1A13_025T01_9000005936_44042cztM0_level2_quad_clean.evt |
| Size (bytes) | 592,597,440 | 112,155,840 |
| Size | 565.1 MB | 107.0 MB |
| Events in quadrant A | 8,172,388 | 649,365 |
| Events in quadrant B | 3,465,257 | 807,380 |
| Events in quadrant C | 3,480,785 | 785,301 |
| Events in quadrant D | 6,253,274 | 646,991 |
| Mode M9 | |||
|---|---|---|---|
| Quadrant | BADHDUFLAG | Total packets | Discarded packets |
| A | 0 | 15 | 0 |
| B | 0 | 16 | 0 |
| C | 0 | 16 | 0 |
| D | 0 | 16 | 0 |
| Mode M0 | |||
|---|---|---|---|
| Quadrant | BADHDUFLAG | Total packets | Discarded packets |
| A | 0 | 29228 | 3 |
| B | 0 | 15280 | 3 |
| C | 0 | 15547 | 3 |
| D | 0 | 23743 | 3 |
| Mode SS | |||
|---|---|---|---|
| Quadrant | BADHDUFLAG | Total packets | Discarded packets |
| A | 0 | 150 | 0 |
| B | 0 | 150 | 0 |
| C | 0 | 150 | 0 |
| D | 0 | 150 | 0 |
| Quadrant | Total seconds | Saturated seconds | Saturation percentage |
|---|---|---|---|
| A | 7270 | 1515 | 20.839065% |
| B | 7270 | 79 | 1.086657% |
| C | 7270 | 55 | 0.756534% |
| D | 7270 | 840 | 11.554333% |
Noise dominated data is calculated using 1-second bins in cleaned event files. If a bin has >2000 counts, and if more than 50% of those come from <1% of pixels, then it is considered to be noise-dominated and hence unusable.
| Quadrant | # 1 sec bins | Bins with >0 counts | Bins with >2000 counts | High rate bins dominated by noise | Noise dominated (total time) | Noise dominated (detector-on time) | Marked lightcurve |
|---|---|---|---|---|---|---|---|
| A | 7970 | 7272 | 1111 | 1111 | 13.94% | 15.28% | 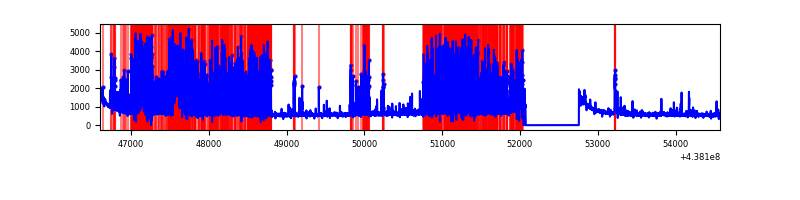 |
| B | 7970 | 7272 | 10 | 10 | 0.13% | 0.14% | 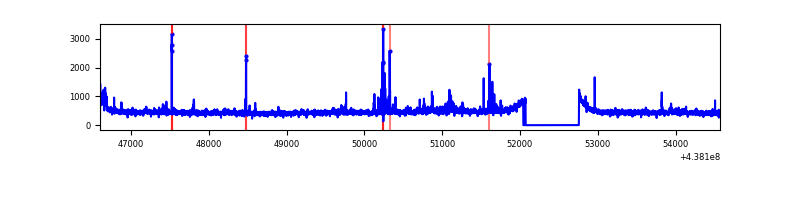 |
| C | 7970 | 7272 | 31 | 31 | 0.39% | 0.43% | 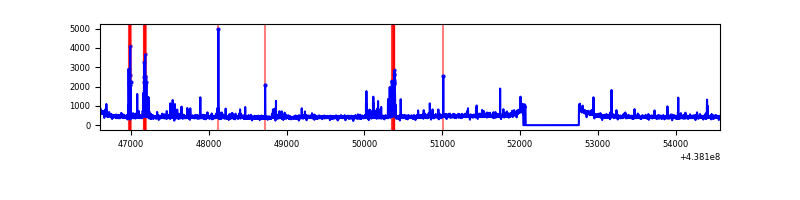 |
| D | 7970 | 7272 | 650 | 650 | 8.16% | 8.94% | 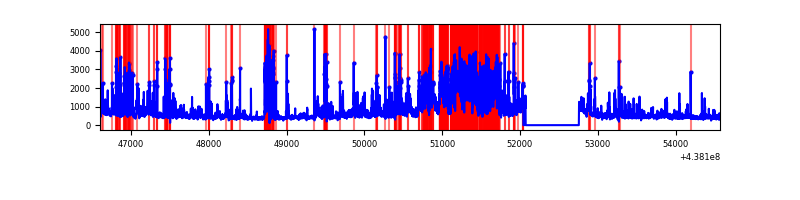 |
Top three noisy pixels from each quadrant. If the there are fewer than three noisy pixels in the level2.evt file, extra rows are filled as -1
| Pixel properties | Quadrant properties | ||||||
|---|---|---|---|---|---|---|---|
| Quadrant | DetID | PixID | Counts | Sigma | Mean | Median | Sigma |
| A | 15 | 222 | 3909243 | 25170.04 | 746 | 731 | 155.3 |
| A | 10 | 83 | 1266013 | 8148.16 | 746 | 731 | 155.3 |
| A | 14 | 238 | 89006 | 568.47 | 746 | 731 | 155.3 |
| B | 0 | 200 | 65963 | 400.63 | 822 | 797 | 162.7 |
| B | 4 | 171 | 43657 | 263.5 | 822 | 797 | 162.7 |
| B | 5 | 172 | 32282 | 193.57 | 822 | 797 | 162.7 |
| C | 14 | 254 | 250786 | 1307.63 | 810 | 814 | 191.2 |
| C | 3 | 233 | 54365 | 280.13 | 810 | 814 | 191.2 |
| C | 5 | 250 | 13981 | 68.88 | 810 | 814 | 191.2 |
| D | 5 | 235 | 1716564 | 8727.19 | 770 | 744 | 196.6 |
| D | 1 | 52 | 529093 | 2687.35 | 770 | 744 | 196.6 |
| D | 12 | 233 | 419186 | 2128.32 | 770 | 744 | 196.6 |
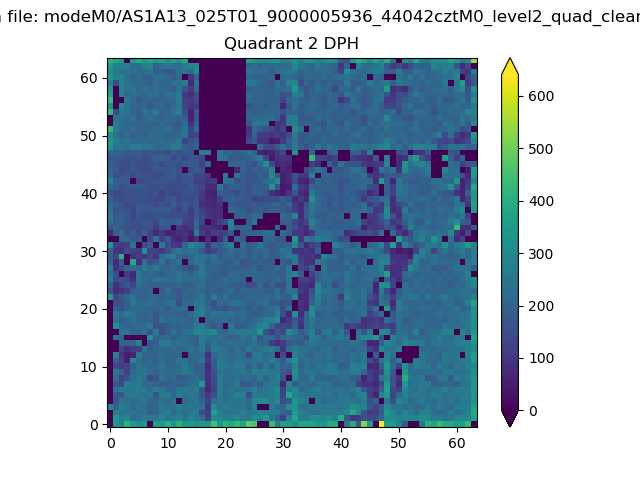
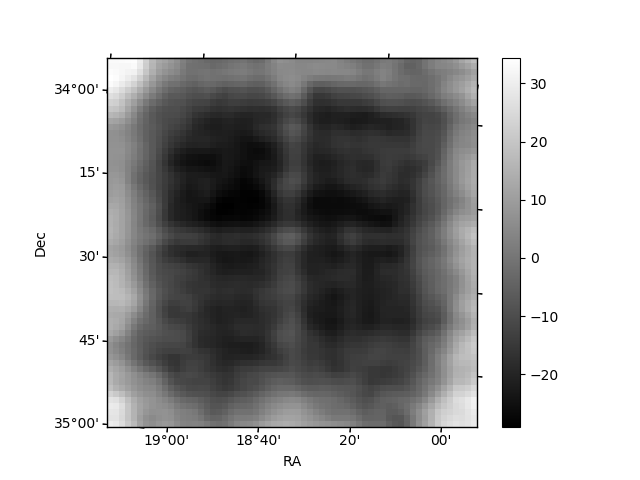
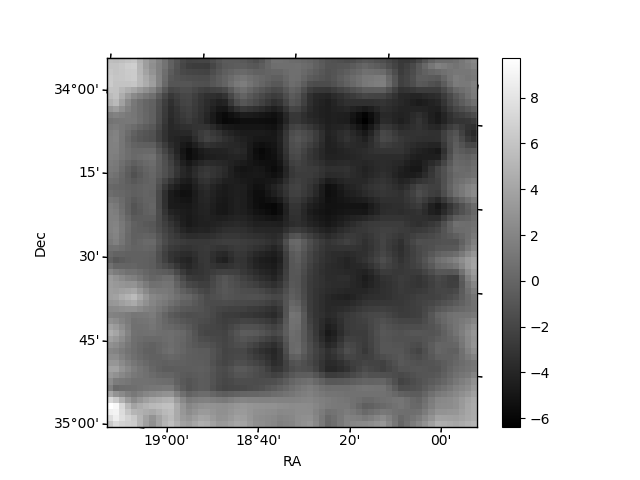
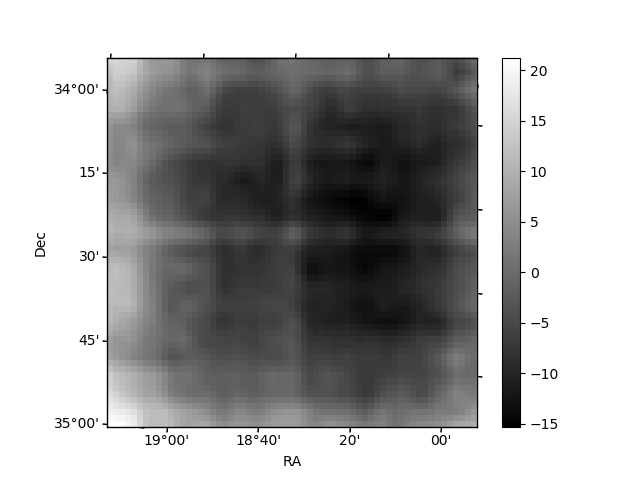
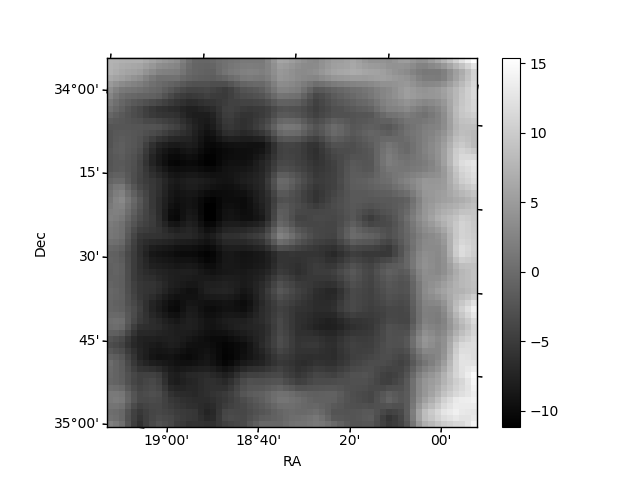
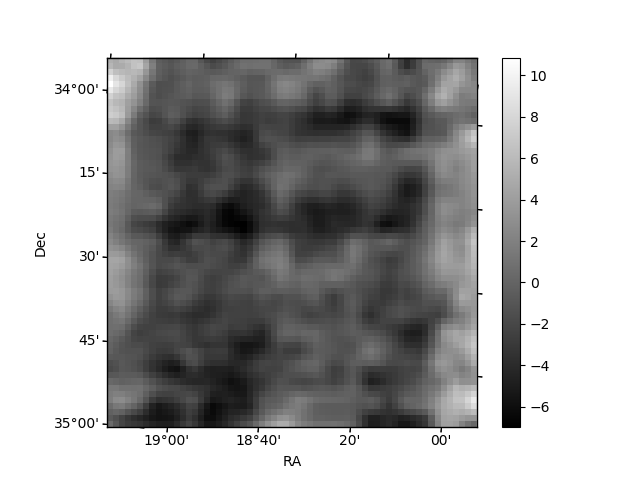
Histogram calculated using DETX and DETY for each event in the final _common_clean file
| Quadrant A | 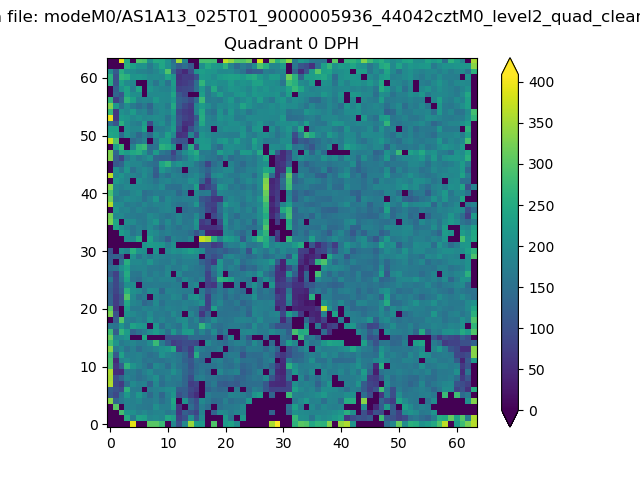 |
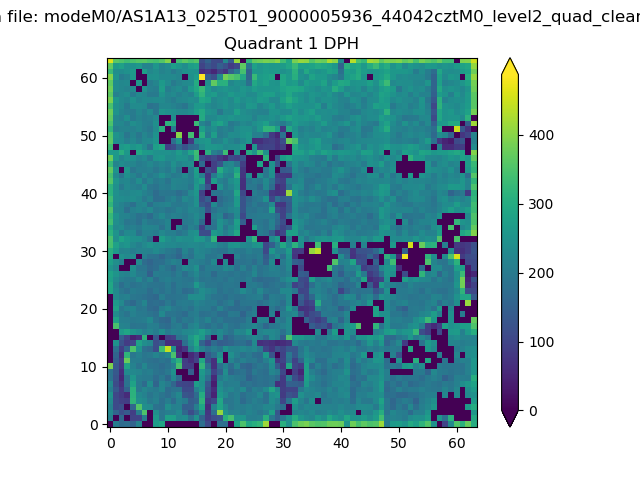 |
Quadrant B |
|---|---|---|---|
| Quadrant D | 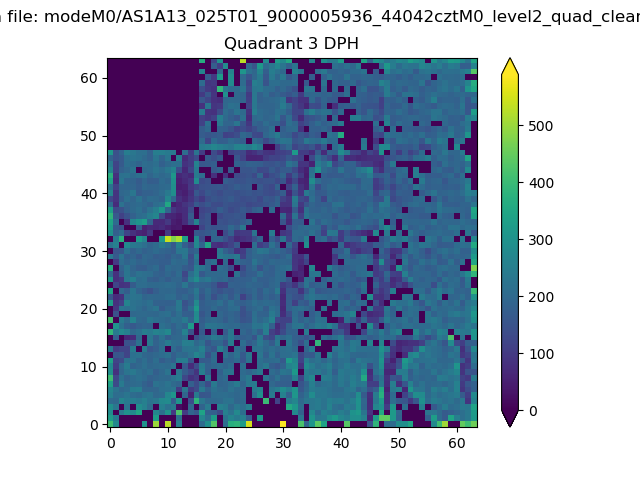 |
 |
Quadrant C |
| Plot type | Count rate plots | Images |
|---|---|---|
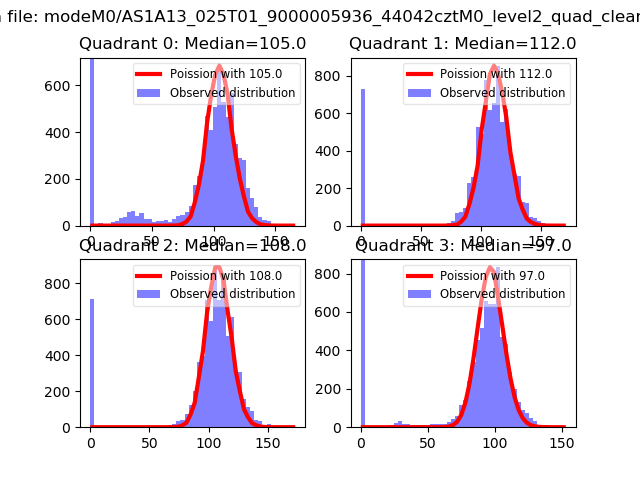
| Comparison with Poisson distribution Blue bars denote a histogram of data divided into 1 sec bins. Red curve is a Poisson curve with rate = median count rate of data. |
 |
 |
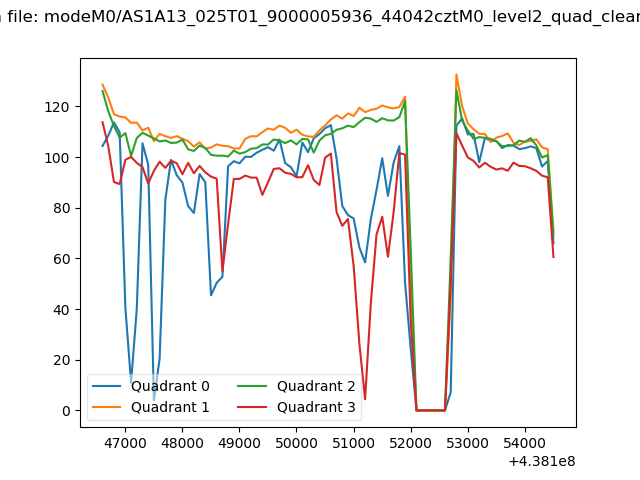
| Quadrant-wise count rates Data is divided into 100 sec bins |
 |
|
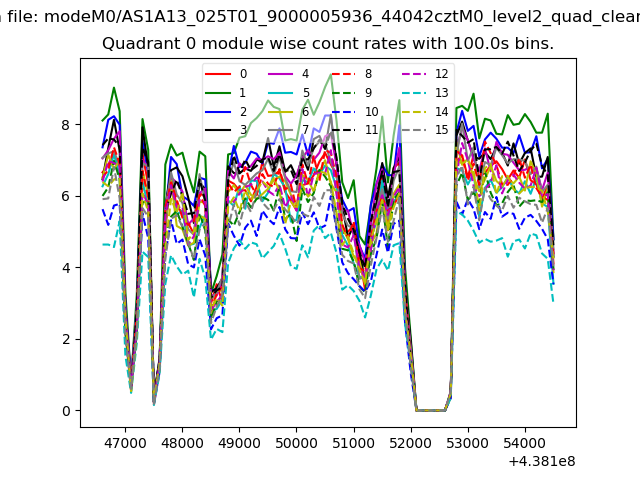
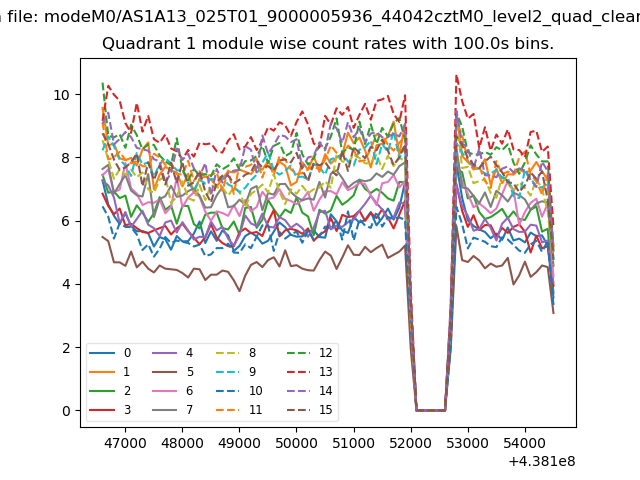
| Module-wise count rates for Quadrant A Data is divided into 100 sec bins |
 |
 |
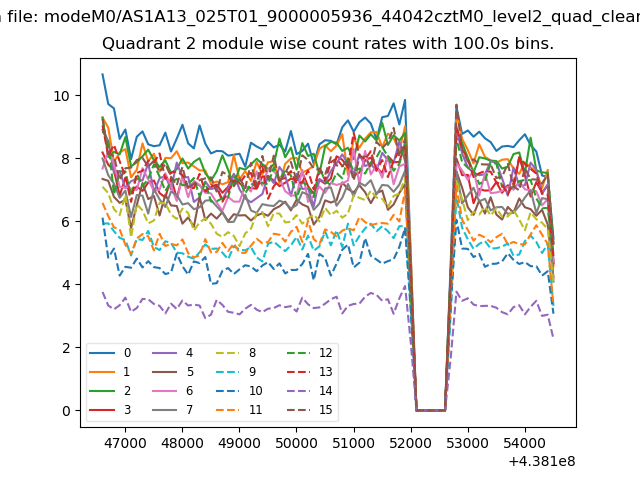
| Module-wise count rates for Quadrant B Data is divided into 100 sec bins |
 |
 |
| Module-wise count rates for Quadrant C Data is divided into 100 sec bins |
 |
 |
| Module-wise count rates for Quadrant D Data is divided into 100 sec bins |
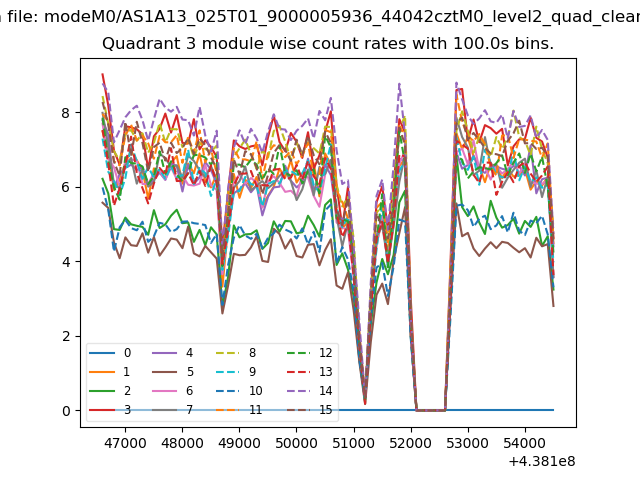 |
 |
| Parameter | Plot |
|---|---|
| CZT HV Monitor | 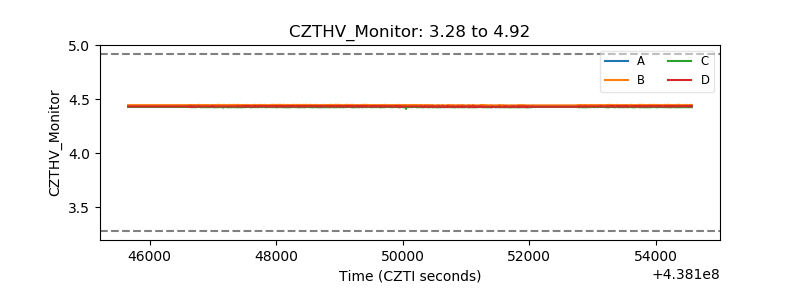 |
| D_VDD | 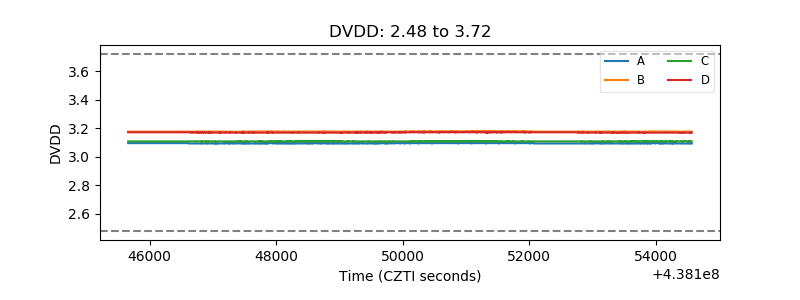 |
| Temperature 1 | 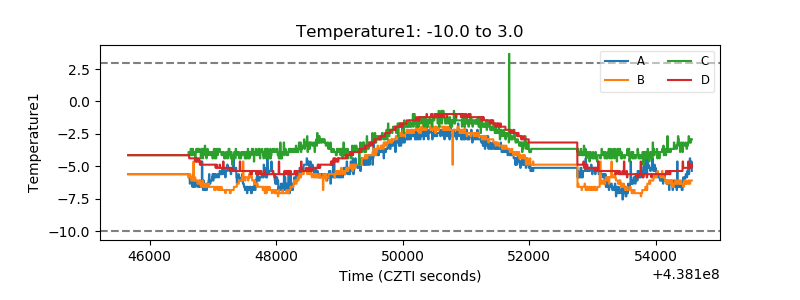 |
| Veto HV Monitor | 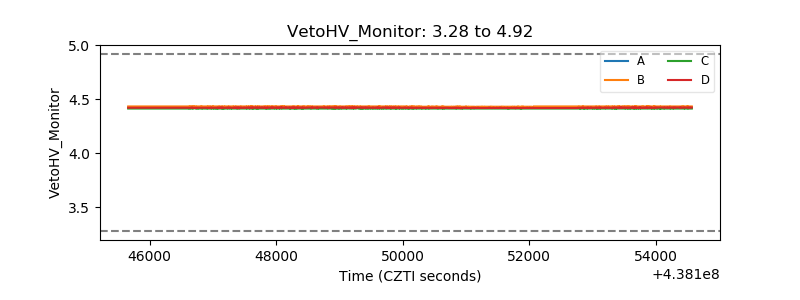 |
| Veto LLD | 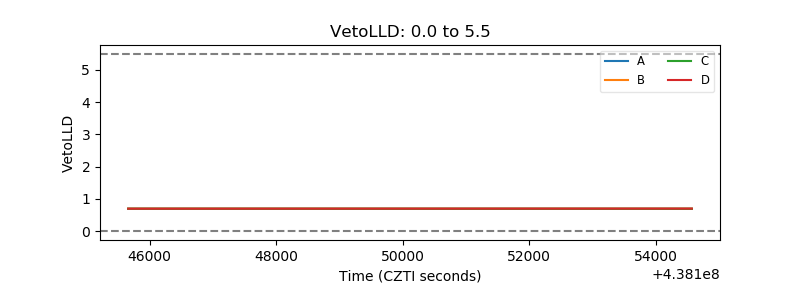 |
| Alpha Counter | 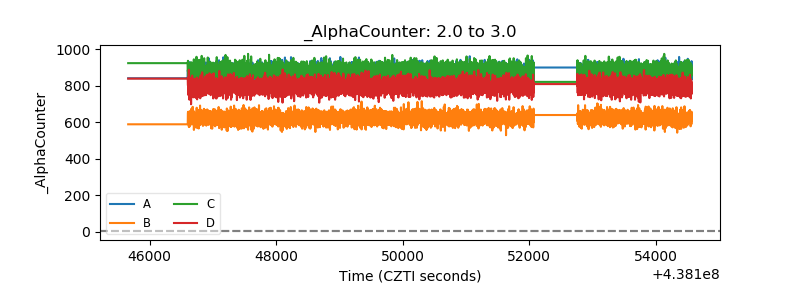 |
| _CPM_Rate | 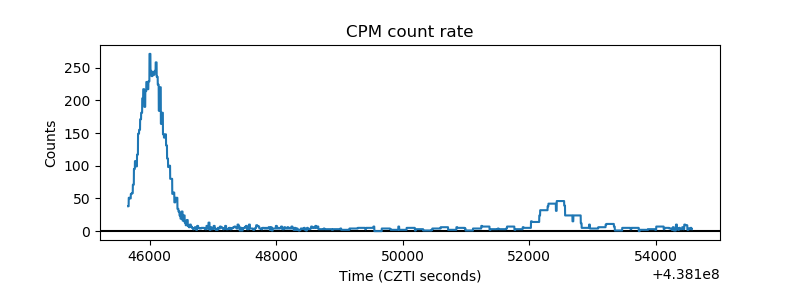 |
| CZT Counter | 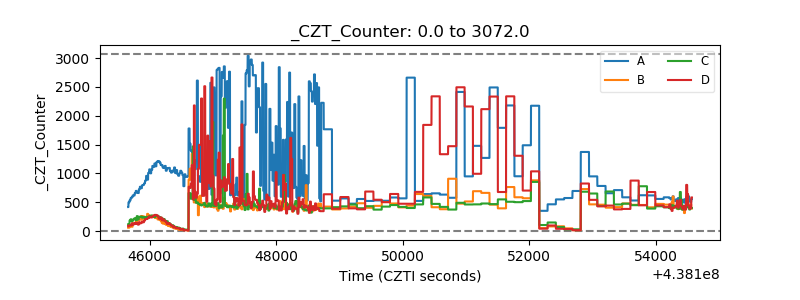 |
| +2.5 Volts monitor | 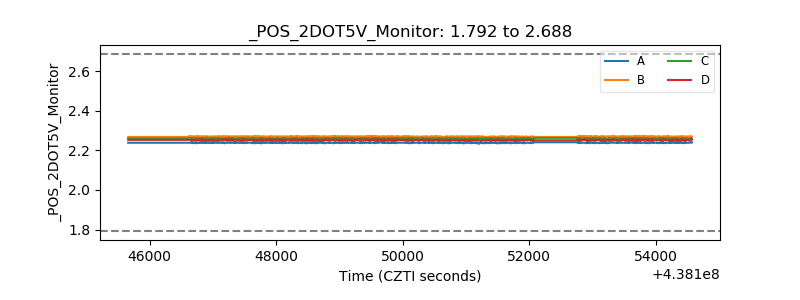 |
| +5 Volts monitor | 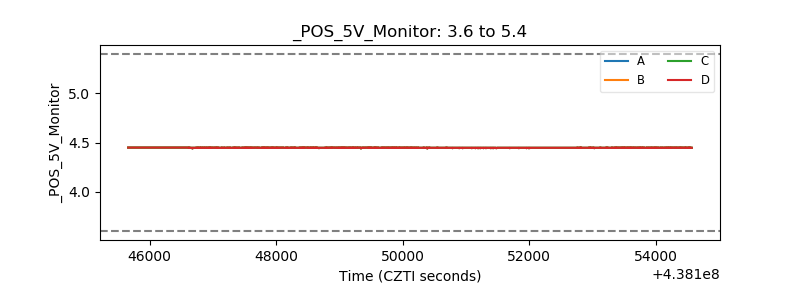 |
| _ROLL_ROT | 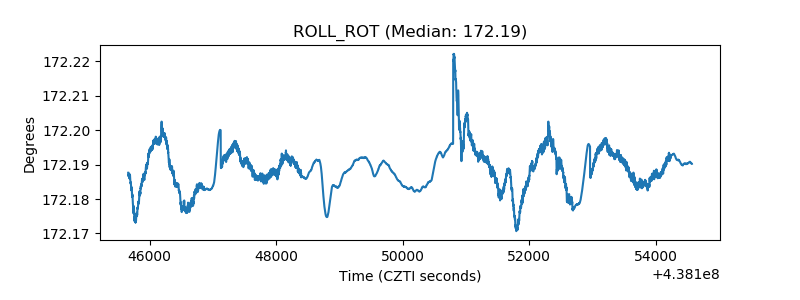 |
| _Roll_DEC | 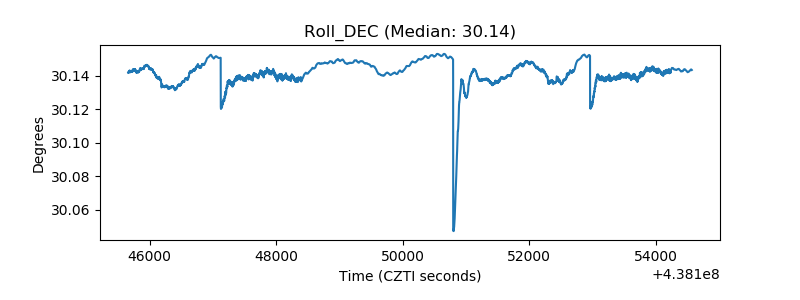 |
| _Roll_RA | 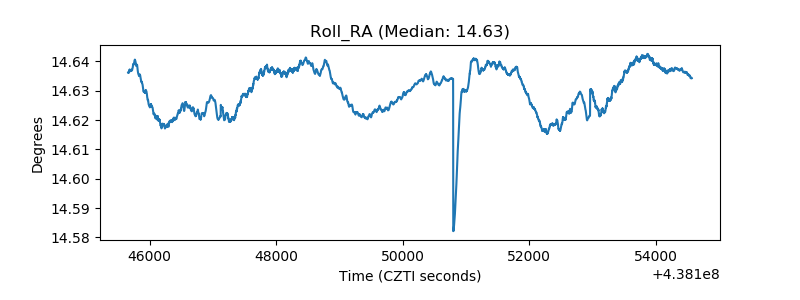 |
| Veto Counter | 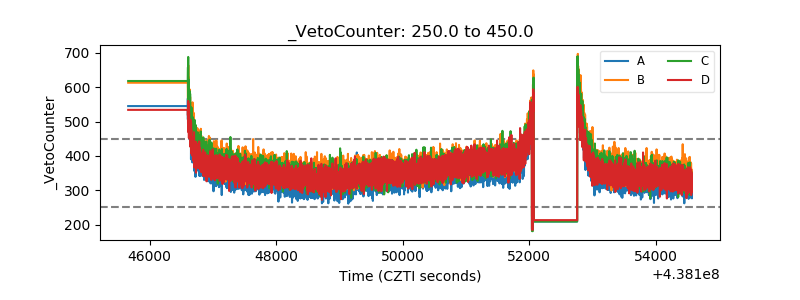 |