| Param | Original file | Final file |
|---|---|---|
| Filename | modeM0/AS1A13_025T01_9000005936_44043cztM0_level2.fits | modeM0/AS1A13_025T01_9000005936_44043cztM0_level2_quad_clean.evt |
| Size (bytes) | 541,673,280 | 128,304,000 |
| Size | 516.6 MB | 122.4 MB |
| Events in quadrant A | 5,699,692 | 825,825 |
| Events in quadrant B | 3,954,167 | 867,271 |
| Events in quadrant C | 3,959,058 | 869,690 |
| Events in quadrant D | 5,808,927 | 758,560 |
| Mode M9 | |||
|---|---|---|---|
| Quadrant | BADHDUFLAG | Total packets | Discarded packets |
| A | 0 | 6 | 0 |
| B | 0 | 6 | 0 |
| C | 0 | 6 | 0 |
| D | 0 | 6 | 0 |
| Mode M0 | |||
|---|---|---|---|
| Quadrant | BADHDUFLAG | Total packets | Discarded packets |
| A | 0 | 22633 | 2 |
| B | 0 | 17319 | 2 |
| C | 0 | 17512 | 2 |
| D | 0 | 22933 | 2 |
| Mode SS | |||
|---|---|---|---|
| Quadrant | BADHDUFLAG | Total packets | Discarded packets |
| A | 0 | 166 | 0 |
| B | 0 | 166 | 0 |
| C | 0 | 166 | 0 |
| D | 0 | 166 | 0 |
| Quadrant | Total seconds | Saturated seconds | Saturation percentage |
|---|---|---|---|
| A | 8097 | 496 | 6.125726% |
| B | 8097 | 337 | 4.162035% |
| C | 8097 | 113 | 1.395579% |
| D | 8098 | 527 | 6.507780% |
Noise dominated data is calculated using 1-second bins in cleaned event files. If a bin has >2000 counts, and if more than 50% of those come from <1% of pixels, then it is considered to be noise-dominated and hence unusable.
| Quadrant | # 1 sec bins | Bins with >0 counts | Bins with >2000 counts | High rate bins dominated by noise | Noise dominated (total time) | Noise dominated (detector-on time) | Marked lightcurve |
|---|---|---|---|---|---|---|---|
| A | 8797 | 8099 | 113 | 113 | 1.28% | 1.40% | 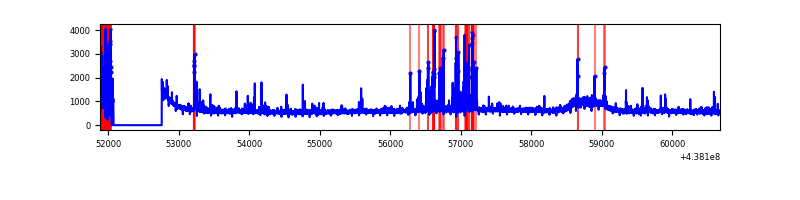 |
| B | 8797 | 8099 | 7 | 7 | 0.08% | 0.09% | 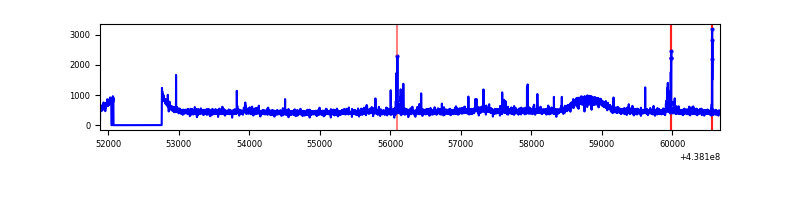 |
| C | 8797 | 8099 | 15 | 15 | 0.17% | 0.19% | 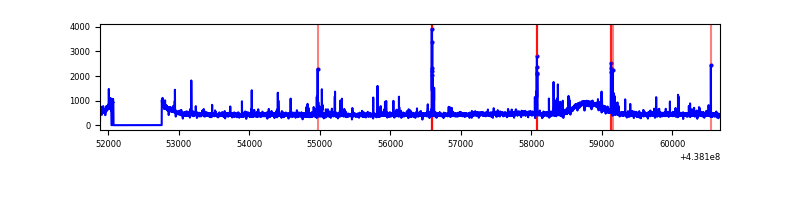 |
| D | 8798 | 8100 | 245 | 245 | 2.78% | 3.02% | 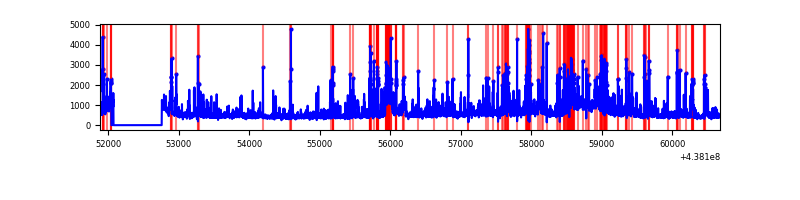 |
Top three noisy pixels from each quadrant. If the there are fewer than three noisy pixels in the level2.evt file, extra rows are filled as -1
| Pixel properties | Quadrant properties | ||||||
|---|---|---|---|---|---|---|---|
| Quadrant | DetID | PixID | Counts | Sigma | Mean | Median | Sigma |
| A | 10 | 83 | 1379661 | 6978.14 | 949 | 926 | 197.6 |
| A | 15 | 222 | 470518 | 2376.73 | 949 | 926 | 197.6 |
| A | 14 | 238 | 149399 | 751.46 | 949 | 926 | 197.6 |
| B | 0 | 213 | 48414 | 243.31 | 961 | 928 | 195.2 |
| B | 0 | 245 | 30111 | 149.53 | 961 | 928 | 195.2 |
| B | 4 | 171 | 27992 | 138.67 | 961 | 928 | 195.2 |
| C | 14 | 254 | 171676 | 756.12 | 949 | 953 | 225.8 |
| C | 3 | 233 | 59855 | 260.87 | 949 | 953 | 225.8 |
| C | 5 | 250 | 14735 | 61.04 | 949 | 953 | 225.8 |
| D | 1 | 52 | 653265 | 2803.99 | 923 | 895 | 232.7 |
| D | 5 | 235 | 609789 | 2617.13 | 923 | 895 | 232.7 |
| D | 2 | 249 | 224393 | 960.63 | 923 | 895 | 232.7 |
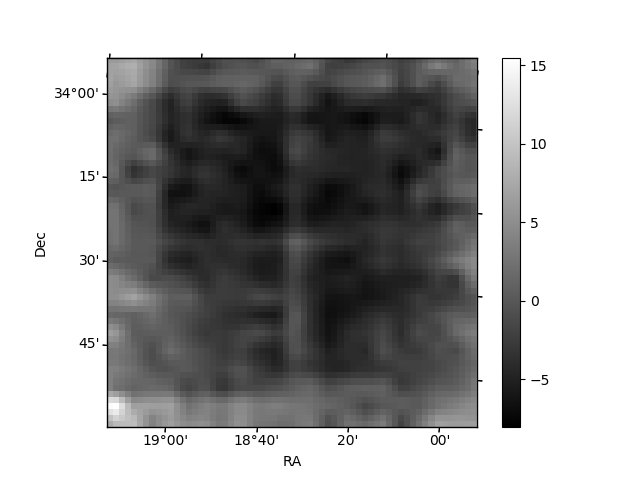
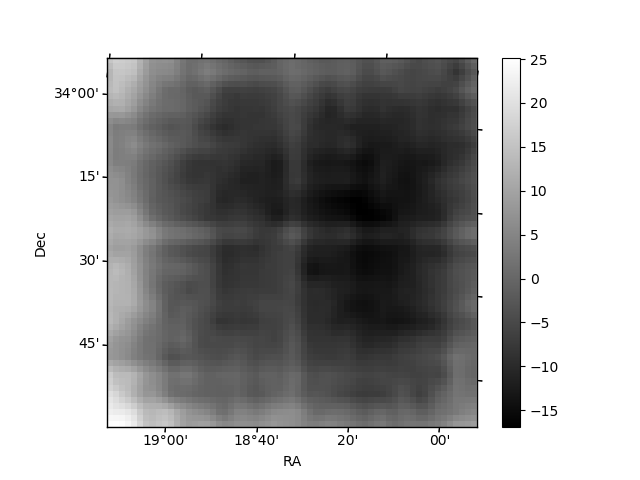
Histogram calculated using DETX and DETY for each event in the final _common_clean file
| Quadrant A | 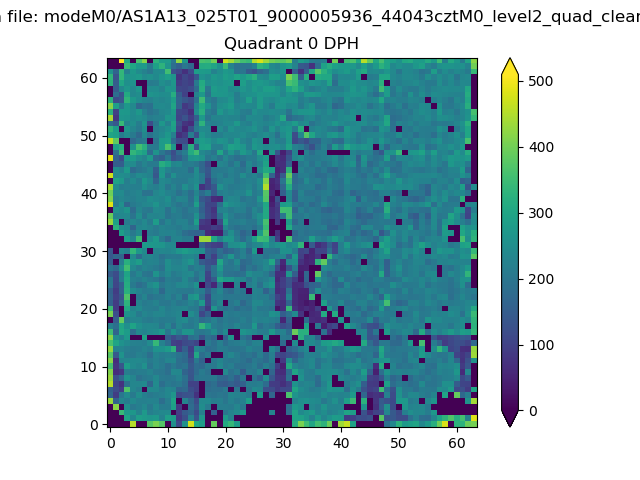 |
 |
Quadrant B |
|---|---|---|---|
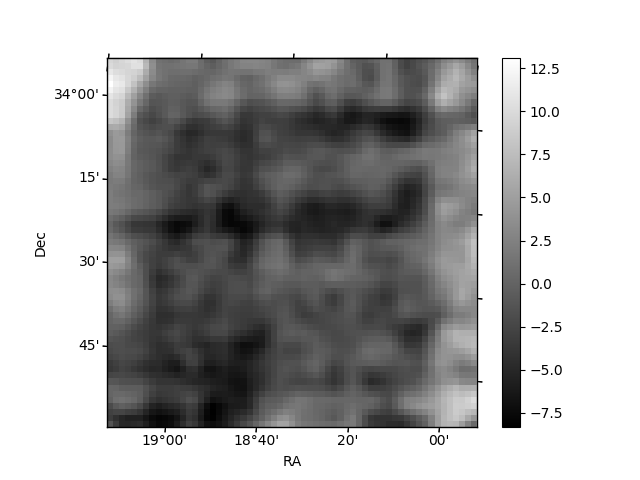
| Quadrant D |  |
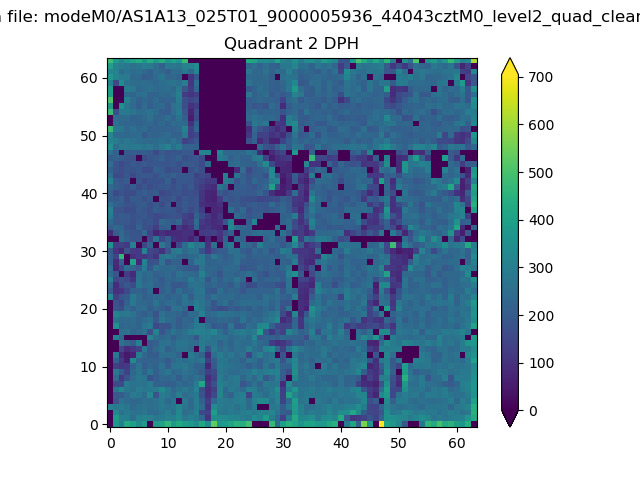 |
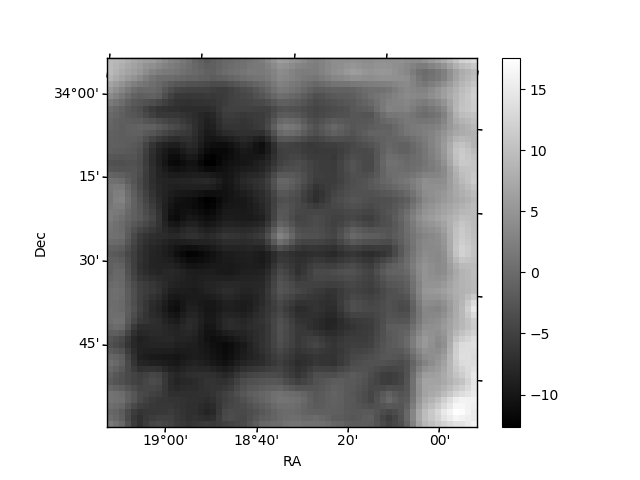
Quadrant C |
| Plot type | Count rate plots | Images |
|---|---|---|
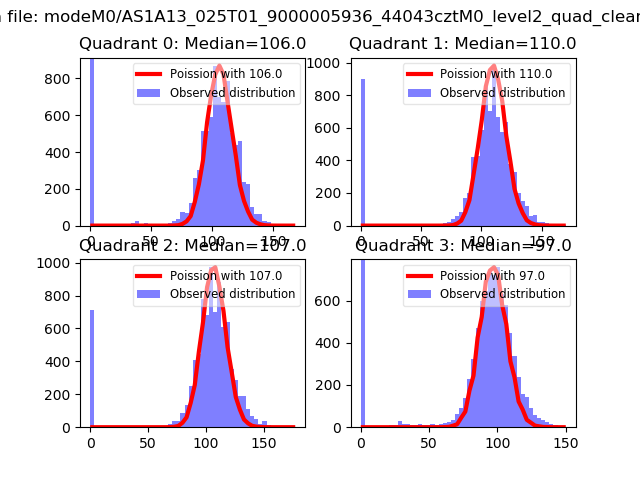
| Comparison with Poisson distribution Blue bars denote a histogram of data divided into 1 sec bins. Red curve is a Poisson curve with rate = median count rate of data. |
 |
 |
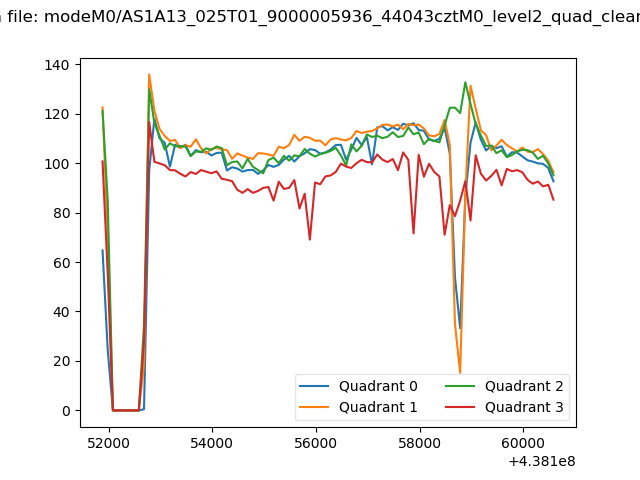
| Quadrant-wise count rates Data is divided into 100 sec bins |
 |
|
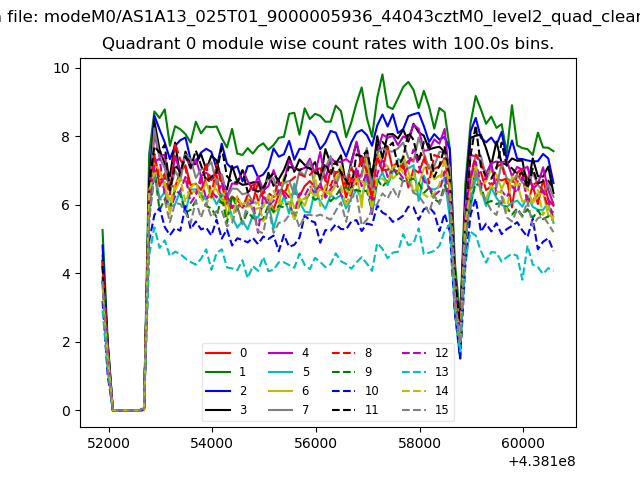
| Module-wise count rates for Quadrant A Data is divided into 100 sec bins |
 |
 |
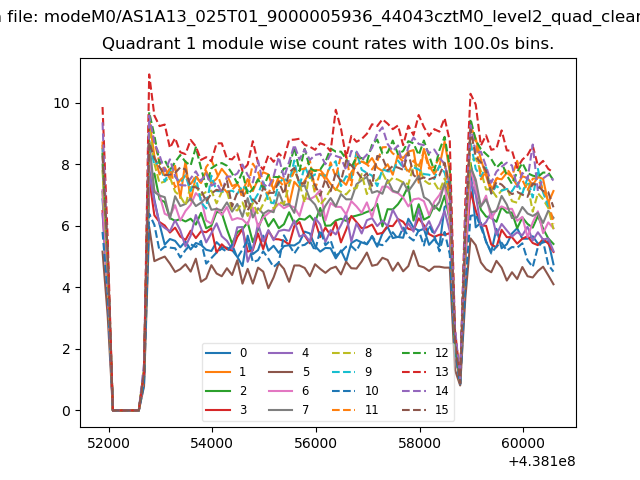
| Module-wise count rates for Quadrant B Data is divided into 100 sec bins |
 |
 |
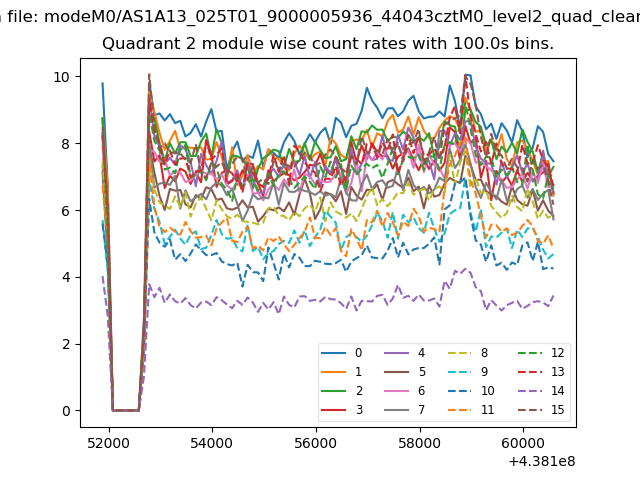
| Module-wise count rates for Quadrant C Data is divided into 100 sec bins |
 |
 |
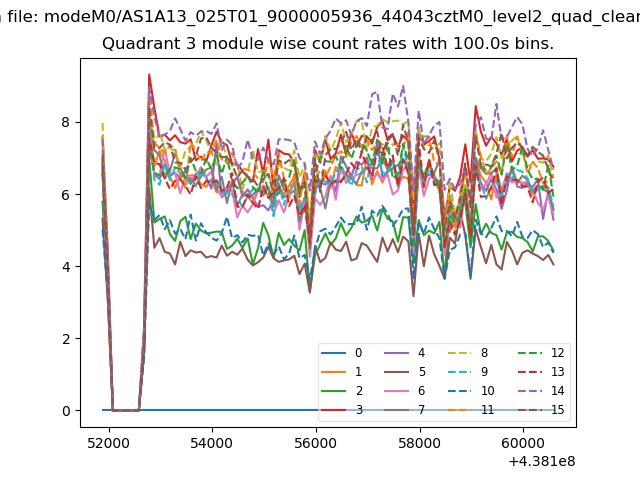
| Module-wise count rates for Quadrant D Data is divided into 100 sec bins |
 |
 |
| Parameter | Plot |
|---|---|
| CZT HV Monitor | 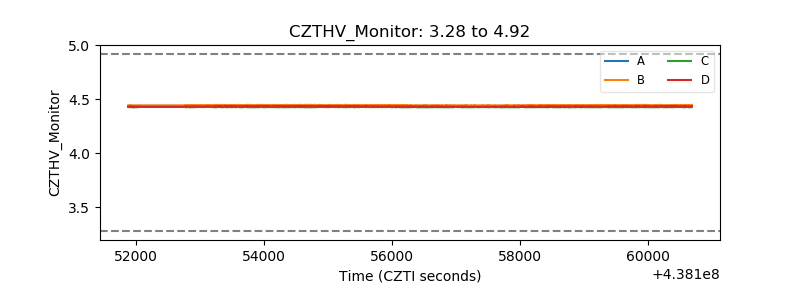 |
| D_VDD | 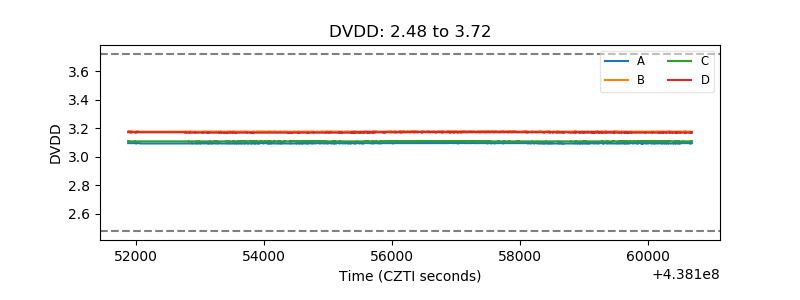 |
| Temperature 1 | 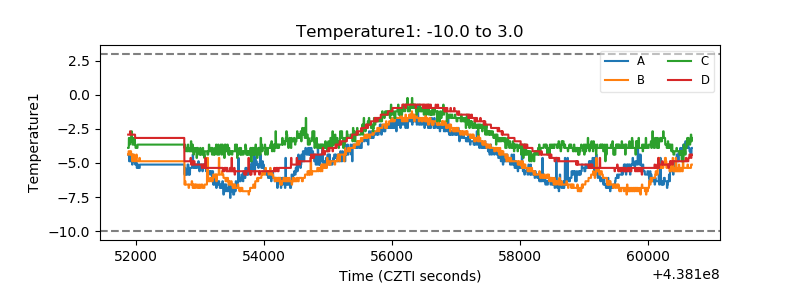 |
| Veto HV Monitor | 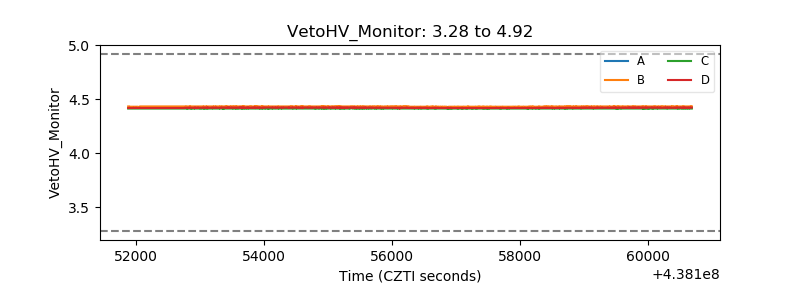 |
| Veto LLD | 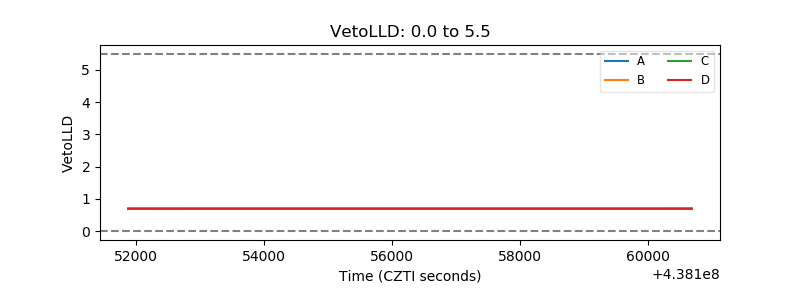 |
| Alpha Counter | 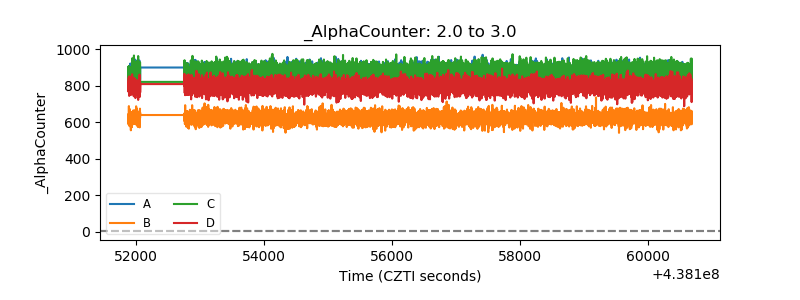 |
| _CPM_Rate | 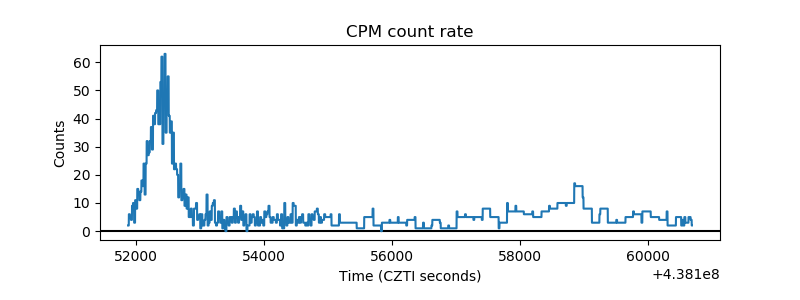 |
| CZT Counter | 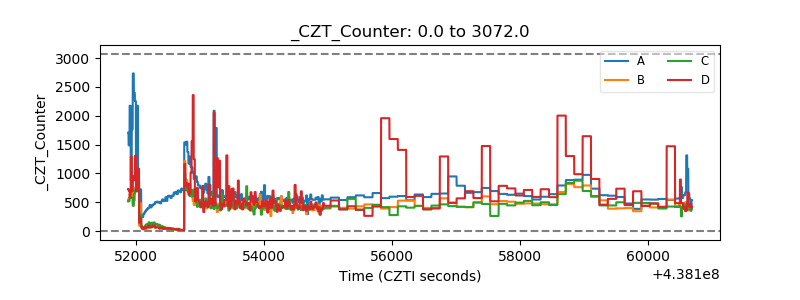 |
| +2.5 Volts monitor | 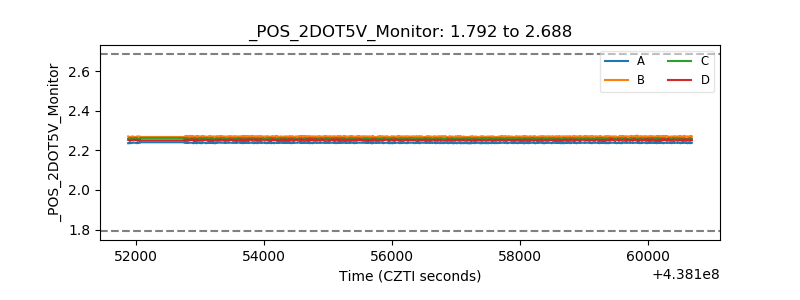 |
| +5 Volts monitor |  |
| _ROLL_ROT | 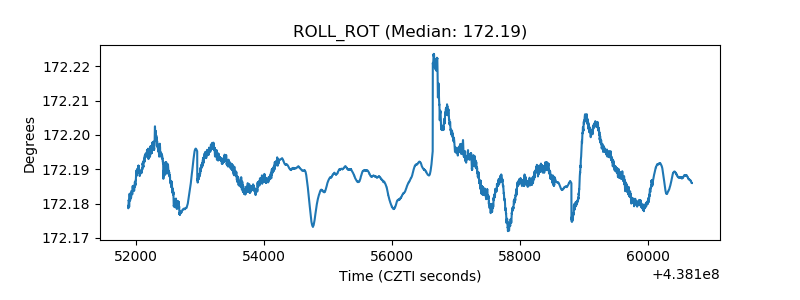 |
| _Roll_DEC | 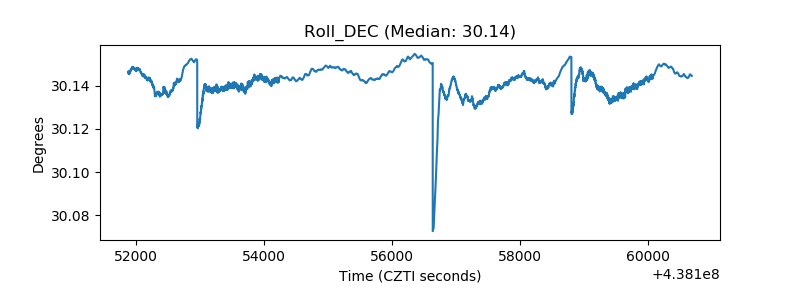 |
| _Roll_RA |  |
| Veto Counter | 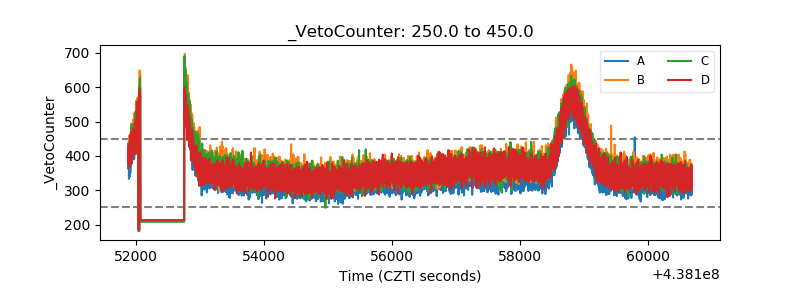 |