| Param | Original file | Final file |
|---|---|---|
| Filename | modeM0/AS1A13_025T01_9000005936_44044cztM0_level2.fits | modeM0/AS1A13_025T01_9000005936_44044cztM0_level2_quad_clean.evt |
| Size (bytes) | 406,261,440 | 91,281,600 |
| Size | 387.4 MB | 87.1 MB |
| Events in quadrant A | 3,789,006 | 601,463 |
| Events in quadrant B | 2,923,546 | 613,230 |
| Events in quadrant C | 2,783,996 | 617,899 |
| Events in quadrant D | 5,090,593 | 525,681 |
| Mode M0 | |||
|---|---|---|---|
| Quadrant | BADHDUFLAG | Total packets | Discarded packets |
| A | 0 | 15700 | 0 |
| B | 0 | 12570 | 0 |
| C | 0 | 12377 | 0 |
| D | 0 | 19237 | 0 |
| Mode SS | |||
|---|---|---|---|
| Quadrant | BADHDUFLAG | Total packets | Discarded packets |
| A | 0 | 116 | 0 |
| B | 0 | 116 | 0 |
| C | 0 | 116 | 0 |
| D | 0 | 116 | 0 |
| Quadrant | Total seconds | Saturated seconds | Saturation percentage |
|---|---|---|---|
| A | 5801 | 236 | 4.068264% |
| B | 5802 | 241 | 4.153740% |
| C | 5802 | 77 | 1.327129% |
| D | 5802 | 563 | 9.703550% |
Noise dominated data is calculated using 1-second bins in cleaned event files. If a bin has >2000 counts, and if more than 50% of those come from <1% of pixels, then it is considered to be noise-dominated and hence unusable.
| Quadrant | # 1 sec bins | Bins with >0 counts | Bins with >2000 counts | High rate bins dominated by noise | Noise dominated (total time) | Noise dominated (detector-on time) | Marked lightcurve |
|---|---|---|---|---|---|---|---|
| A | 5801 | 5801 | 12 | 12 | 0.21% | 0.21% | 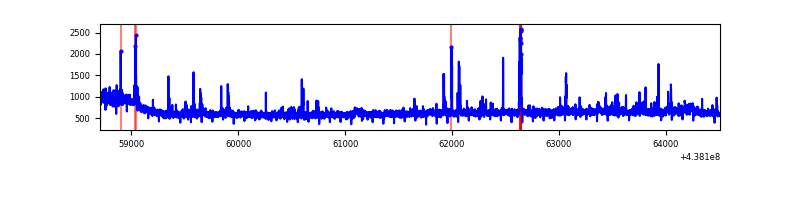 |
| B | 5802 | 5802 | 10 | 10 | 0.17% | 0.17% | 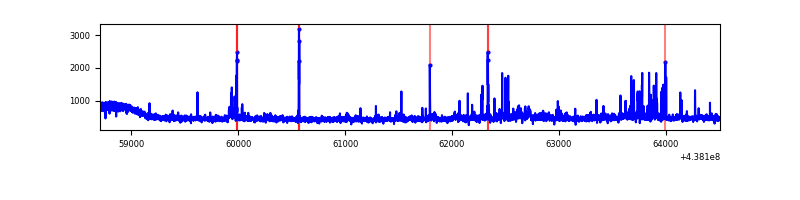 |
| C | 5802 | 5802 | 10 | 10 | 0.17% | 0.17% | 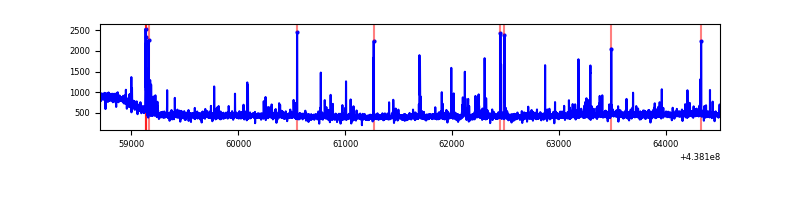 |
| D | 5802 | 5802 | 344 | 344 | 5.93% | 5.93% | 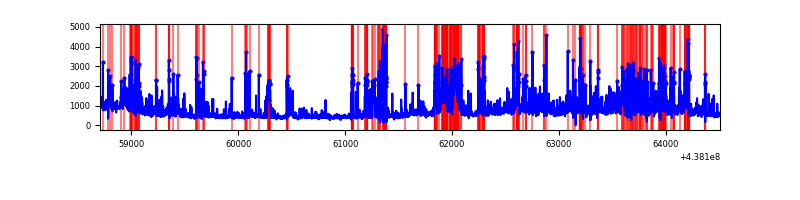 |
Top three noisy pixels from each quadrant. If the there are fewer than three noisy pixels in the level2.evt file, extra rows are filled as -1
| Pixel properties | Quadrant properties | ||||||
|---|---|---|---|---|---|---|---|
| Quadrant | DetID | PixID | Counts | Sigma | Mean | Median | Sigma |
| A | 10 | 83 | 988898 | 7017.21 | 670 | 655 | 140.8 |
| A | 14 | 238 | 121293 | 856.61 | 670 | 655 | 140.8 |
| A | 15 | 223 | 36108 | 251.74 | 670 | 655 | 140.8 |
| B | 0 | 200 | 106269 | 792.98 | 667 | 644 | 133.2 |
| B | 0 | 213 | 39033 | 288.21 | 667 | 644 | 133.2 |
| B | 2 | 2 | 28525 | 209.32 | 667 | 644 | 133.2 |
| C | 14 | 254 | 100261 | 633.52 | 662 | 664 | 157.2 |
| C | 3 | 233 | 27291 | 169.37 | 662 | 664 | 157.2 |
| C | 12 | 249 | 23635 | 146.11 | 662 | 664 | 157.2 |
| D | 1 | 52 | 1167337 | 7171.09 | 638 | 618 | 162.7 |
| D | 5 | 235 | 498490 | 3060.11 | 638 | 618 | 162.7 |
| D | 5 | 222 | 316884 | 1943.89 | 638 | 618 | 162.7 |
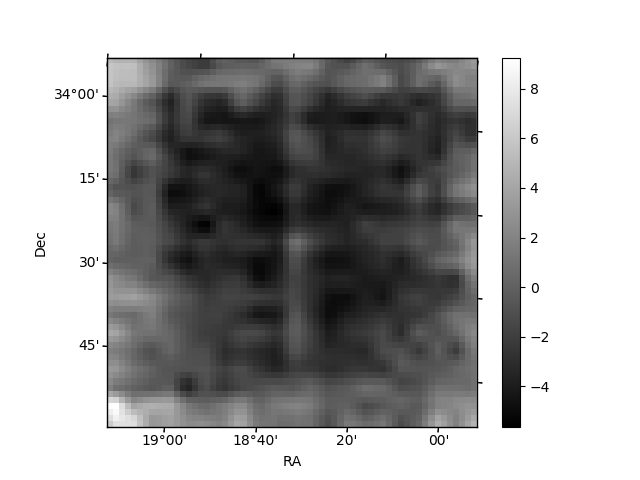
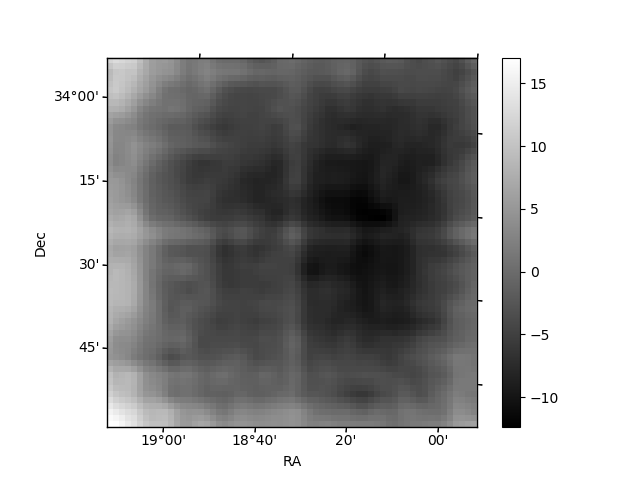
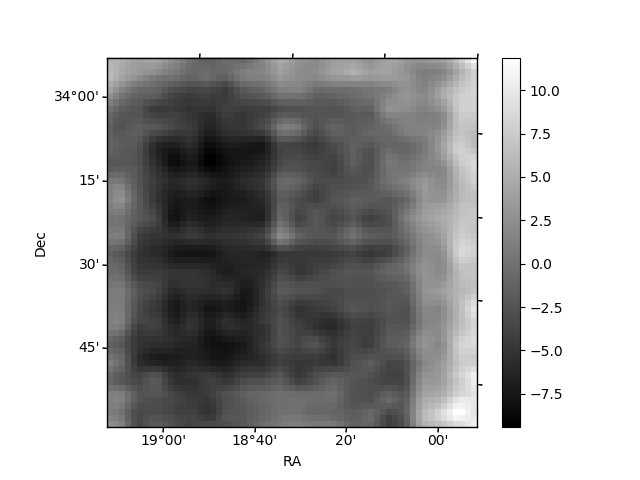
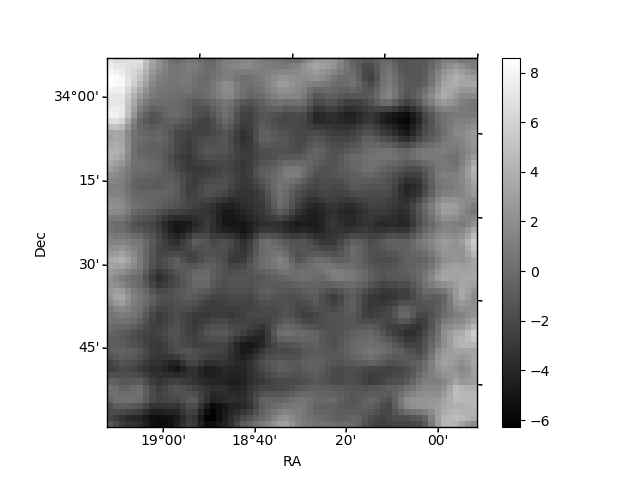
Histogram calculated using DETX and DETY for each event in the final _common_clean file
| Quadrant A | 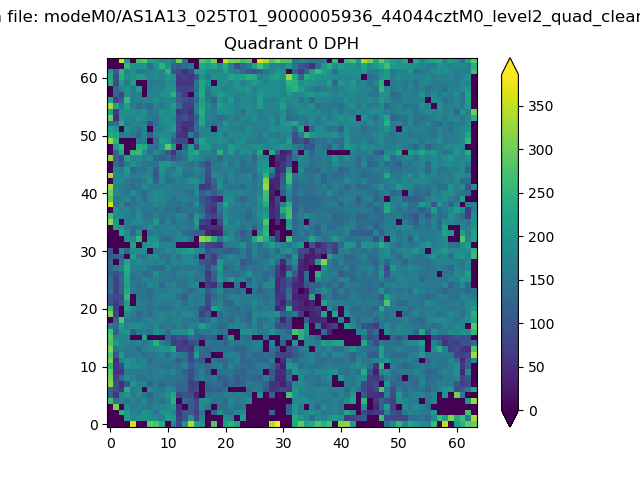 |
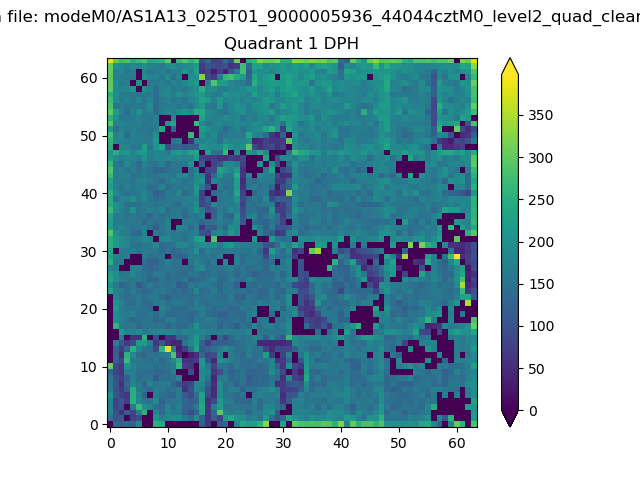 |
Quadrant B |
|---|---|---|---|
| Quadrant D | 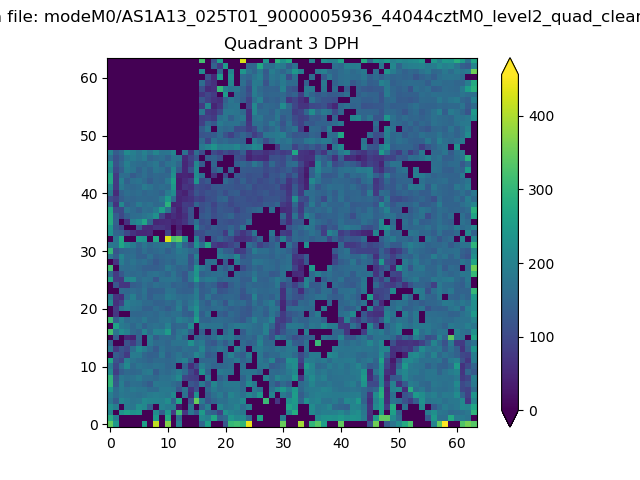 |
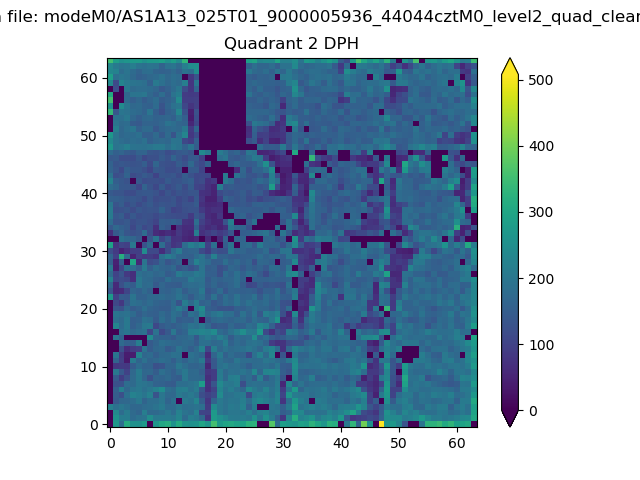 |
Quadrant C |
| Plot type | Count rate plots | Images |
|---|---|---|
| Comparison with Poisson distribution Blue bars denote a histogram of data divided into 1 sec bins. Red curve is a Poisson curve with rate = median count rate of data. |
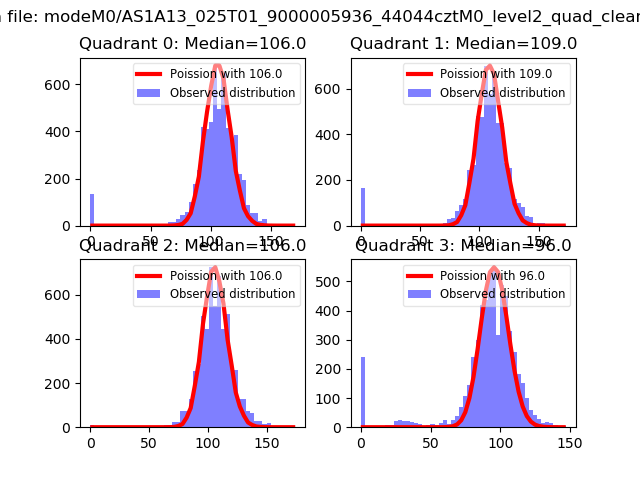 |
 |
| Quadrant-wise count rates Data is divided into 100 sec bins |
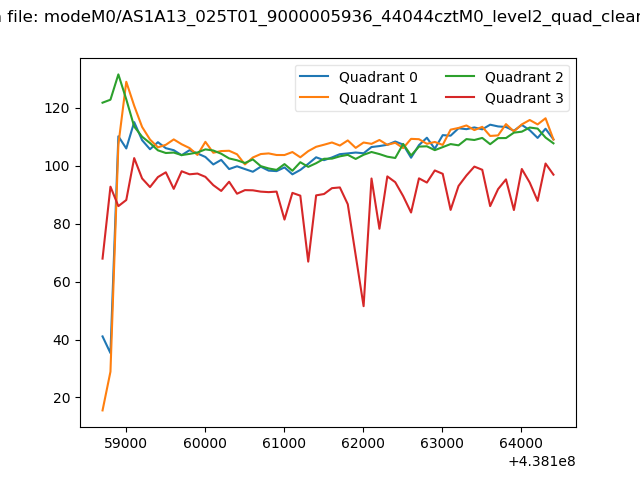 |
|
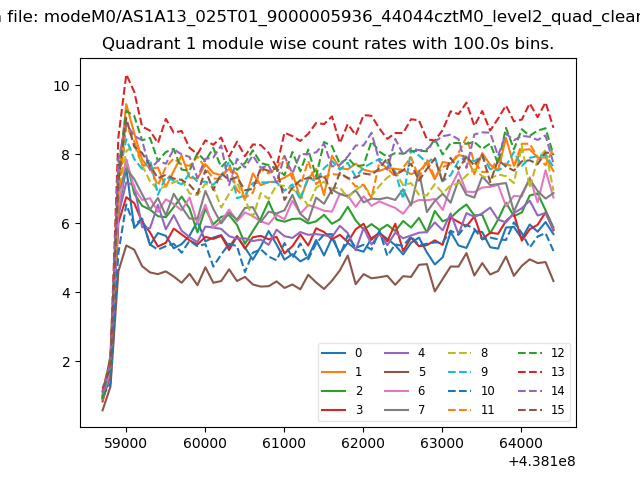
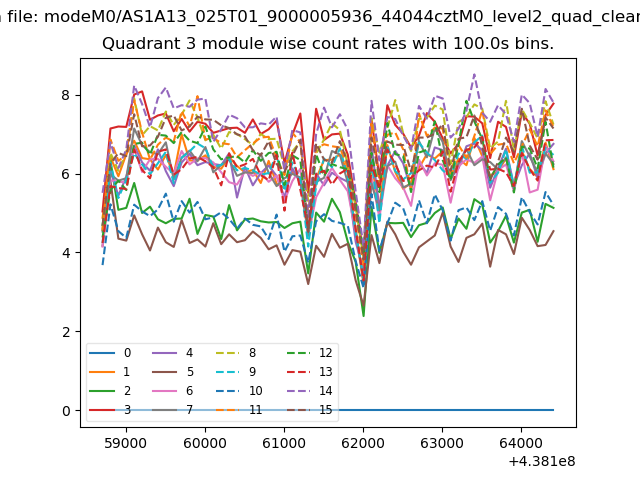
| Module-wise count rates for Quadrant A Data is divided into 100 sec bins |
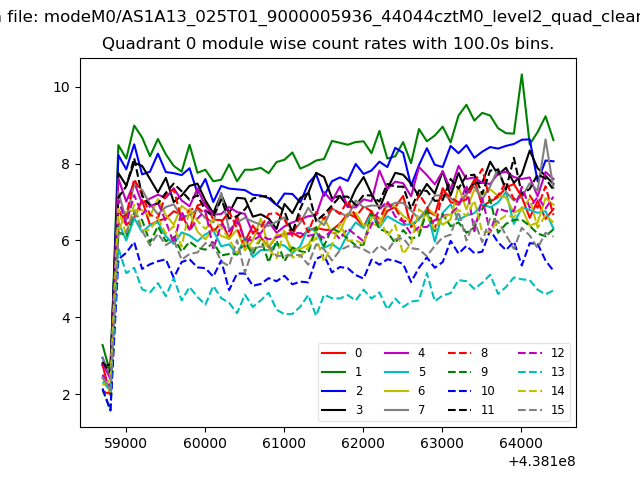 |
 |
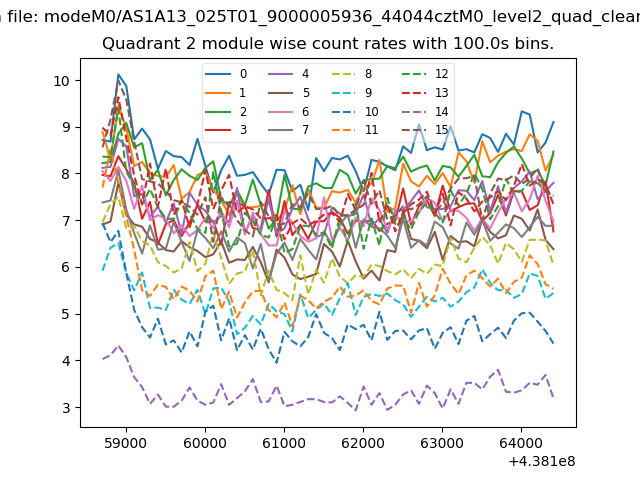
| Module-wise count rates for Quadrant B Data is divided into 100 sec bins |
 |
 |
| Module-wise count rates for Quadrant C Data is divided into 100 sec bins |
 |
 |
| Module-wise count rates for Quadrant D Data is divided into 100 sec bins |
 |
 |
| Parameter | Plot |
|---|---|
| CZT HV Monitor | 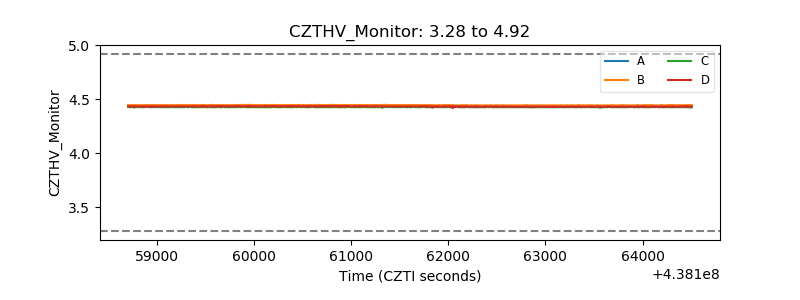 |
| D_VDD | 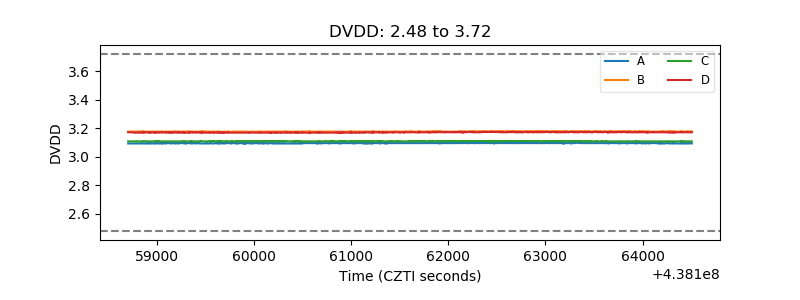 |
| Temperature 1 | 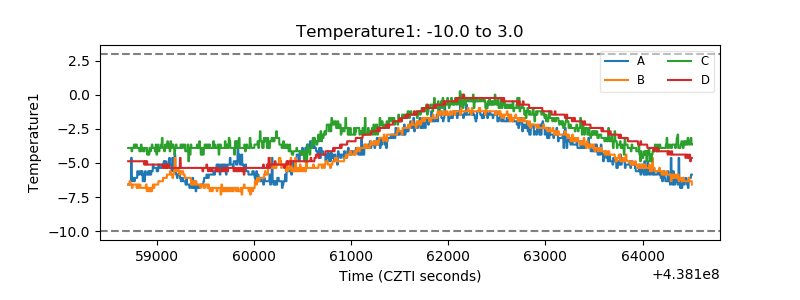 |
| Veto HV Monitor | 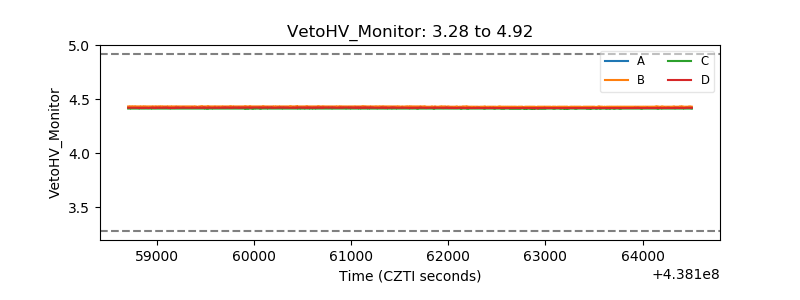 |
| Veto LLD | 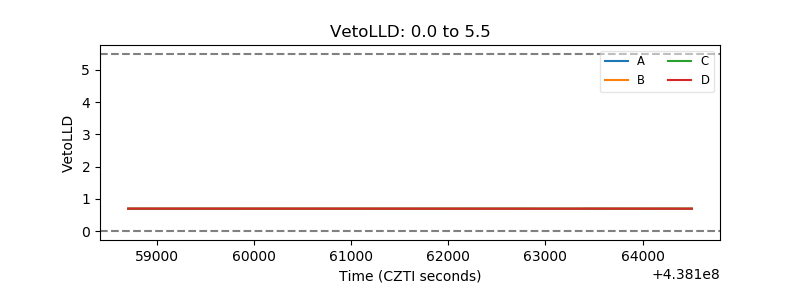 |
| Alpha Counter | 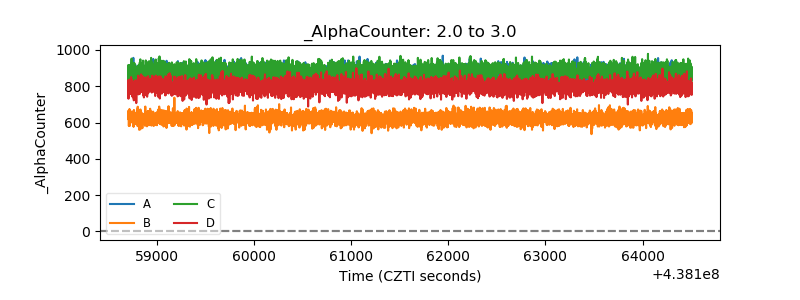 |
| _CPM_Rate | 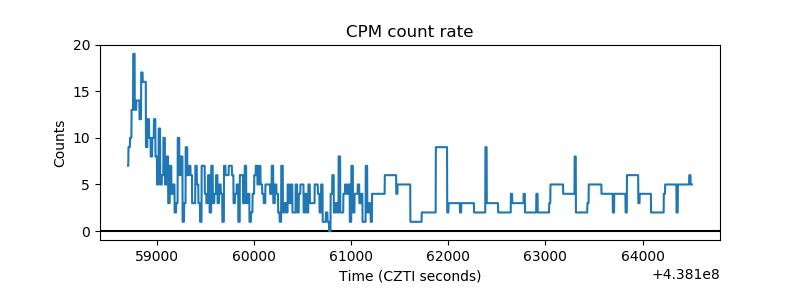 |
| CZT Counter | 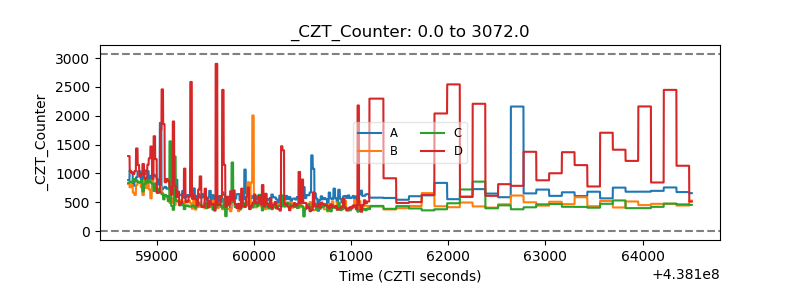 |
| +2.5 Volts monitor | 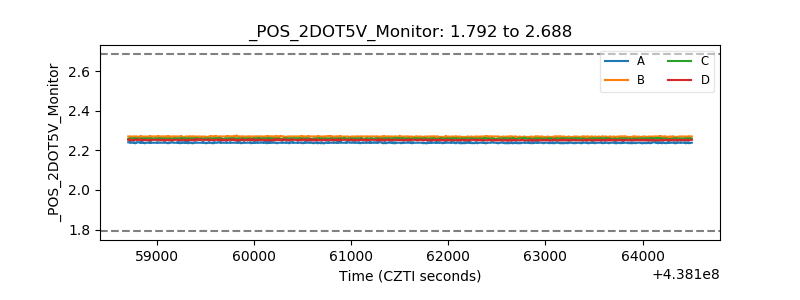 |
| +5 Volts monitor | 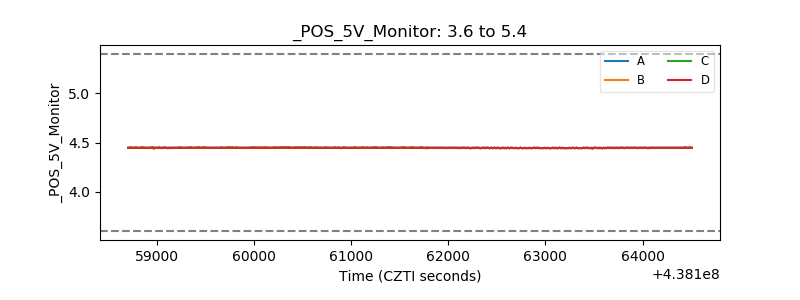 |
| _ROLL_ROT | 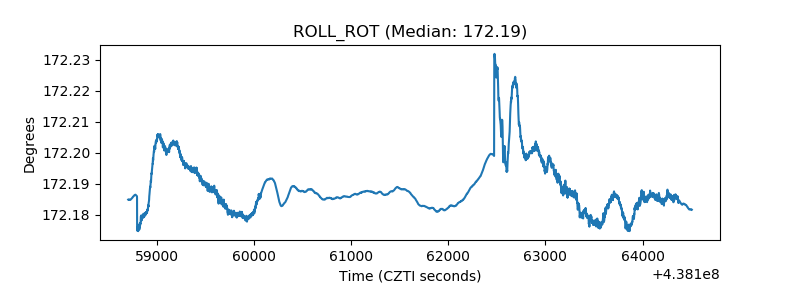 |
| _Roll_DEC | 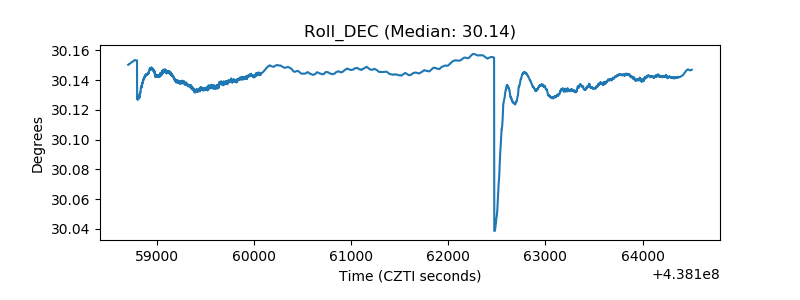 |
| _Roll_RA |  |
| Veto Counter | 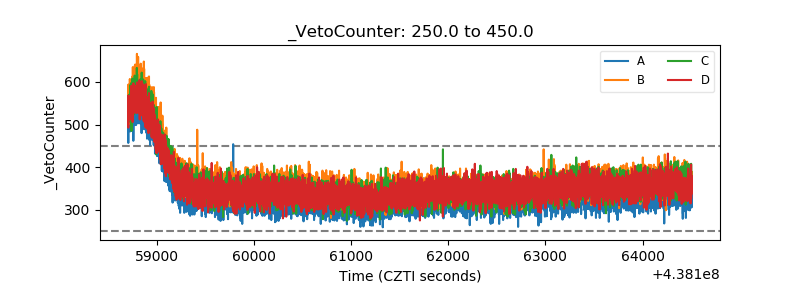 |