| Param | Original file | Final file |
|---|---|---|
| Filename | modeM0/AS1A13_025T02_9000005938_44045cztM0_level2.fits | modeM0/AS1A13_025T02_9000005938_44045cztM0_level2_quad_clean.evt |
| Size (bytes) | 514,460,160 | 119,848,320 |
| Size | 490.6 MB | 114.3 MB |
| Events in quadrant A | 4,718,861 | 790,447 |
| Events in quadrant B | 3,811,033 | 823,238 |
| Events in quadrant C | 4,038,673 | 800,502 |
| Events in quadrant D | 5,881,434 | 682,847 |
| Mode M0 | |||
|---|---|---|---|
| Quadrant | BADHDUFLAG | Total packets | Discarded packets |
| A | 0 | 18974 | 0 |
| B | 0 | 16584 | 0 |
| C | 0 | 17302 | 0 |
| D | 0 | 22496 | 0 |
| Mode SS | |||
|---|---|---|---|
| Quadrant | BADHDUFLAG | Total packets | Discarded packets |
| A | 0 | 154 | 0 |
| B | 0 | 154 | 0 |
| C | 0 | 154 | 0 |
| D | 0 | 154 | 0 |
| Quadrant | Total seconds | Saturated seconds | Saturation percentage |
|---|---|---|---|
| A | 7639 | 276 | 3.613038% |
| B | 7639 | 242 | 3.167954% |
| C | 7638 | 192 | 2.513747% |
| D | 7638 | 798 | 10.447761% |
Noise dominated data is calculated using 1-second bins in cleaned event files. If a bin has >2000 counts, and if more than 50% of those come from <1% of pixels, then it is considered to be noise-dominated and hence unusable.
| Quadrant | # 1 sec bins | Bins with >0 counts | Bins with >2000 counts | High rate bins dominated by noise | Noise dominated (total time) | Noise dominated (detector-on time) | Marked lightcurve |
|---|---|---|---|---|---|---|---|
| A | 7639 | 7639 | 3 | 3 | 0.04% | 0.04% | 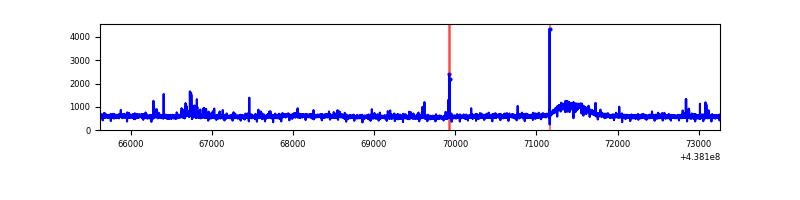 |
| B | 7639 | 7639 | 3 | 3 | 0.04% | 0.04% | 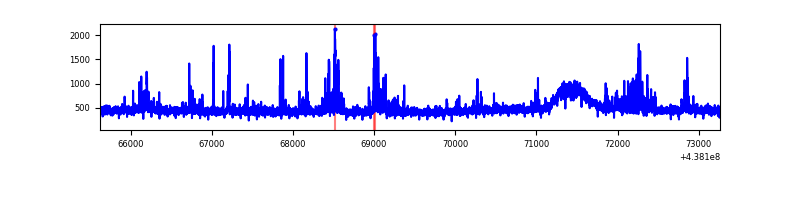 |
| C | 7638 | 7638 | 44 | 44 | 0.58% | 0.58% | 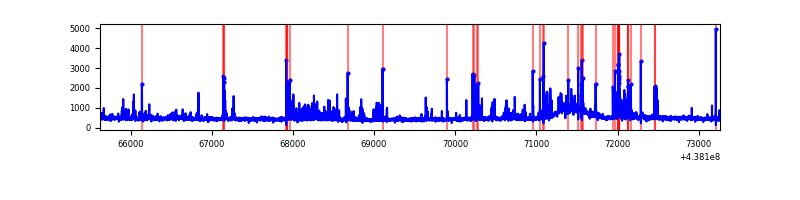 |
| D | 7638 | 7638 | 419 | 419 | 5.49% | 5.49% | 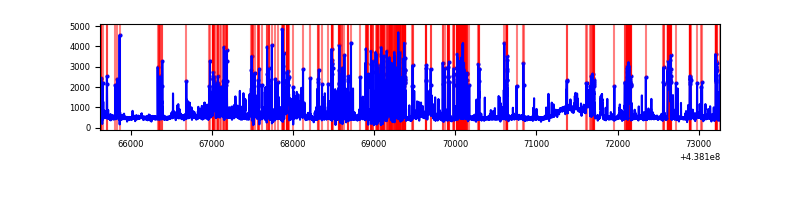 |
Top three noisy pixels from each quadrant. If the there are fewer than three noisy pixels in the level2.evt file, extra rows are filled as -1
| Pixel properties | Quadrant properties | ||||||
|---|---|---|---|---|---|---|---|
| Quadrant | DetID | PixID | Counts | Sigma | Mean | Median | Sigma |
| A | 10 | 83 | 1157058 | 6242.77 | 889 | 869 | 185.2 |
| A | 15 | 223 | 43387 | 229.57 | 889 | 869 | 185.2 |
| A | 4 | 0 | 35965 | 189.5 | 889 | 869 | 185.2 |
| B | 0 | 200 | 180141 | 1005.75 | 884 | 854 | 178.3 |
| B | 0 | 213 | 98379 | 547.09 | 884 | 854 | 178.3 |
| B | 12 | 111 | 23272 | 125.76 | 884 | 854 | 178.3 |
| C | 14 | 254 | 267540 | 1282.0 | 875 | 879 | 208.0 |
| C | 15 | 158 | 167407 | 800.6 | 875 | 879 | 208.0 |
| C | 3 | 233 | 101487 | 483.68 | 875 | 879 | 208.0 |
| D | 1 | 52 | 1921578 | 9026.04 | 843 | 814 | 212.8 |
| D | 2 | 249 | 260975 | 1222.55 | 843 | 814 | 212.8 |
| D | 5 | 222 | 123582 | 576.91 | 843 | 814 | 212.8 |
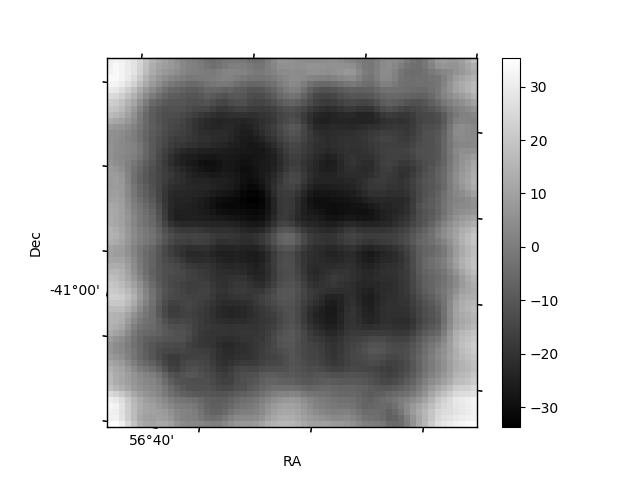
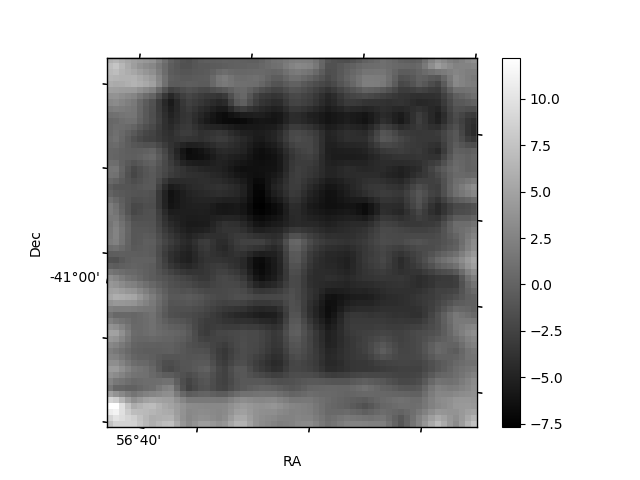
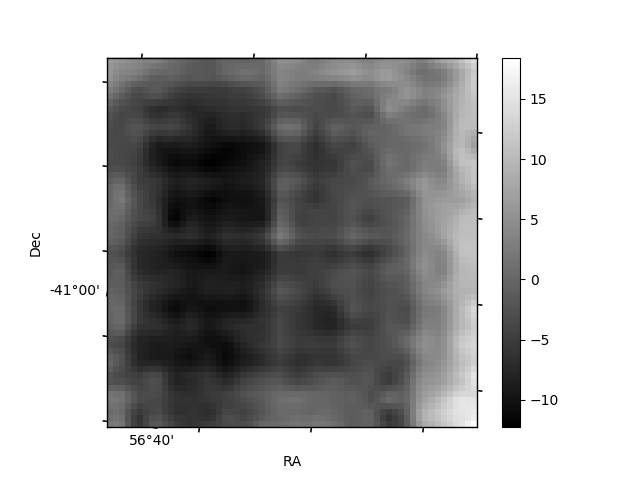
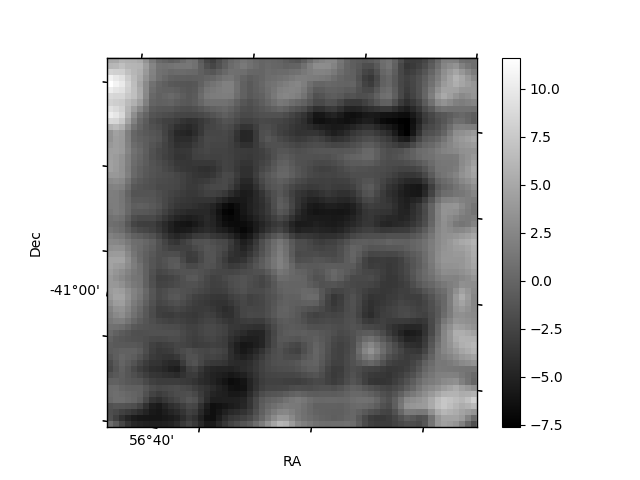
Histogram calculated using DETX and DETY for each event in the final _common_clean file
| Quadrant A | 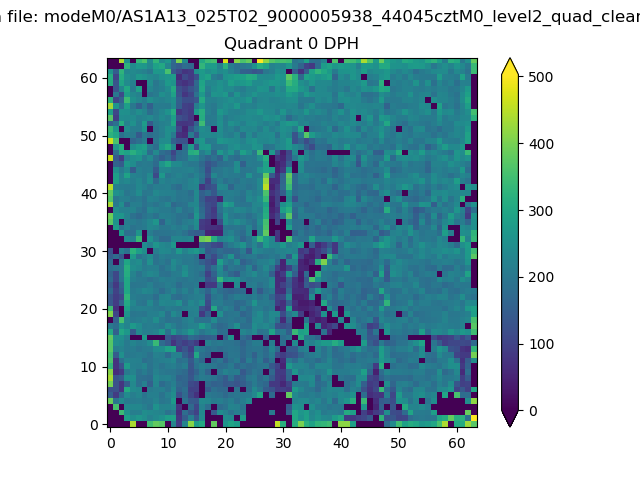 |
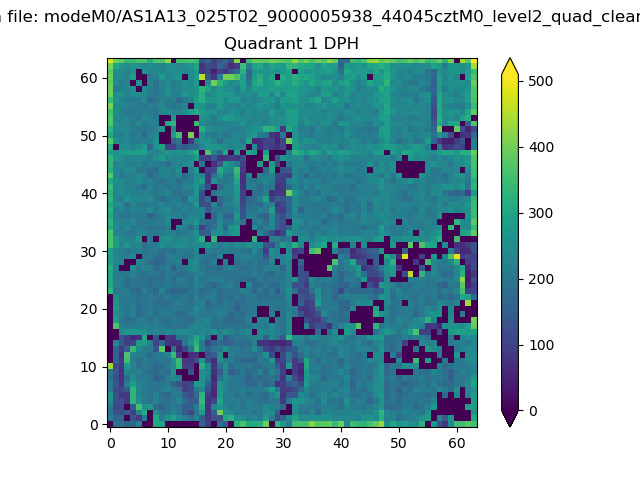 |
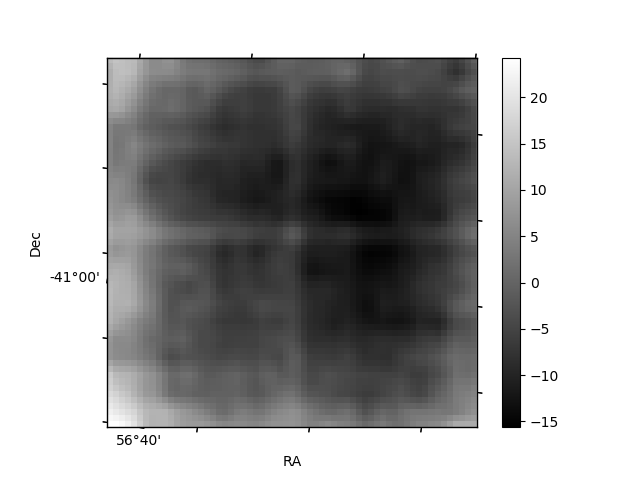
Quadrant B |
|---|---|---|---|
| Quadrant D | 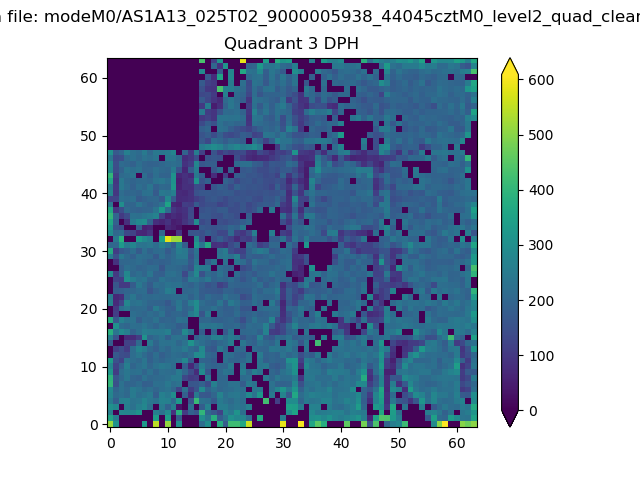 |
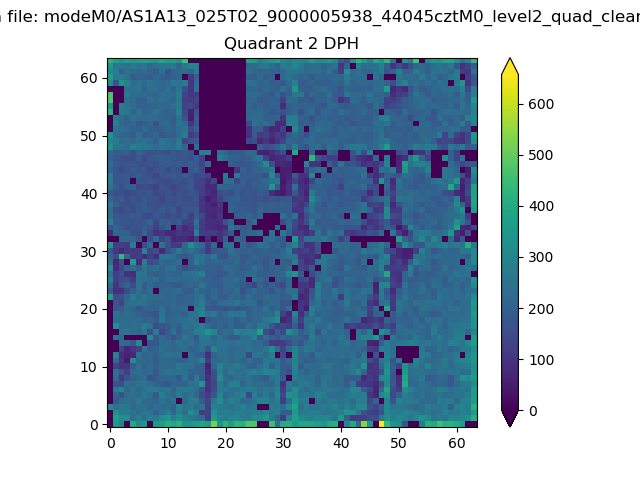 |
Quadrant C |
| Plot type | Count rate plots | Images |
|---|---|---|
| Comparison with Poisson distribution Blue bars denote a histogram of data divided into 1 sec bins. Red curve is a Poisson curve with rate = median count rate of data. |
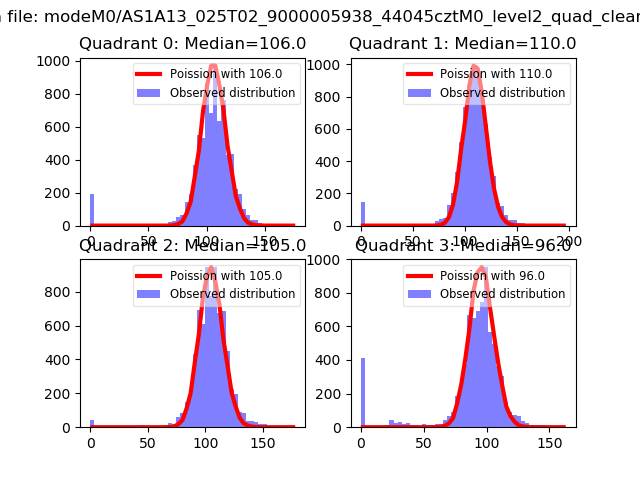 |
 |
| Quadrant-wise count rates Data is divided into 100 sec bins |
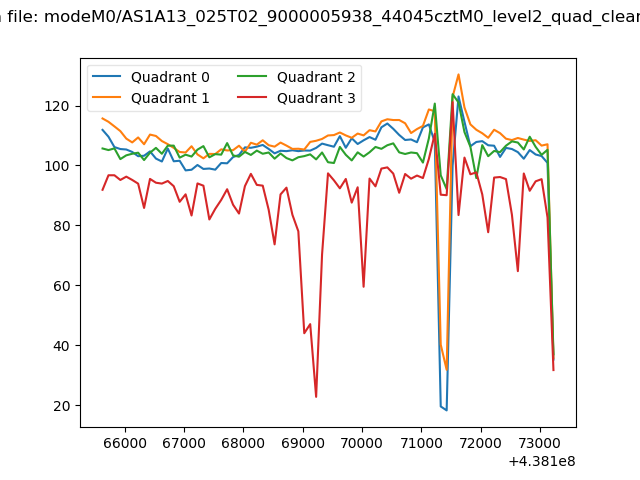 |
|
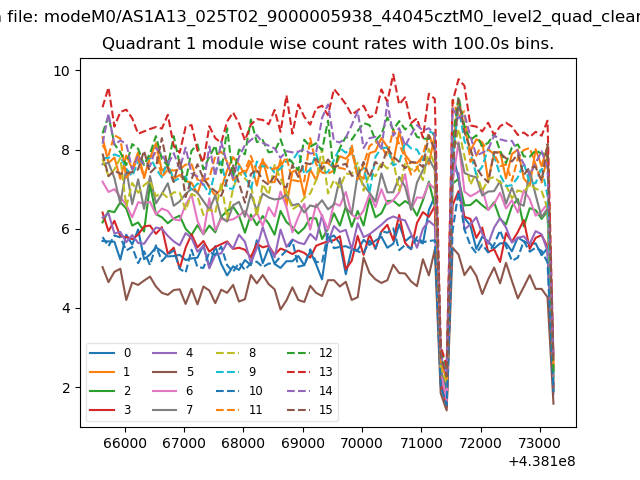
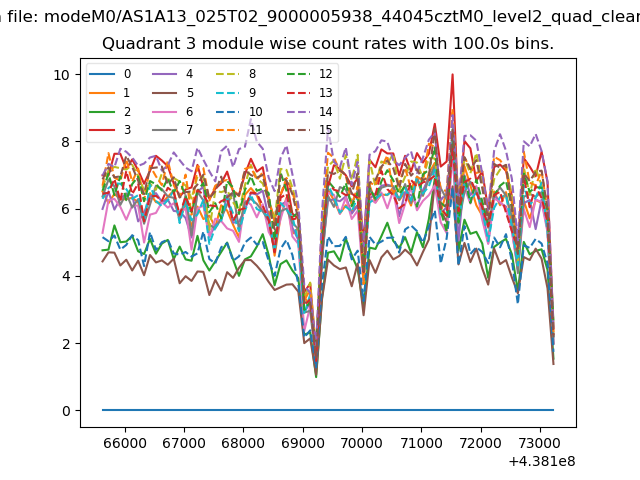
| Module-wise count rates for Quadrant A Data is divided into 100 sec bins |
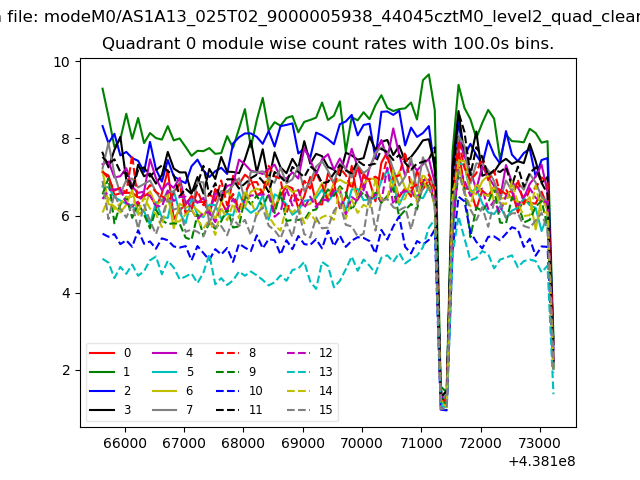 |
 |
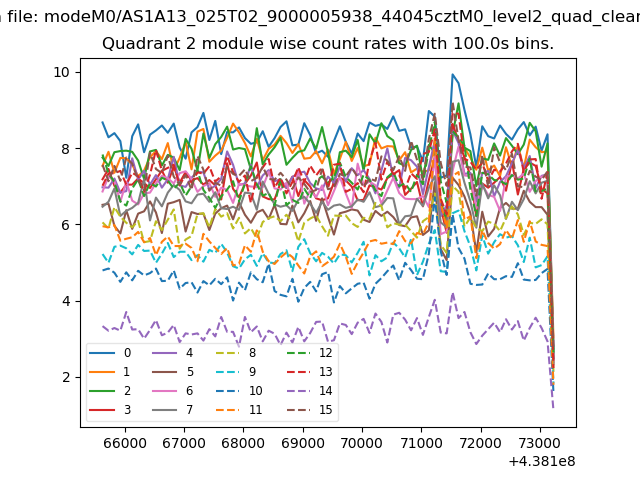
| Module-wise count rates for Quadrant B Data is divided into 100 sec bins |
 |
 |
| Module-wise count rates for Quadrant C Data is divided into 100 sec bins |
 |
 |
| Module-wise count rates for Quadrant D Data is divided into 100 sec bins |
 |
 |
| Parameter | Plot |
|---|---|
| CZT HV Monitor | 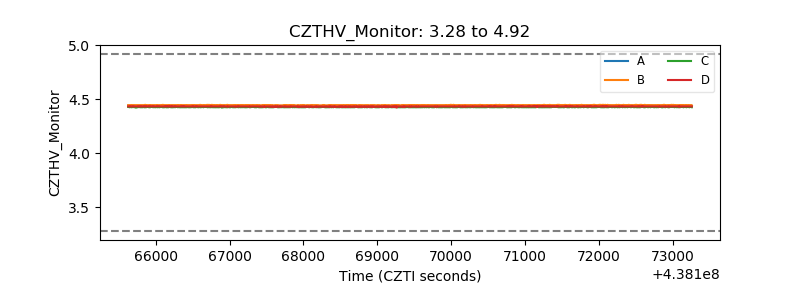 |
| D_VDD | 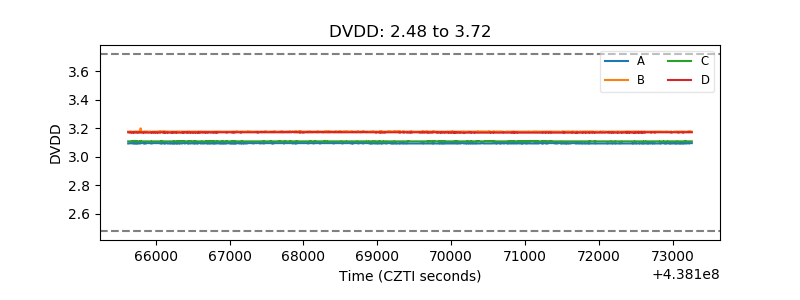 |
| Temperature 1 | 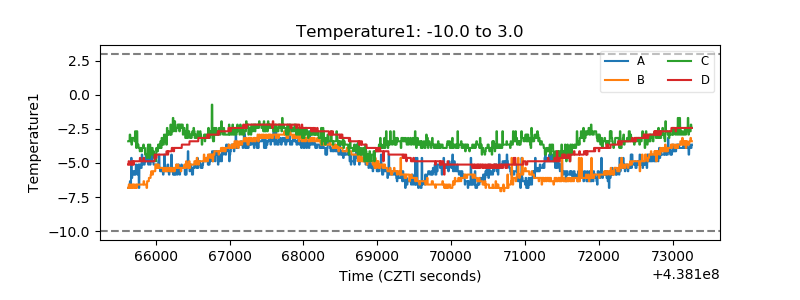 |
| Veto HV Monitor | 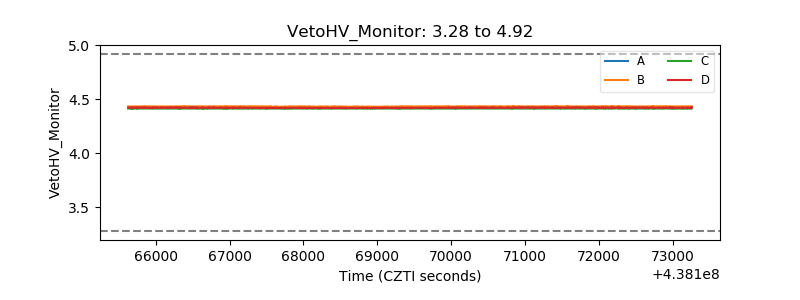 |
| Veto LLD | 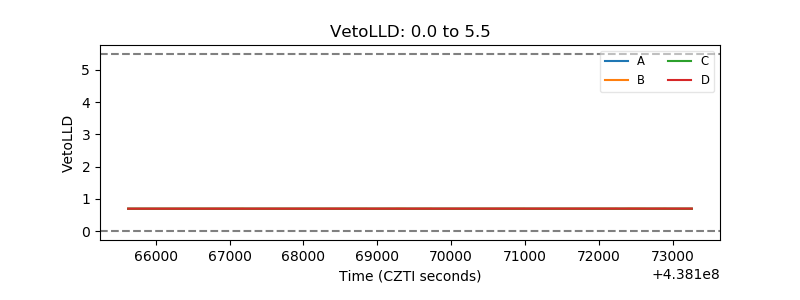 |
| Alpha Counter | 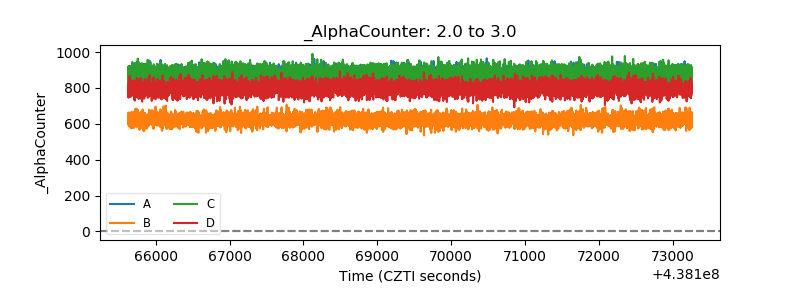 |
| _CPM_Rate | 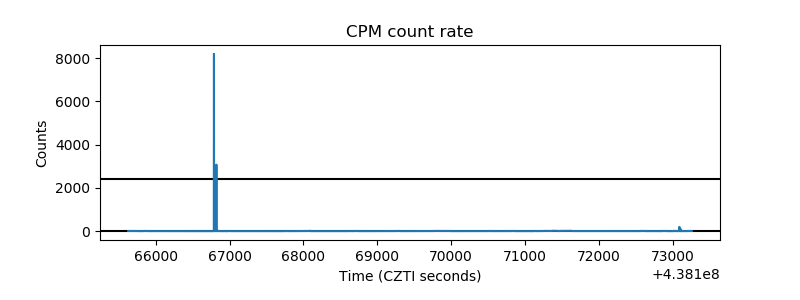 |
| CZT Counter | 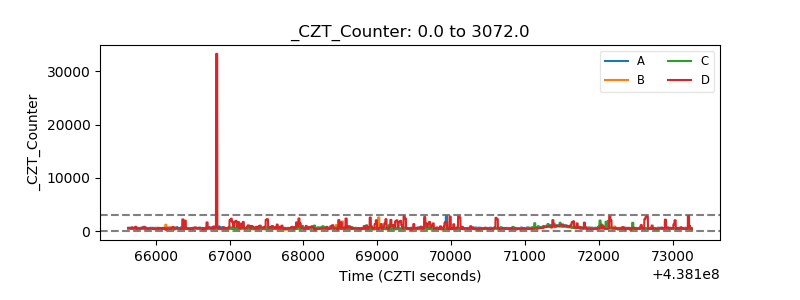 |
| +2.5 Volts monitor | 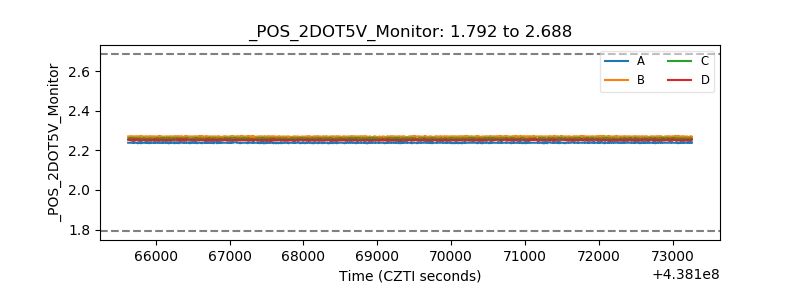 |
| +5 Volts monitor | 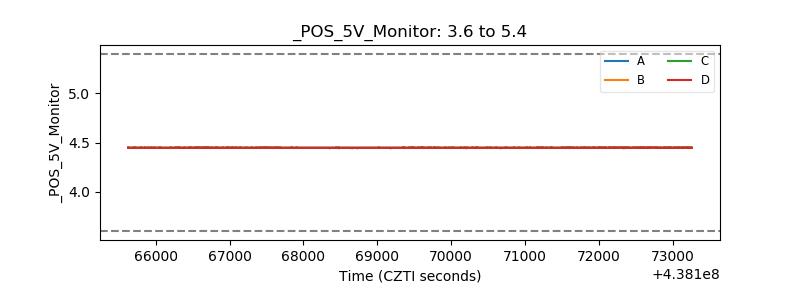 |
| _ROLL_ROT | 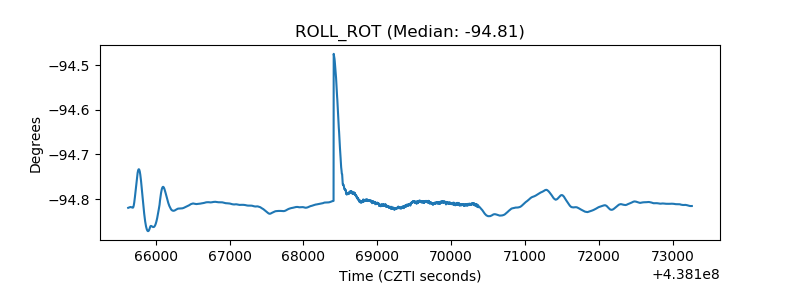 |
| _Roll_DEC | 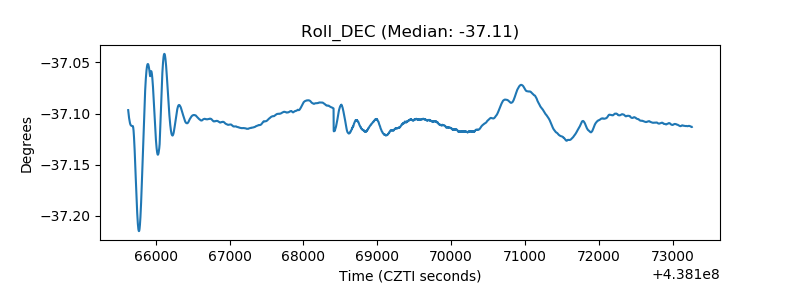 |
| _Roll_RA | 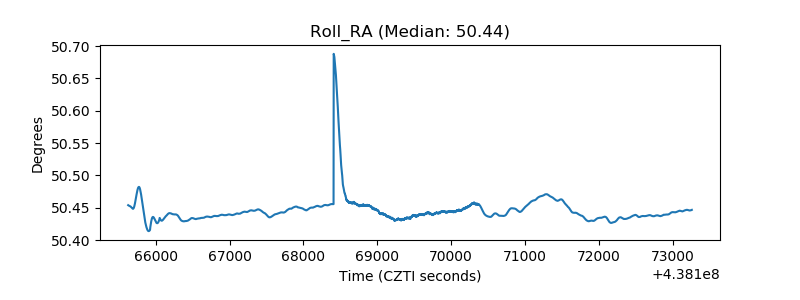 |
| Veto Counter | 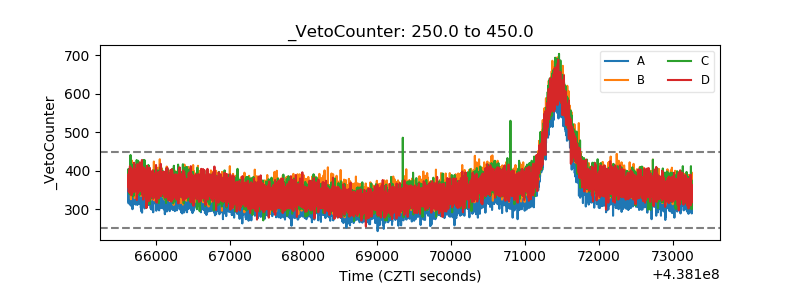 |