| Param | Original file | Final file |
|---|---|---|
| Filename | modeM0/AS1A13_025T02_9000005938_44048cztM0_level2.fits | modeM0/AS1A13_025T02_9000005938_44048cztM0_level2_quad_clean.evt |
| Size (bytes) | 372,669,120 | 90,299,520 |
| Size | 355.4 MB | 86.1 MB |
| Events in quadrant A | 3,407,077 | 596,930 |
| Events in quadrant B | 2,745,410 | 619,163 |
| Events in quadrant C | 3,040,149 | 596,002 |
| Events in quadrant D | 4,157,308 | 522,426 |
| Mode M0 | |||
|---|---|---|---|
| Quadrant | BADHDUFLAG | Total packets | Discarded packets |
| A | 0 | 13664 | 1 |
| B | 0 | 12176 | 0 |
| C | 0 | 13061 | 0 |
| D | 0 | 16270 | 0 |
| Mode SS | |||
|---|---|---|---|
| Quadrant | BADHDUFLAG | Total packets | Discarded packets |
| A | 0 | 114 | 0 |
| B | 0 | 114 | 0 |
| C | 0 | 114 | 0 |
| D | 0 | 114 | 0 |
| Quadrant | Total seconds | Saturated seconds | Saturation percentage |
|---|---|---|---|
| A | 5713 | 158 | 2.765622% |
| B | 5713 | 149 | 2.608087% |
| C | 5713 | 141 | 2.468055% |
| D | 5713 | 464 | 8.121827% |
Noise dominated data is calculated using 1-second bins in cleaned event files. If a bin has >2000 counts, and if more than 50% of those come from <1% of pixels, then it is considered to be noise-dominated and hence unusable.
| Quadrant | # 1 sec bins | Bins with >0 counts | Bins with >2000 counts | High rate bins dominated by noise | Noise dominated (total time) | Noise dominated (detector-on time) | Marked lightcurve |
|---|---|---|---|---|---|---|---|
| A | 5713 | 5713 | 0 | 0 | 0.00% | 0.00% | 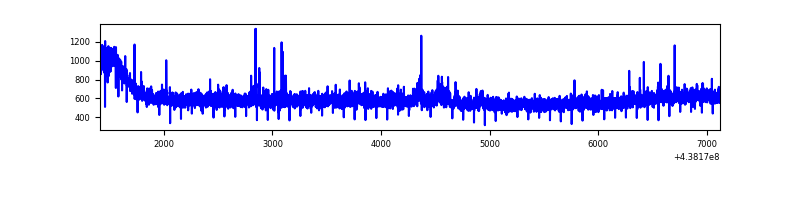 |
| B | 5713 | 5713 | 8 | 8 | 0.14% | 0.14% | 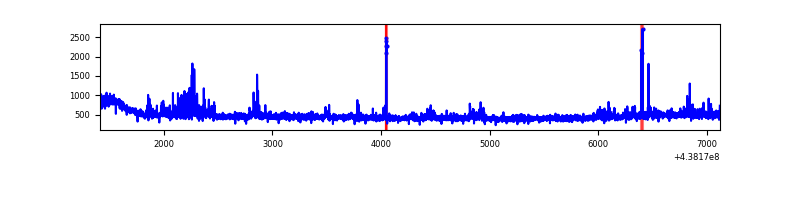 |
| C | 5713 | 5713 | 52 | 52 | 0.91% | 0.91% | 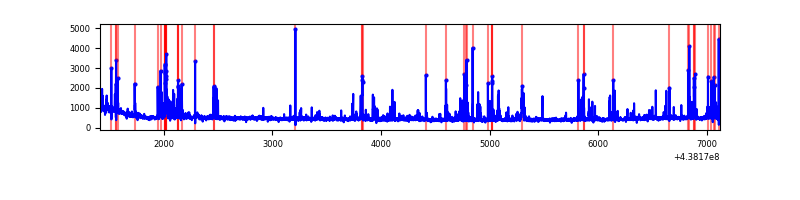 |
| D | 5713 | 5713 | 344 | 344 | 6.02% | 6.02% | 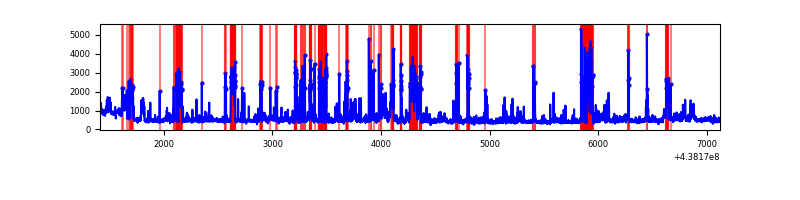 |
Top three noisy pixels from each quadrant. If the there are fewer than three noisy pixels in the level2.evt file, extra rows are filled as -1
| Pixel properties | Quadrant properties | ||||||
|---|---|---|---|---|---|---|---|
| Quadrant | DetID | PixID | Counts | Sigma | Mean | Median | Sigma |
| A | 10 | 83 | 851085 | 6237.68 | 650 | 635 | 136.3 |
| A | 10 | 255 | 26542 | 190.02 | 650 | 635 | 136.3 |
| A | 7 | 3 | 11762 | 81.61 | 650 | 635 | 136.3 |
| B | 0 | 213 | 123343 | 938.43 | 647 | 625 | 130.8 |
| B | 0 | 200 | 41566 | 313.08 | 647 | 625 | 130.8 |
| B | 12 | 111 | 16941 | 124.77 | 647 | 625 | 130.8 |
| C | 14 | 254 | 288078 | 1905.56 | 634 | 637 | 150.8 |
| C | 15 | 158 | 151985 | 1003.34 | 634 | 637 | 150.8 |
| C | 3 | 233 | 87720 | 577.31 | 634 | 637 | 150.8 |
| D | 1 | 52 | 1044753 | 6641.19 | 620 | 602 | 157.2 |
| D | 5 | 235 | 369516 | 2346.43 | 620 | 602 | 157.2 |
| D | 2 | 249 | 82858 | 523.18 | 620 | 602 | 157.2 |
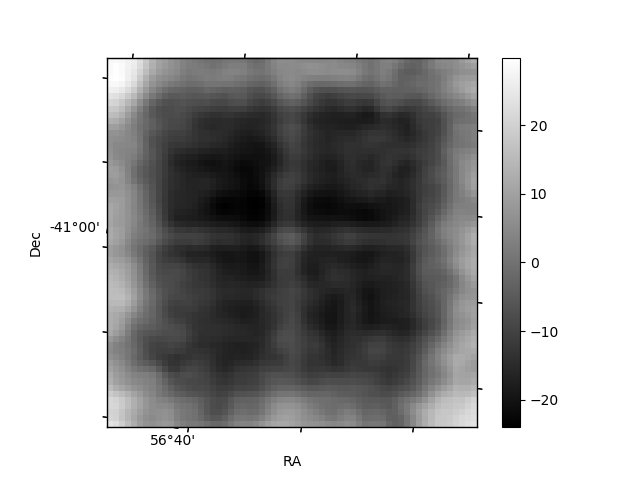
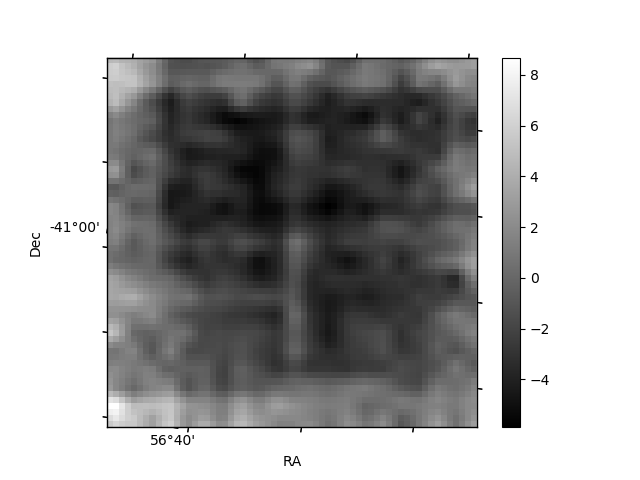
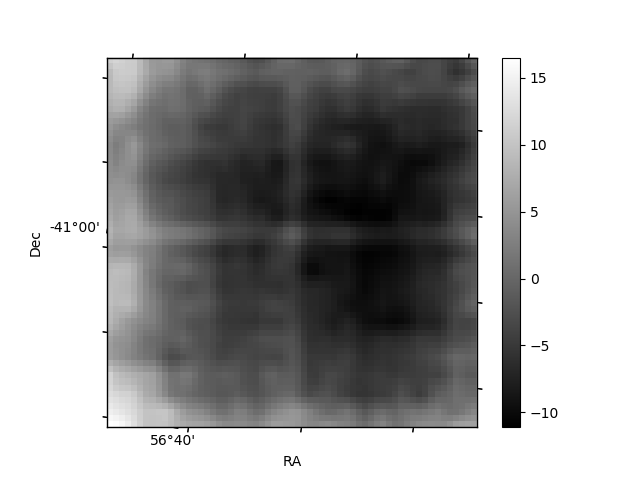
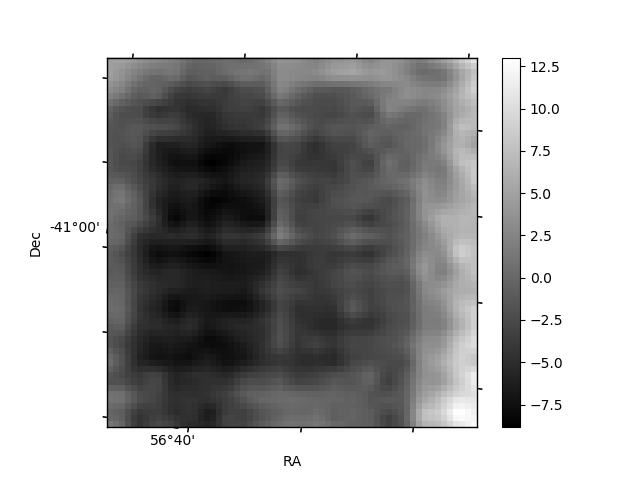
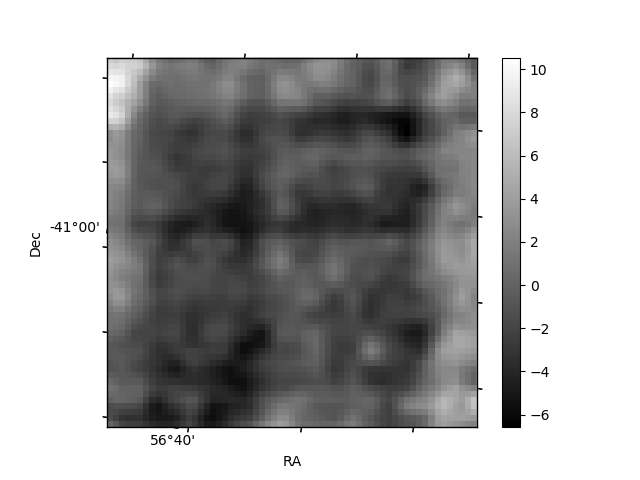
Histogram calculated using DETX and DETY for each event in the final _common_clean file
| Quadrant A | 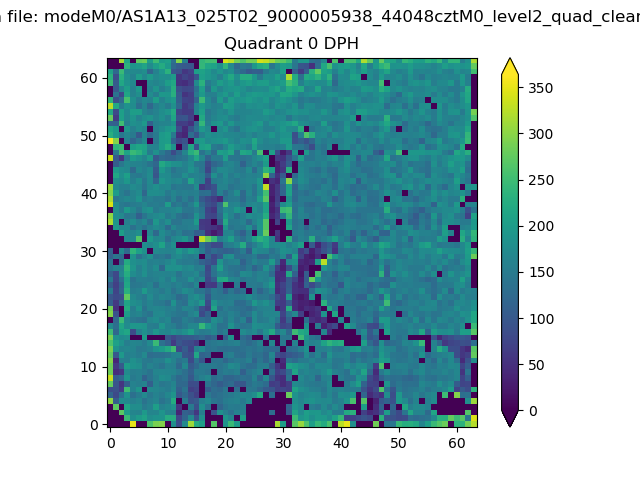 |
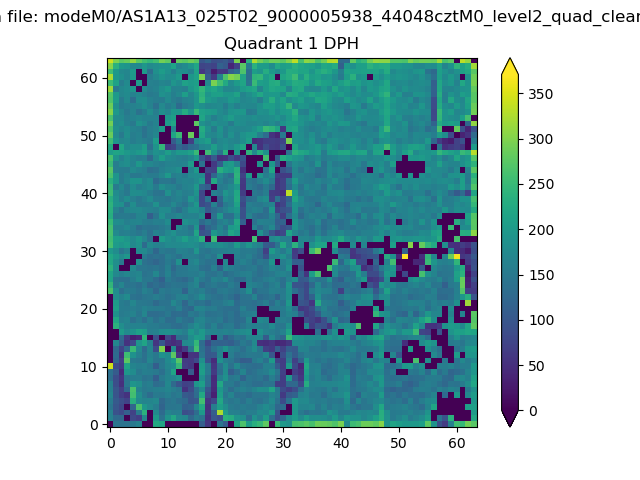 |
Quadrant B |
|---|---|---|---|
| Quadrant D | 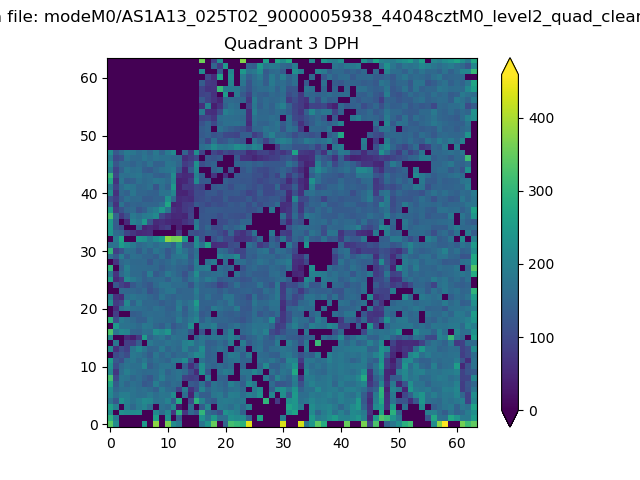 |
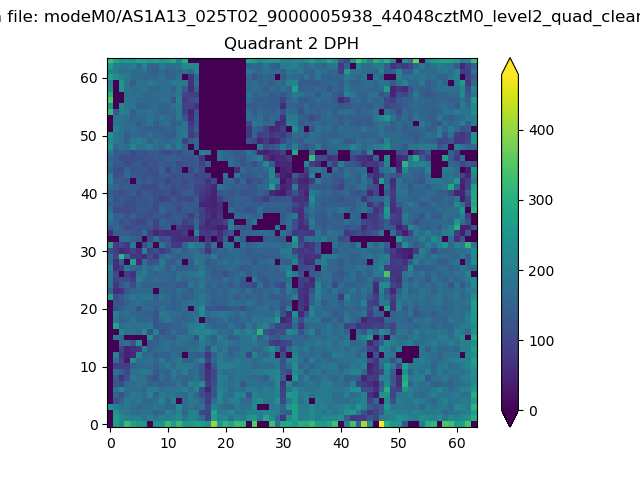 |
Quadrant C |
| Plot type | Count rate plots | Images |
|---|---|---|
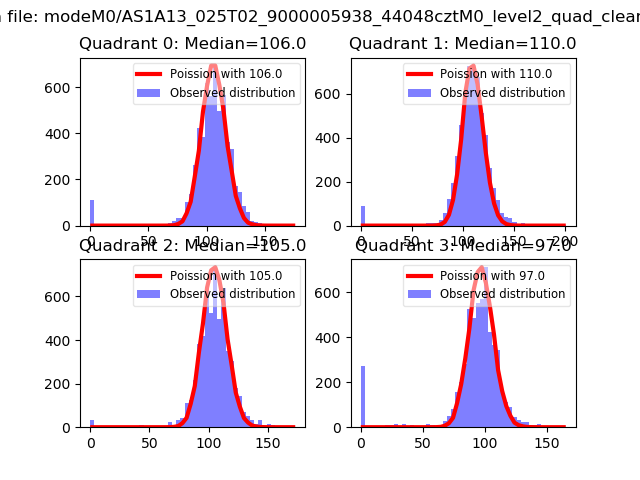
| Comparison with Poisson distribution Blue bars denote a histogram of data divided into 1 sec bins. Red curve is a Poisson curve with rate = median count rate of data. |
 |
 |
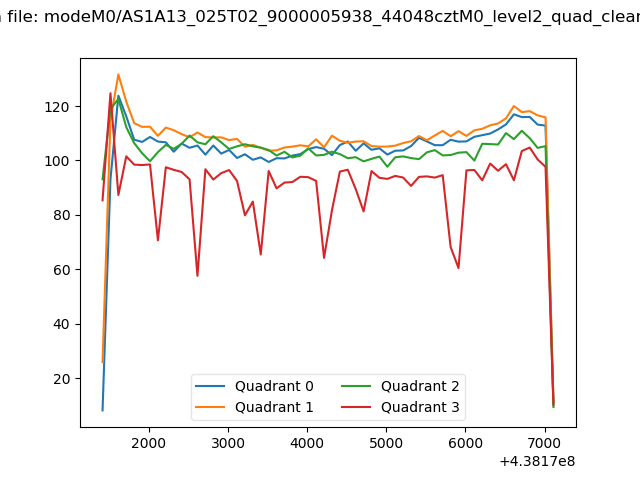
| Quadrant-wise count rates Data is divided into 100 sec bins |
 |
|
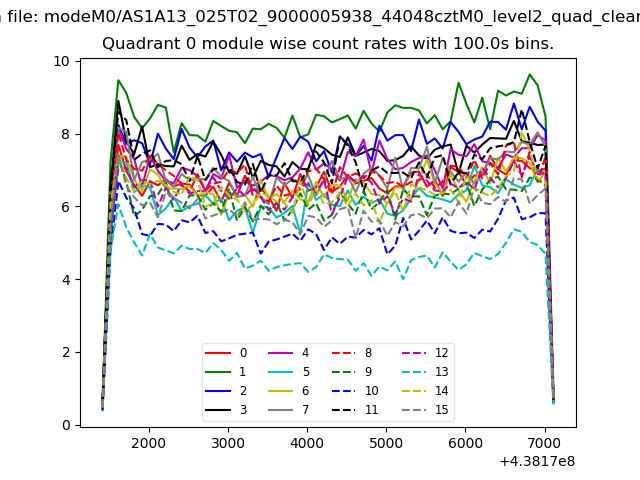
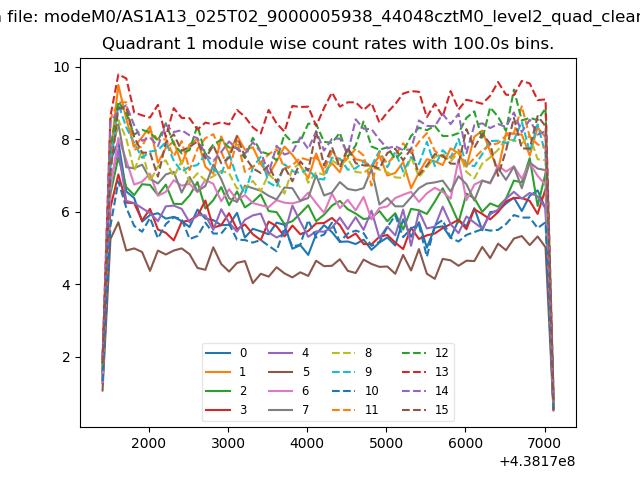
| Module-wise count rates for Quadrant A Data is divided into 100 sec bins |
 |
 |
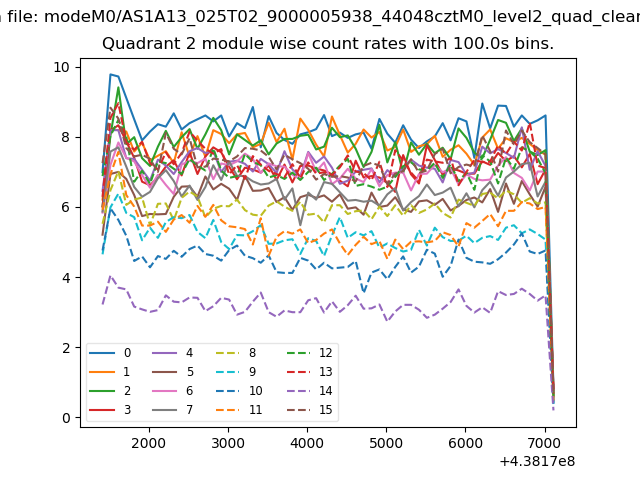
| Module-wise count rates for Quadrant B Data is divided into 100 sec bins |
 |
 |
| Module-wise count rates for Quadrant C Data is divided into 100 sec bins |
 |
 |
| Module-wise count rates for Quadrant D Data is divided into 100 sec bins |
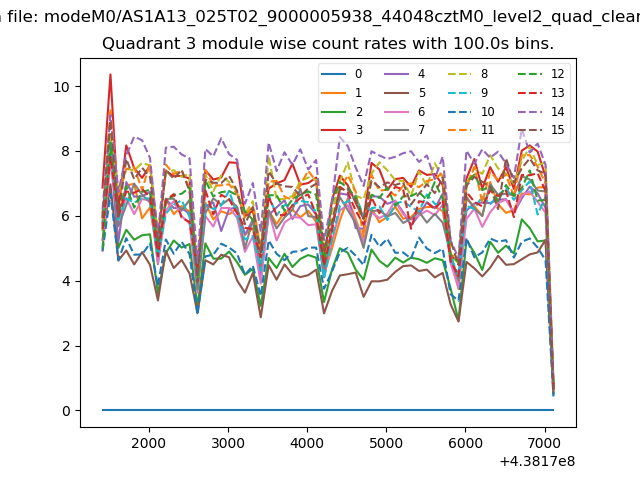 |
 |
| Parameter | Plot |
|---|---|
| CZT HV Monitor |  |
| D_VDD | 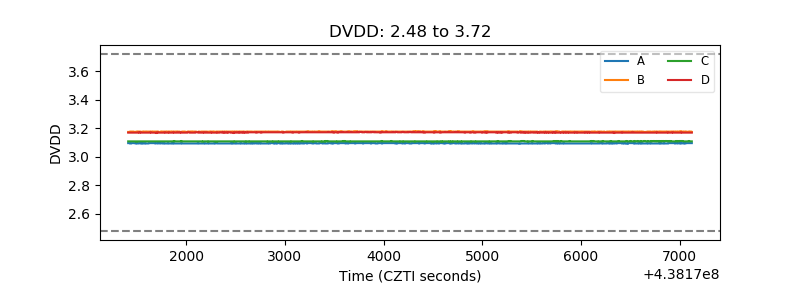 |
| Temperature 1 | 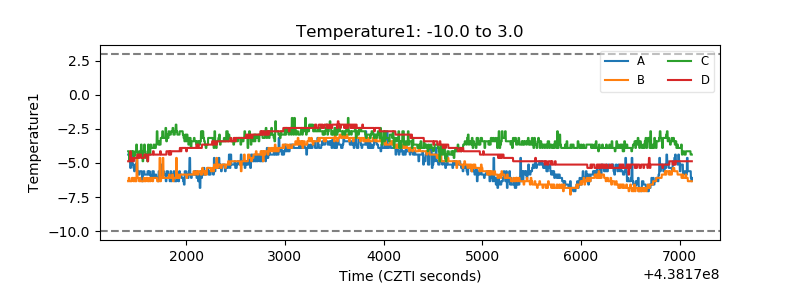 |
| Veto HV Monitor | 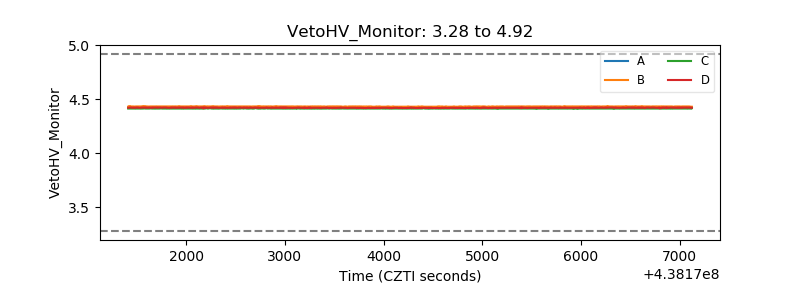 |
| Veto LLD | 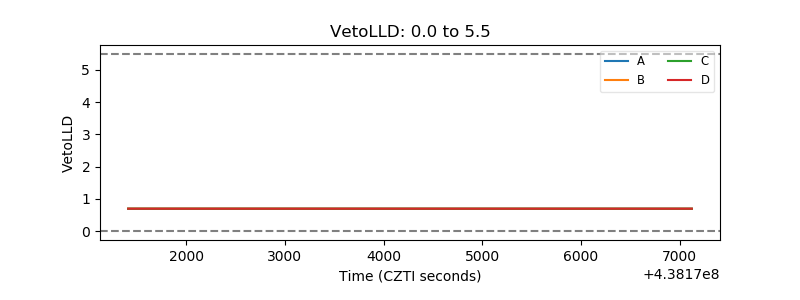 |
| Alpha Counter | 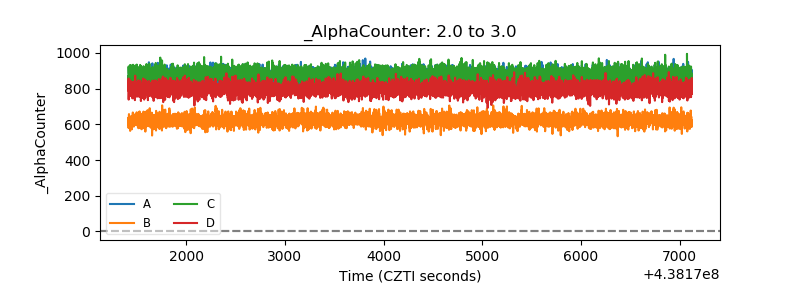 |
| _CPM_Rate | 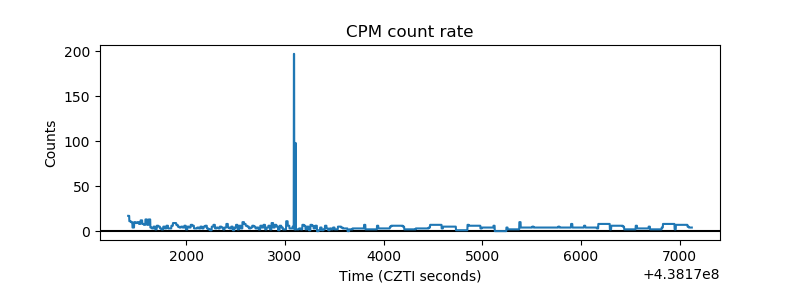 |
| CZT Counter | 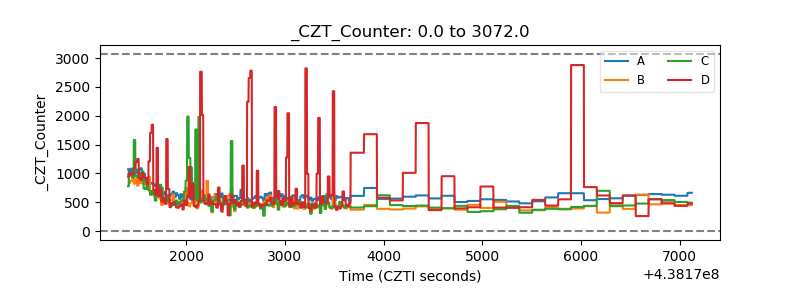 |
| +2.5 Volts monitor | 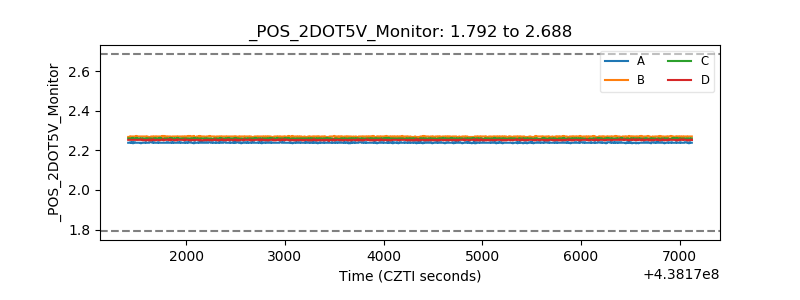 |
| +5 Volts monitor | 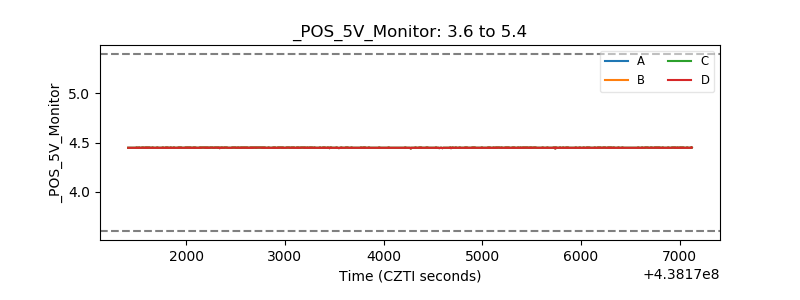 |
| _ROLL_ROT | 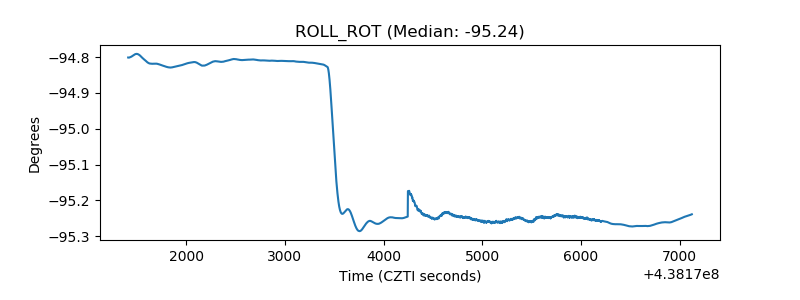 |
| _Roll_DEC | 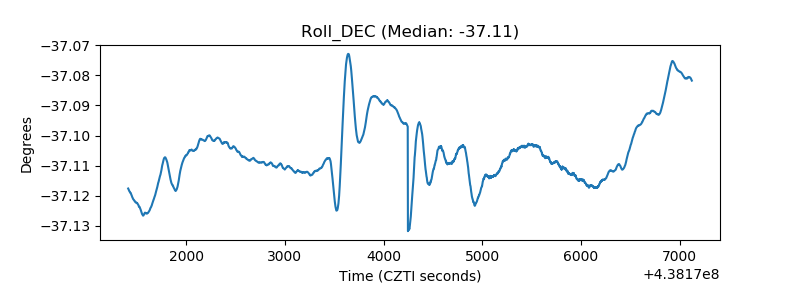 |
| _Roll_RA | 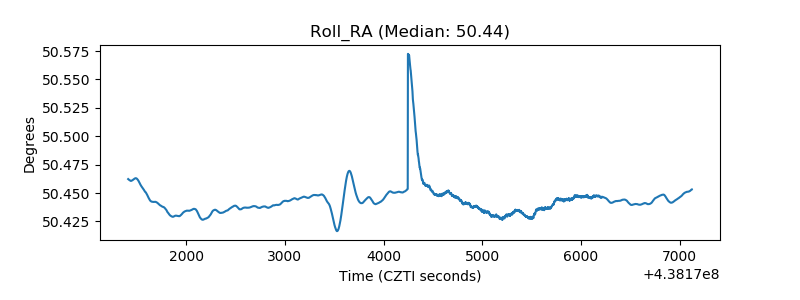 |
| Veto Counter | 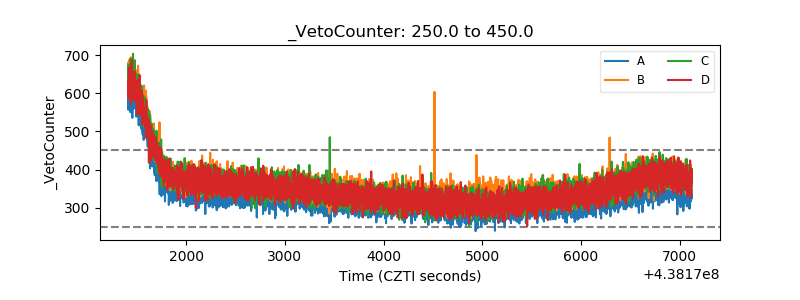 |