| Param | Original file | Final file |
|---|---|---|
| Filename | modeM0/AS1A13_025T02_9000005938_44049cztM0_level2.fits | modeM0/AS1A13_025T02_9000005938_44049cztM0_level2_quad_clean.evt |
| Size (bytes) | 1,194,989,760 | 300,268,800 |
| Size | 1.1 GB | 286.4 MB |
| Events in quadrant A | 12,253,373 | 1,990,263 |
| Events in quadrant B | 8,861,857 | 2,061,818 |
| Events in quadrant C | 10,265,504 | 1,950,354 |
| Events in quadrant D | 11,388,451 | 1,784,242 |
| Mode M0 | |||
|---|---|---|---|
| Quadrant | BADHDUFLAG | Total packets | Discarded packets |
| A | 0 | 49450 | 4 |
| B | 0 | 39564 | 4 |
| C | 0 | 43958 | 4 |
| D | 0 | 47230 | 4 |
| Mode M9 | |||
|---|---|---|---|
| Quadrant | BADHDUFLAG | Total packets | Discarded packets |
| A | 0 | 26 | 0 |
| B | 0 | 26 | 0 |
| C | 0 | 26 | 0 |
| D | 0 | 26 | 0 |
| Mode SS | |||
|---|---|---|---|
| Quadrant | BADHDUFLAG | Total packets | Discarded packets |
| A | 0 | 388 | 0 |
| B | 0 | 388 | 0 |
| C | 0 | 388 | 0 |
| D | 0 | 388 | 0 |
| Quadrant | Total seconds | Saturated seconds | Saturation percentage |
|---|---|---|---|
| A | 18928 | 554 | 2.926881% |
| B | 18929 | 414 | 2.187120% |
| C | 18929 | 526 | 2.778805% |
| D | 18929 | 562 | 2.968989% |
Noise dominated data is calculated using 1-second bins in cleaned event files. If a bin has >2000 counts, and if more than 50% of those come from <1% of pixels, then it is considered to be noise-dominated and hence unusable.
| Quadrant | # 1 sec bins | Bins with >0 counts | Bins with >2000 counts | High rate bins dominated by noise | Noise dominated (total time) | Noise dominated (detector-on time) | Marked lightcurve |
|---|---|---|---|---|---|---|---|
| A | 21593 | 18932 | 91 | 91 | 0.42% | 0.48% | 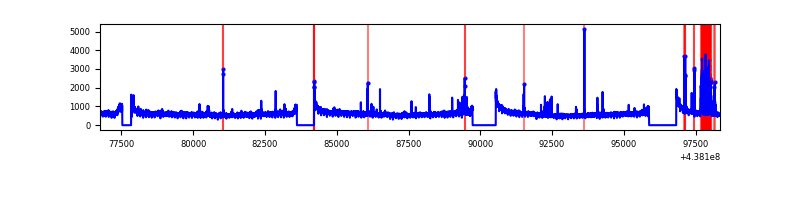 |
| B | 21594 | 18933 | 8 | 8 | 0.04% | 0.04% | 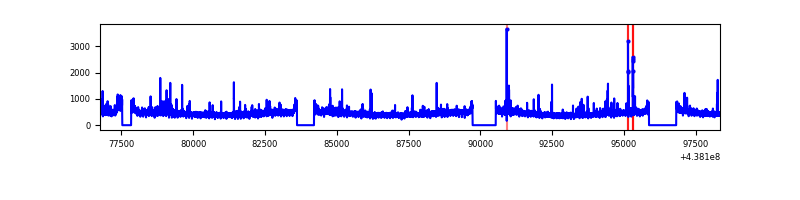 |
| C | 21594 | 18933 | 195 | 195 | 0.90% | 1.03% | 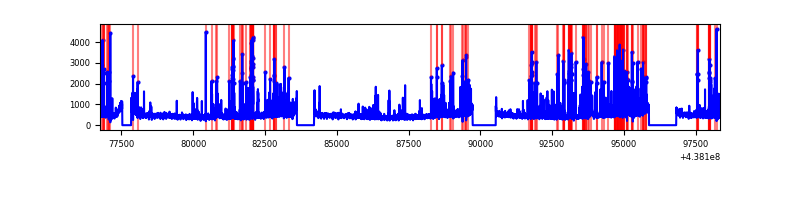 |
| D | 21594 | 18933 | 213 | 213 | 0.99% | 1.13% | 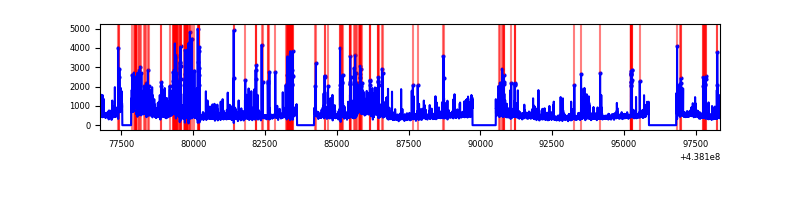 |
Top three noisy pixels from each quadrant. If the there are fewer than three noisy pixels in the level2.evt file, extra rows are filled as -1
| Pixel properties | Quadrant properties | ||||||
|---|---|---|---|---|---|---|---|
| Quadrant | DetID | PixID | Counts | Sigma | Mean | Median | Sigma |
| A | 10 | 83 | 3175763 | 7189.13 | 2145 | 2096 | 441.5 |
| A | 15 | 222 | 349424 | 786.78 | 2145 | 2096 | 441.5 |
| A | 15 | 223 | 214927 | 482.11 | 2145 | 2096 | 441.5 |
| B | 0 | 213 | 258455 | 602.71 | 2149 | 2081 | 425.4 |
| B | 0 | 200 | 57709 | 130.78 | 2149 | 2081 | 425.4 |
| B | 12 | 111 | 55780 | 126.24 | 2149 | 2081 | 425.4 |
| C | 14 | 254 | 1589648 | 3198.2 | 2100 | 2111 | 496.4 |
| C | 3 | 233 | 238895 | 477.02 | 2100 | 2111 | 496.4 |
| C | 12 | 249 | 161056 | 320.21 | 2100 | 2111 | 496.4 |
| D | 1 | 52 | 1584304 | 3011.04 | 2097 | 2032 | 525.5 |
| D | 5 | 222 | 1078373 | 2048.26 | 2097 | 2032 | 525.5 |
| D | 5 | 235 | 155634 | 292.3 | 2097 | 2032 | 525.5 |
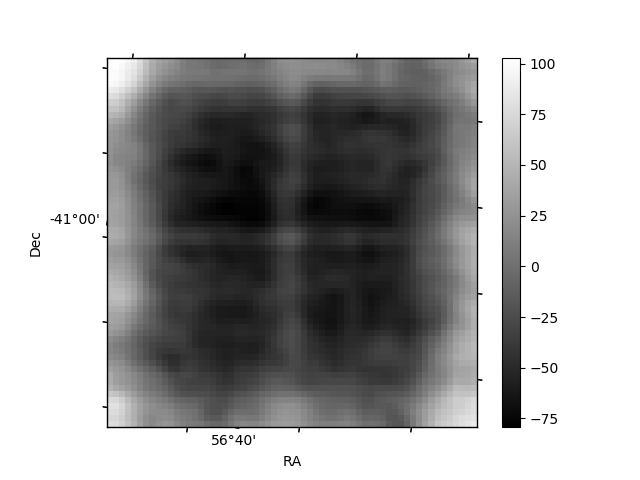
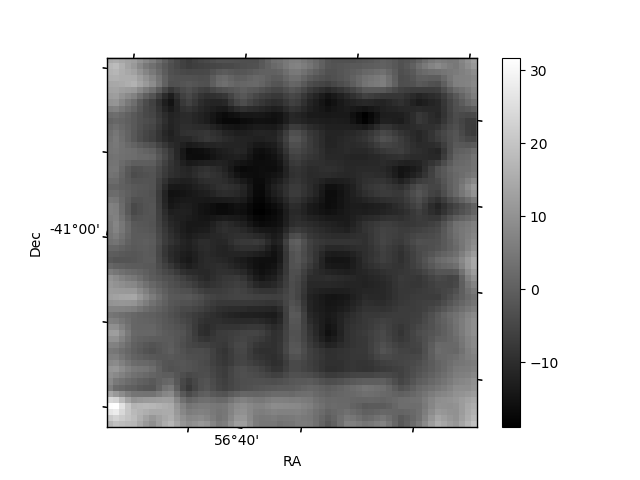
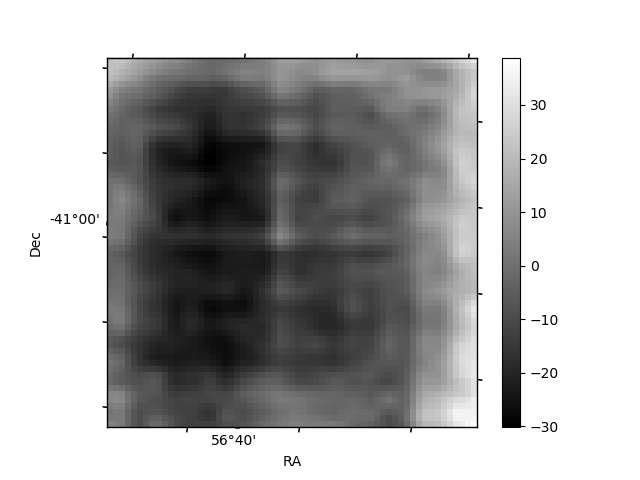
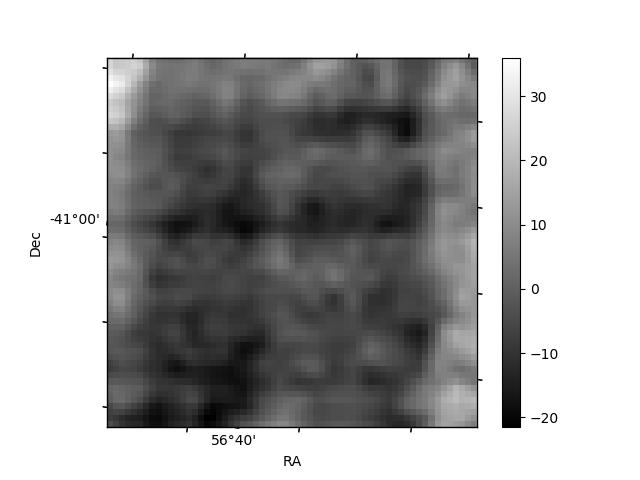
Histogram calculated using DETX and DETY for each event in the final _common_clean file
| Quadrant A | 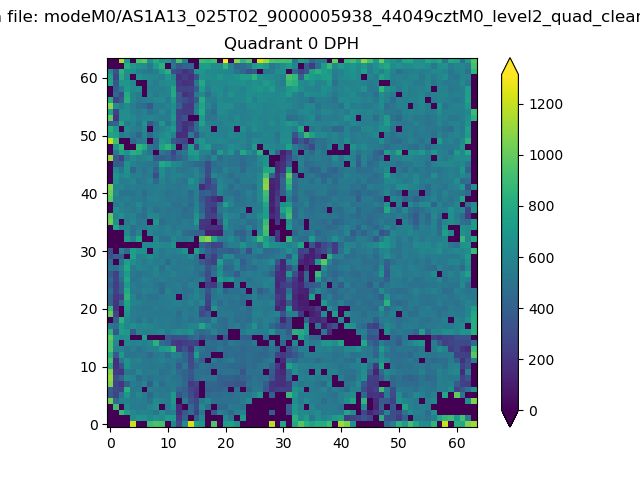 |
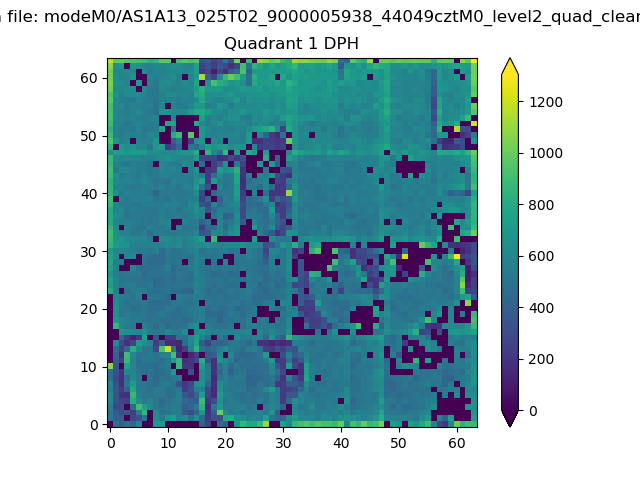 |
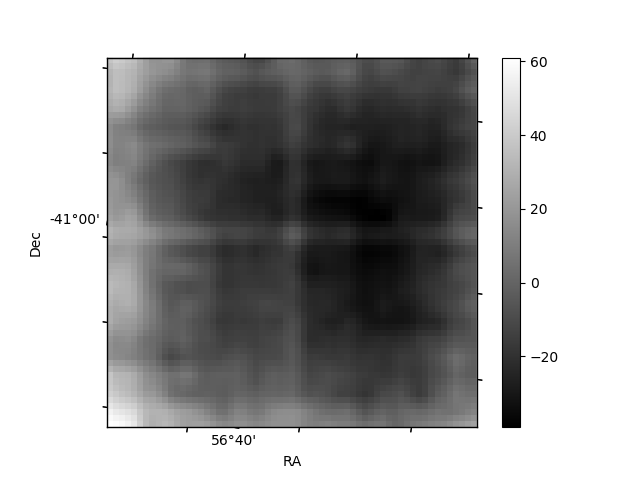
Quadrant B |
|---|---|---|---|
| Quadrant D | 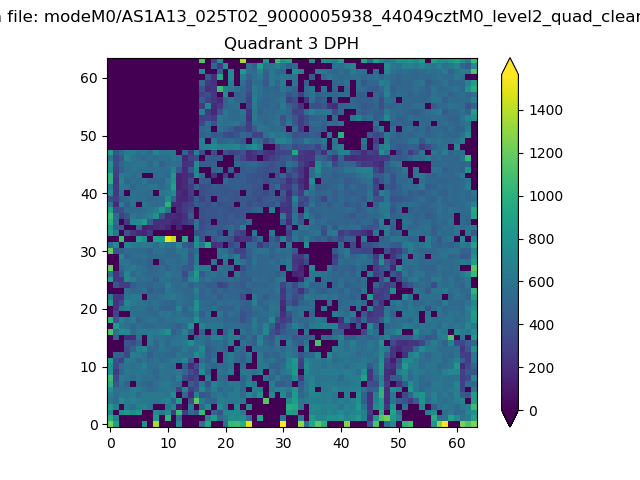 |
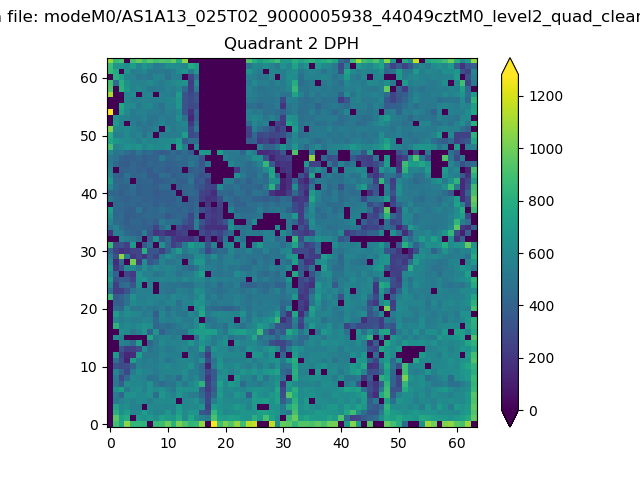 |
Quadrant C |
| Plot type | Count rate plots | Images |
|---|---|---|
| Comparison with Poisson distribution Blue bars denote a histogram of data divided into 1 sec bins. Red curve is a Poisson curve with rate = median count rate of data. |
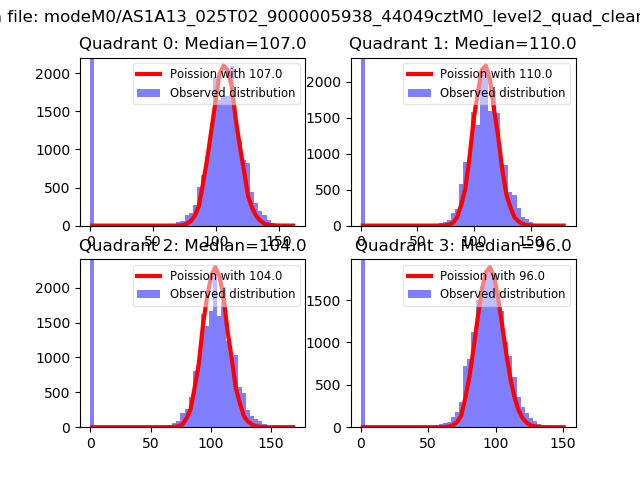 |
 |
| Quadrant-wise count rates Data is divided into 100 sec bins |
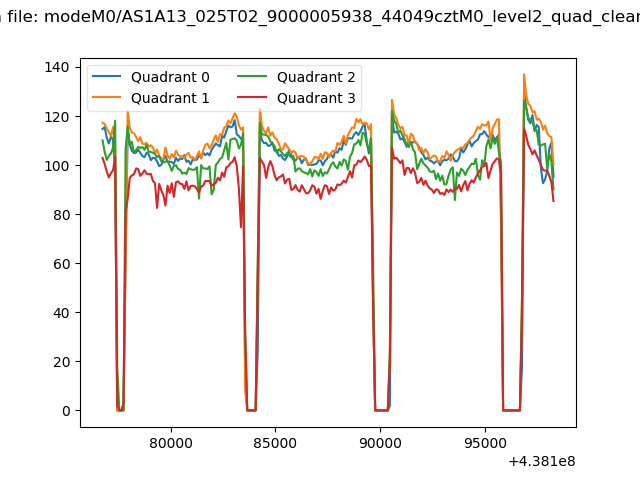 |
|
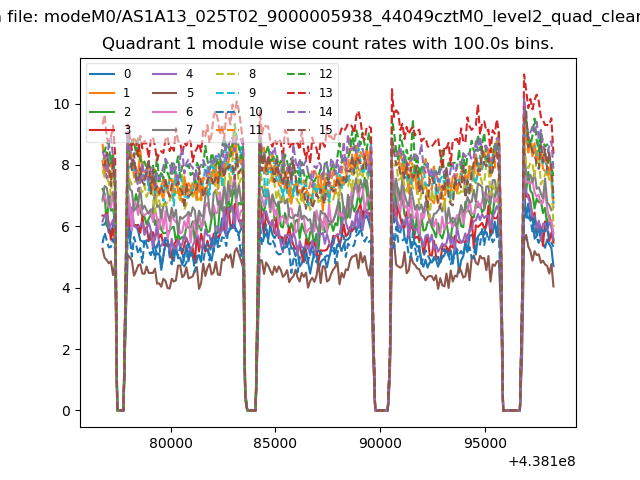
| Module-wise count rates for Quadrant A Data is divided into 100 sec bins |
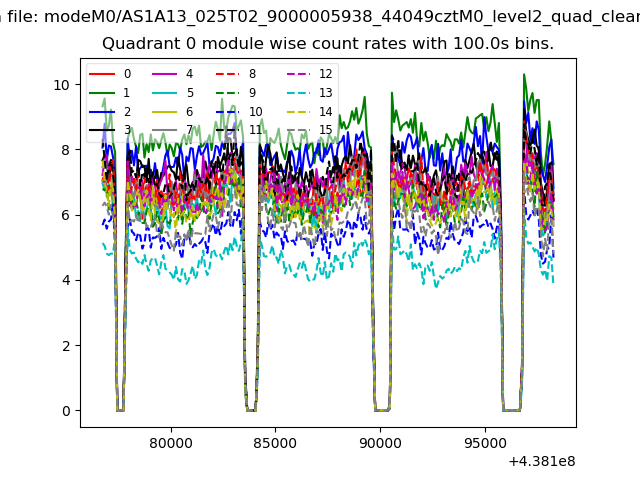 |
 |
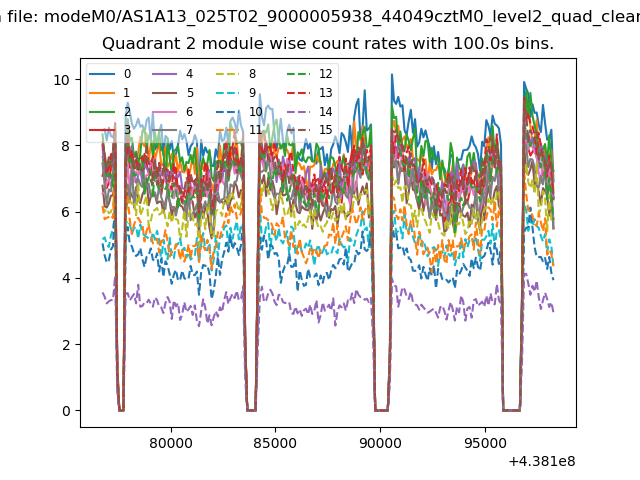
| Module-wise count rates for Quadrant B Data is divided into 100 sec bins |
 |
 |
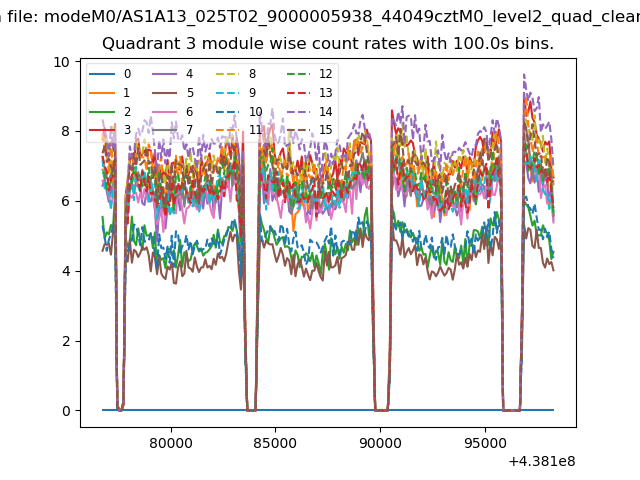
| Module-wise count rates for Quadrant C Data is divided into 100 sec bins |
 |
 |
| Module-wise count rates for Quadrant D Data is divided into 100 sec bins |
 |
 |
| Parameter | Plot |
|---|---|
| CZT HV Monitor | 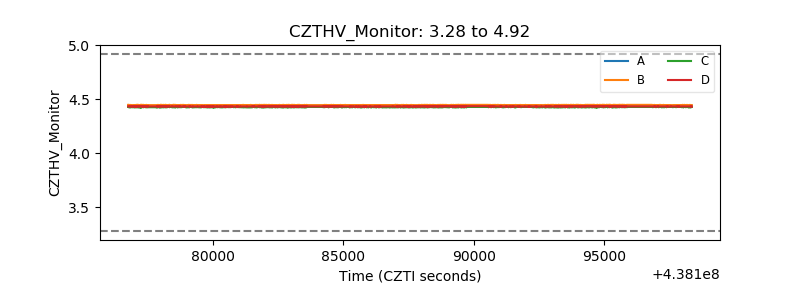 |
| D_VDD | 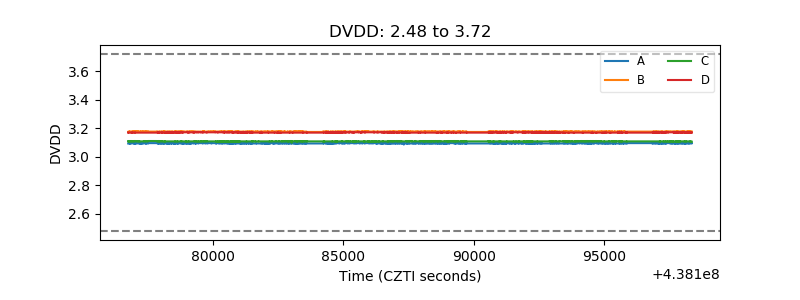 |
| Temperature 1 | 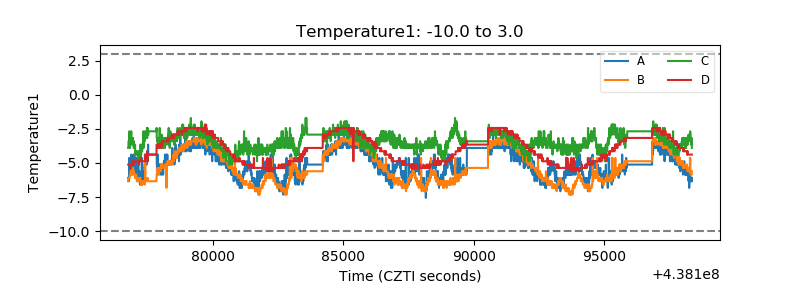 |
| Veto HV Monitor | 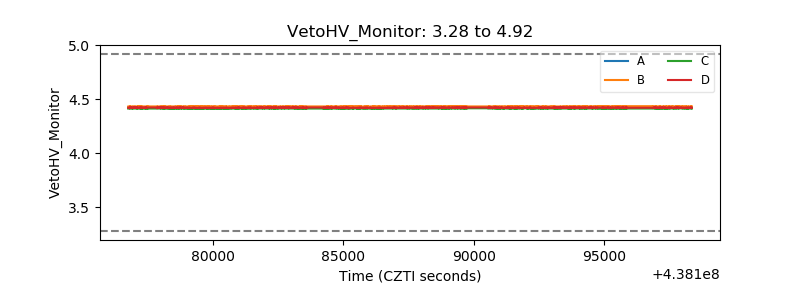 |
| Veto LLD | 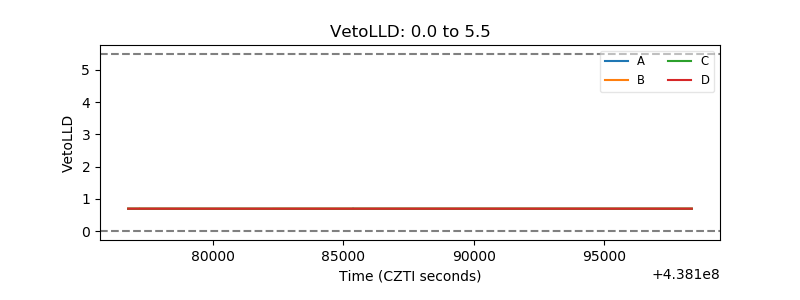 |
| Alpha Counter | 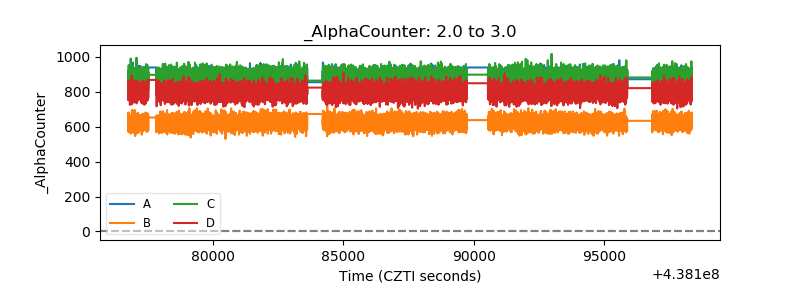 |
| _CPM_Rate | 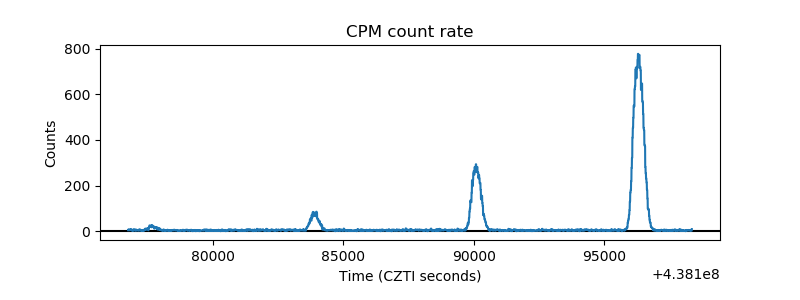 |
| CZT Counter | 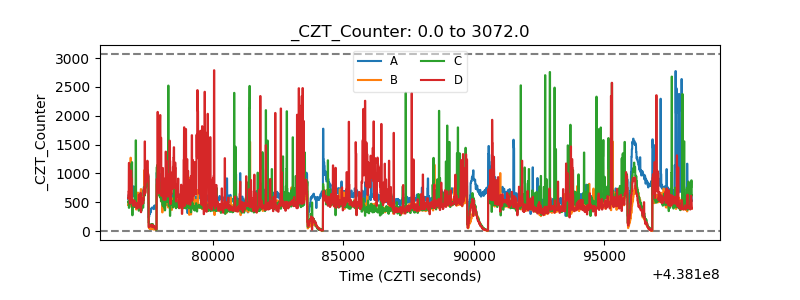 |
| +2.5 Volts monitor | 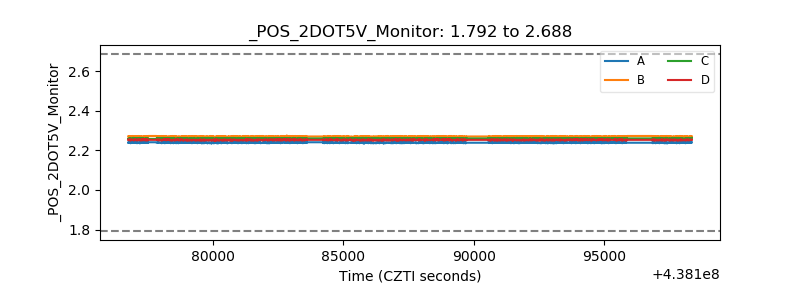 |
| +5 Volts monitor | 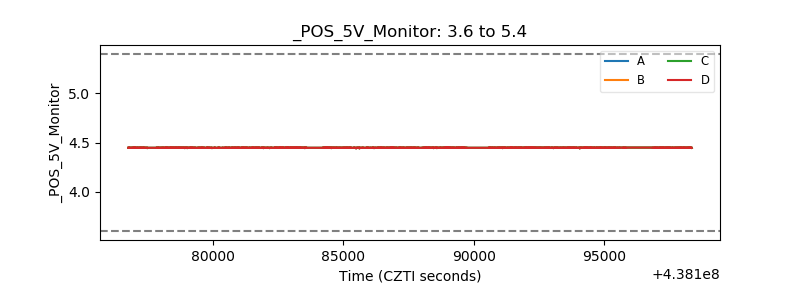 |
| _ROLL_ROT | 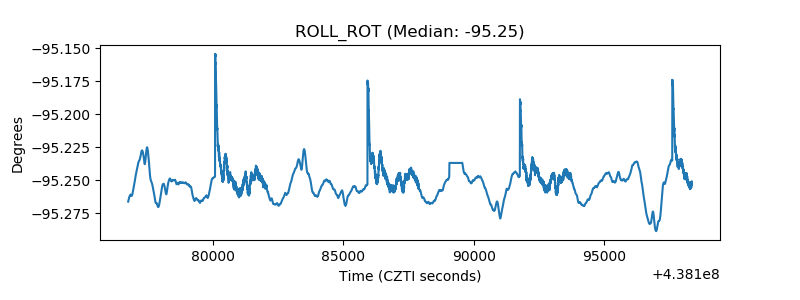 |
| _Roll_DEC | 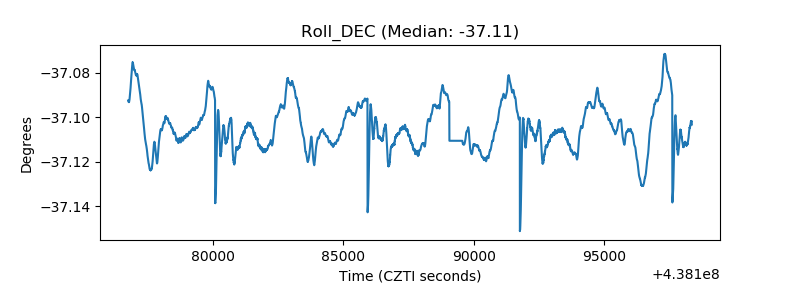 |
| _Roll_RA | 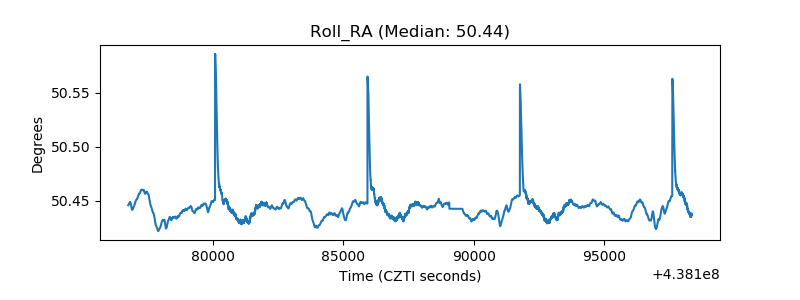 |
| Veto Counter | 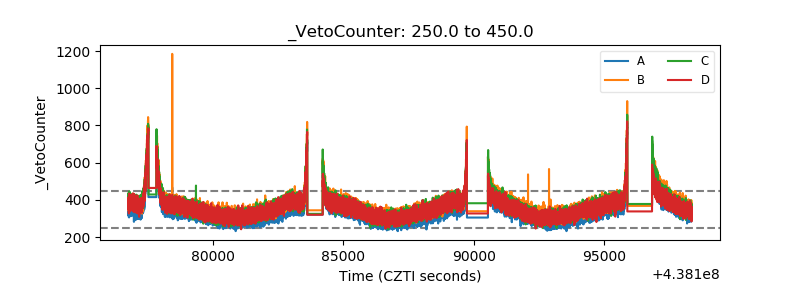 |