| Param | Original file | Final file |
|---|---|---|
| Filename | modeM0/AS1A13_025T02_9000005938_44051cztM0_level2.fits | modeM0/AS1A13_025T02_9000005938_44051cztM0_level2_quad_clean.evt |
| Size (bytes) | 441,083,520 | 110,200,320 |
| Size | 420.7 MB | 105.1 MB |
| Events in quadrant A | 4,635,560 | 738,422 |
| Events in quadrant B | 3,286,023 | 779,757 |
| Events in quadrant C | 4,082,008 | 703,672 |
| Events in quadrant D | 3,809,433 | 653,691 |
| Mode M0 | |||
|---|---|---|---|
| Quadrant | BADHDUFLAG | Total packets | Discarded packets |
| A | 0 | 18247 | 2 |
| B | 0 | 14358 | 2 |
| C | 0 | 16744 | 2 |
| D | 0 | 16079 | 2 |
| Mode M9 | |||
|---|---|---|---|
| Quadrant | BADHDUFLAG | Total packets | Discarded packets |
| A | 0 | 16 | 0 |
| B | 0 | 17 | 0 |
| C | 0 | 17 | 0 |
| D | 0 | 17 | 0 |
| Mode SS | |||
|---|---|---|---|
| Quadrant | BADHDUFLAG | Total packets | Discarded packets |
| A | 0 | 134 | 0 |
| B | 0 | 134 | 0 |
| C | 0 | 134 | 0 |
| D | 0 | 134 | 0 |
| Quadrant | Total seconds | Saturated seconds | Saturation percentage |
|---|---|---|---|
| A | 6617 | 192 | 2.901617% |
| B | 6617 | 51 | 0.770742% |
| C | 6617 | 328 | 4.956929% |
| D | 6617 | 204 | 3.082968% |
Noise dominated data is calculated using 1-second bins in cleaned event files. If a bin has >2000 counts, and if more than 50% of those come from <1% of pixels, then it is considered to be noise-dominated and hence unusable.
| Quadrant | # 1 sec bins | Bins with >0 counts | Bins with >2000 counts | High rate bins dominated by noise | Noise dominated (total time) | Noise dominated (detector-on time) | Marked lightcurve |
|---|---|---|---|---|---|---|---|
| A | 7732 | 6618 | 91 | 91 | 1.18% | 1.38% | 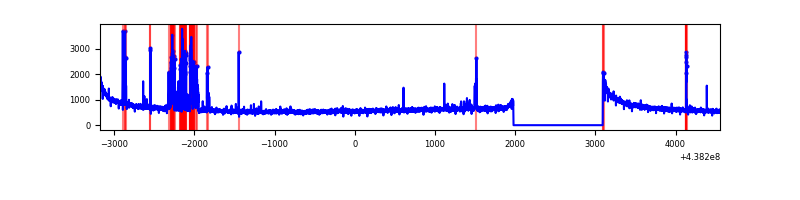 |
| B | 7732 | 6618 | 9 | 9 | 0.12% | 0.14% | 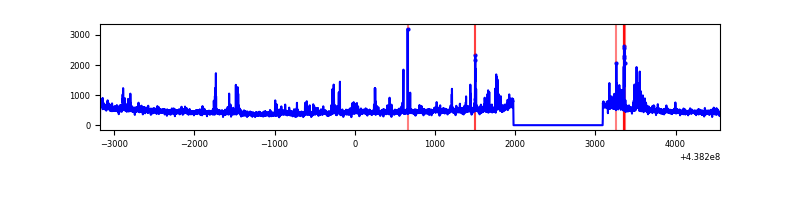 |
| C | 7732 | 6618 | 261 | 261 | 3.38% | 3.94% | 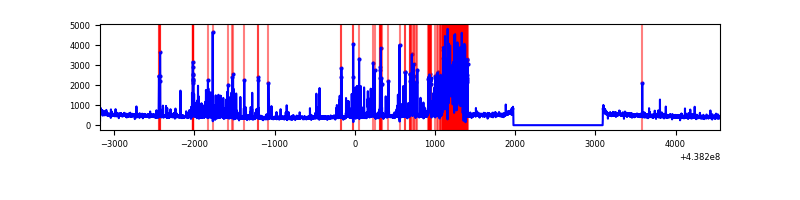 |
| D | 7732 | 6618 | 108 | 108 | 1.40% | 1.63% | 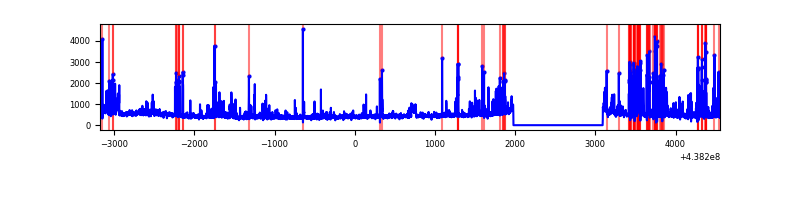 |
Top three noisy pixels from each quadrant. If the there are fewer than three noisy pixels in the level2.evt file, extra rows are filled as -1
| Pixel properties | Quadrant properties | ||||||
|---|---|---|---|---|---|---|---|
| Quadrant | DetID | PixID | Counts | Sigma | Mean | Median | Sigma |
| A | 10 | 83 | 1241436 | 7930.57 | 754 | 738 | 156.4 |
| A | 15 | 222 | 339107 | 2162.86 | 754 | 738 | 156.4 |
| A | 15 | 223 | 99171 | 629.19 | 754 | 738 | 156.4 |
| B | 0 | 200 | 189489 | 1267.2 | 758 | 735 | 149.0 |
| B | 0 | 213 | 65345 | 433.76 | 758 | 735 | 149.0 |
| B | 4 | 171 | 21051 | 136.39 | 758 | 735 | 149.0 |
| C | 1 | 241 | 737447 | 4366.25 | 717 | 721 | 168.7 |
| C | 14 | 254 | 483947 | 2863.87 | 717 | 721 | 168.7 |
| C | 3 | 233 | 41097 | 239.29 | 717 | 721 | 168.7 |
| D | 1 | 52 | 665964 | 3681.56 | 717 | 695 | 180.7 |
| D | 5 | 222 | 95626 | 525.34 | 717 | 695 | 180.7 |
| D | 2 | 249 | 79106 | 433.92 | 717 | 695 | 180.7 |
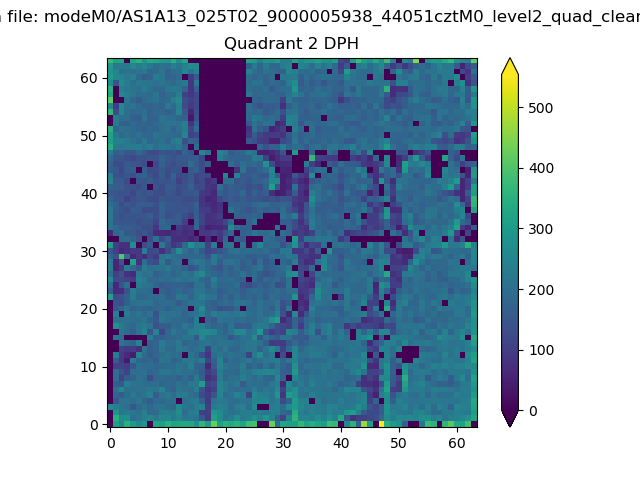
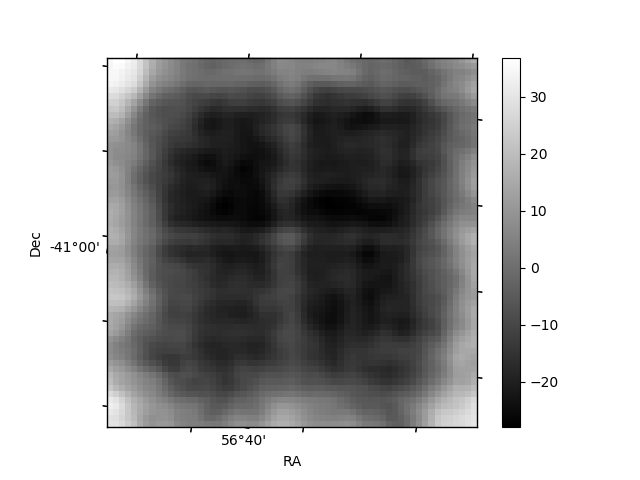
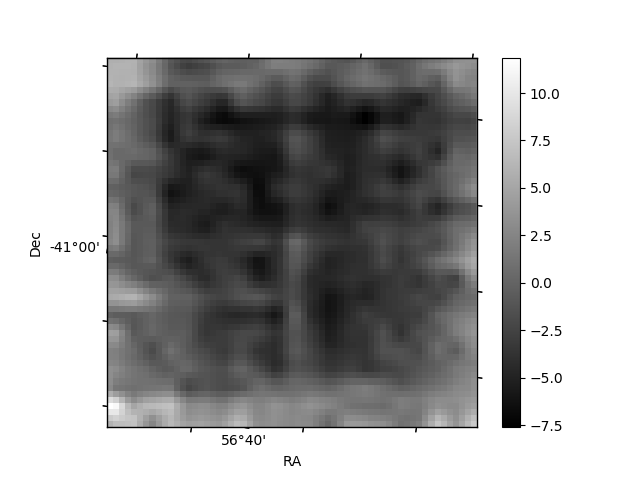
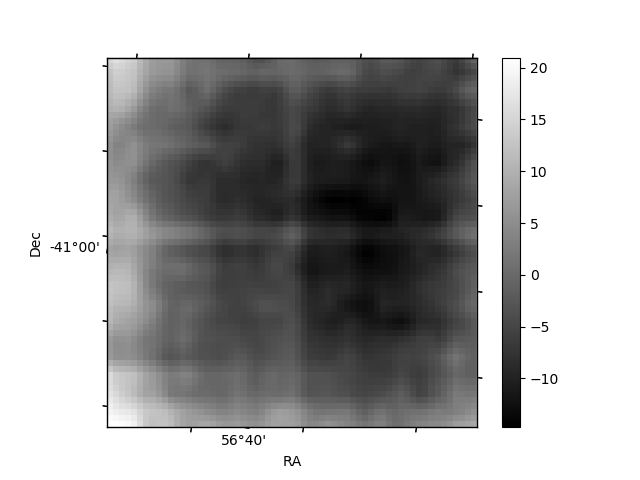
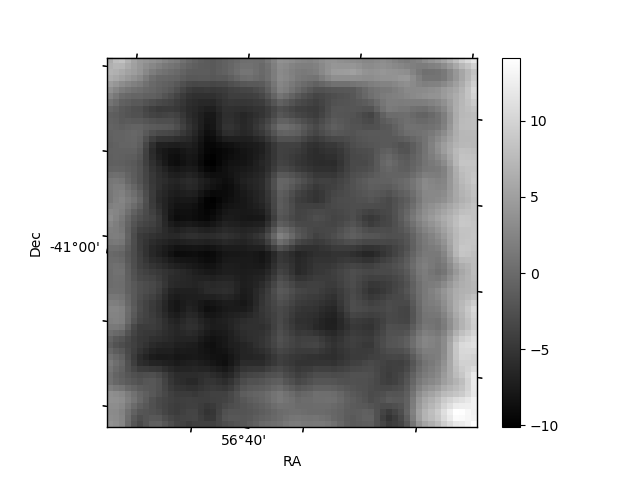
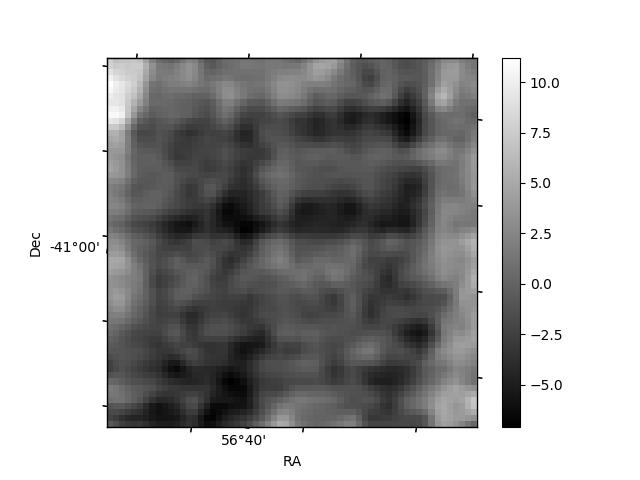
Histogram calculated using DETX and DETY for each event in the final _common_clean file
| Quadrant A | 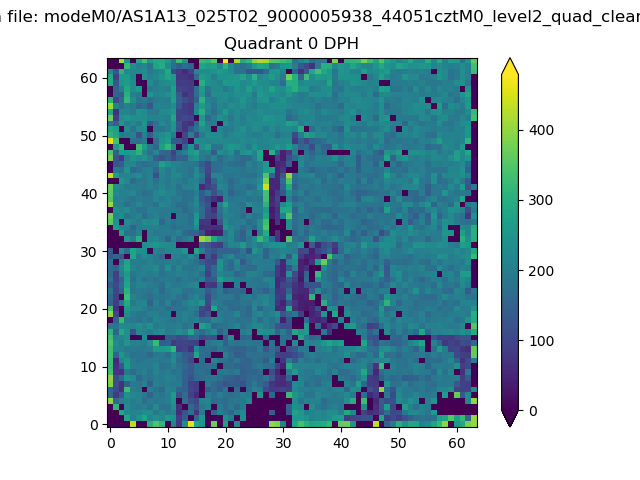 |
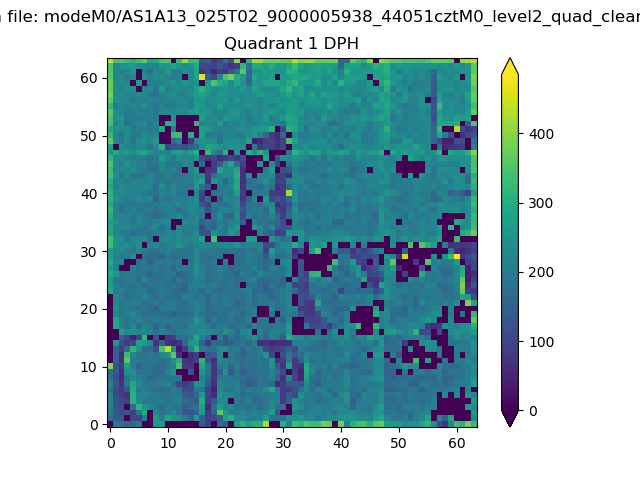 |
Quadrant B |
|---|---|---|---|
| Quadrant D | 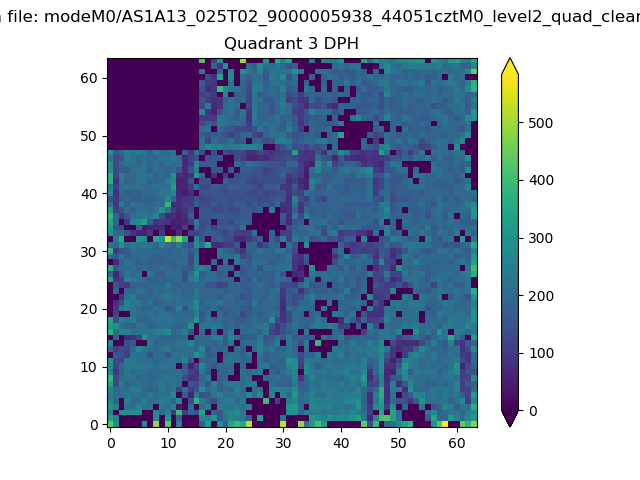 |
 |
Quadrant C |
| Plot type | Count rate plots | Images |
|---|---|---|
| Comparison with Poisson distribution Blue bars denote a histogram of data divided into 1 sec bins. Red curve is a Poisson curve with rate = median count rate of data. |
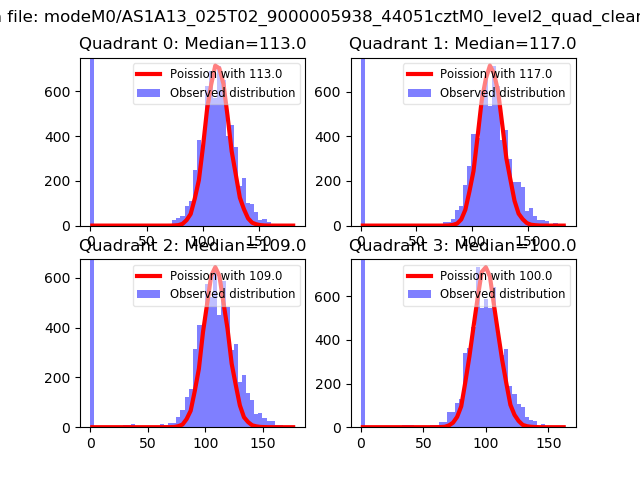 |
 |
| Quadrant-wise count rates Data is divided into 100 sec bins |
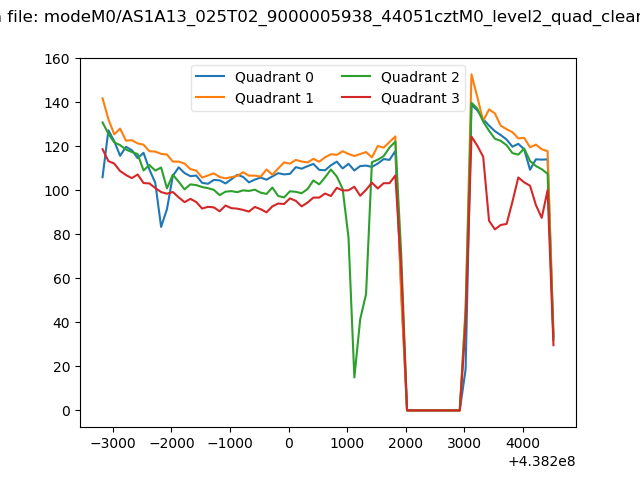 |
|
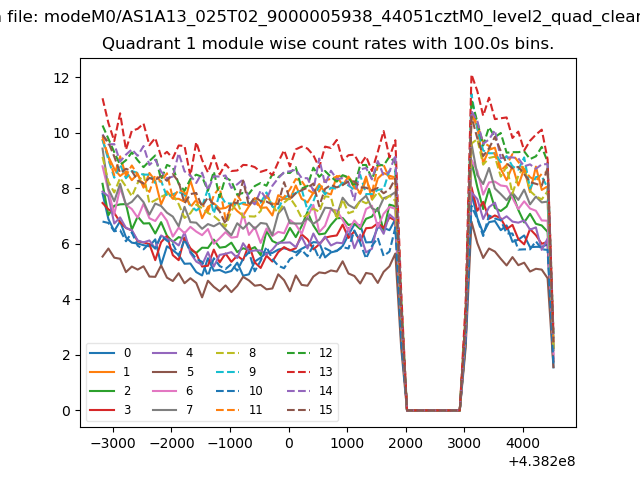
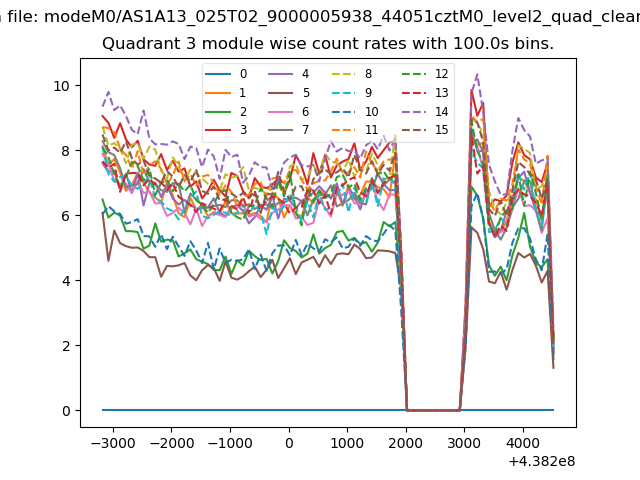
| Module-wise count rates for Quadrant A Data is divided into 100 sec bins |
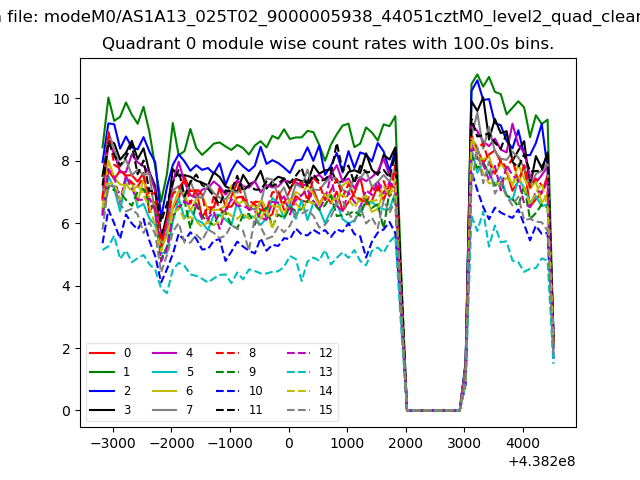 |
 |
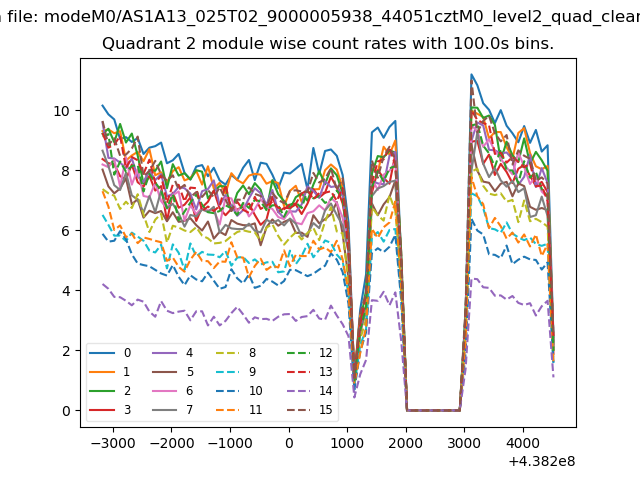
| Module-wise count rates for Quadrant B Data is divided into 100 sec bins |
 |
 |
| Module-wise count rates for Quadrant C Data is divided into 100 sec bins |
 |
 |
| Module-wise count rates for Quadrant D Data is divided into 100 sec bins |
 |
 |
| Parameter | Plot |
|---|---|
| CZT HV Monitor | 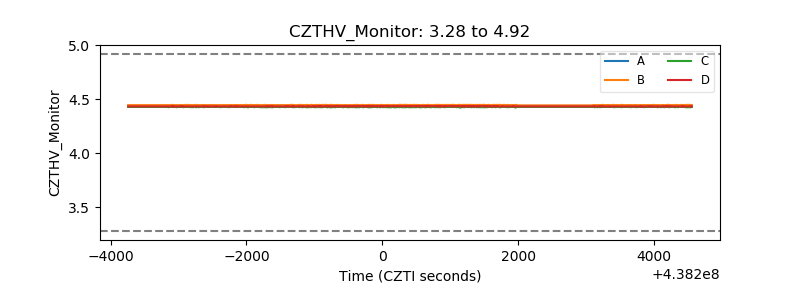 |
| D_VDD | 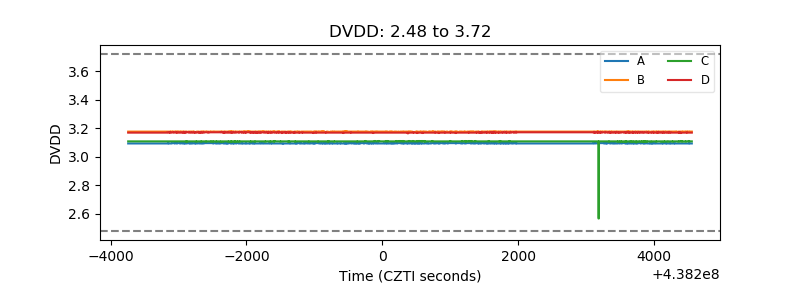 |
| Temperature 1 | 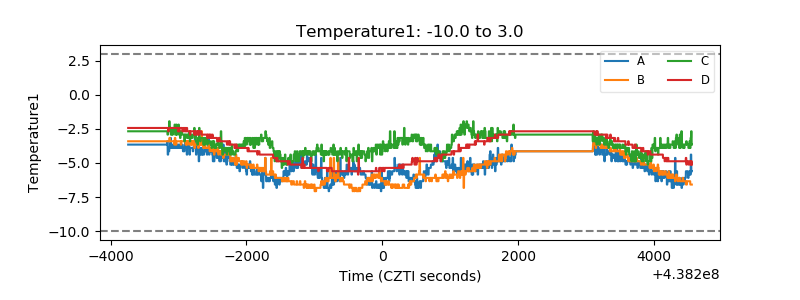 |
| Veto HV Monitor | 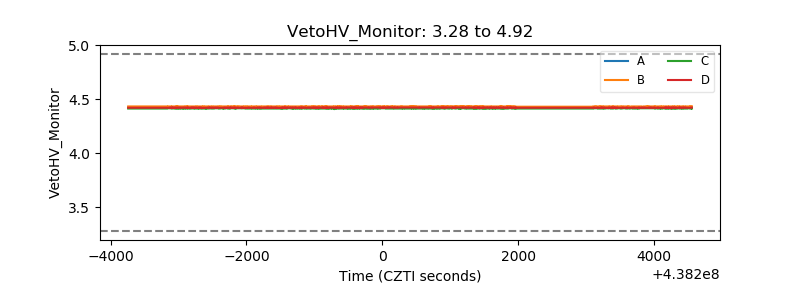 |
| Veto LLD | 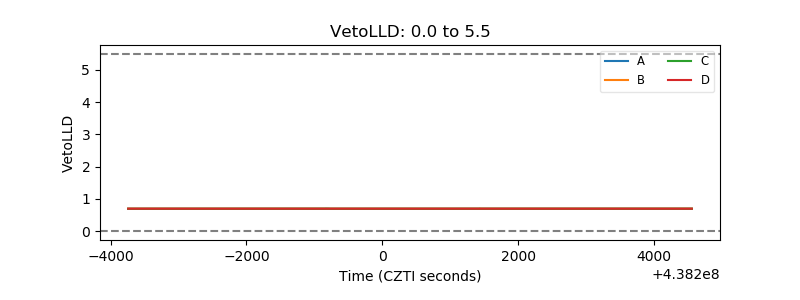 |
| Alpha Counter | 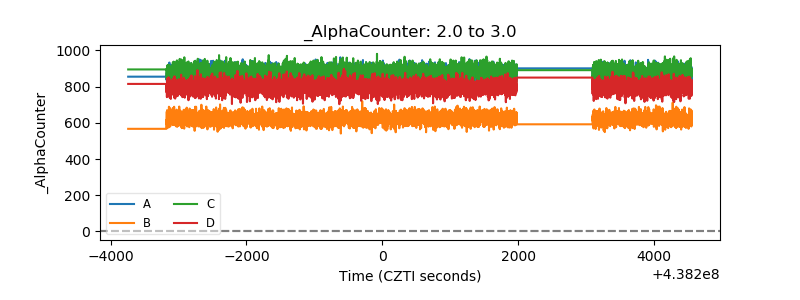 |
| _CPM_Rate | 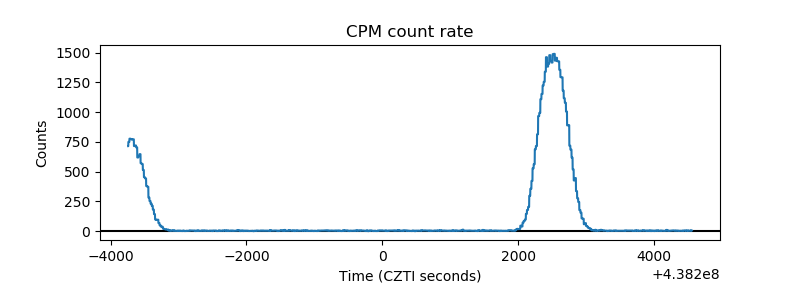 |
| CZT Counter | 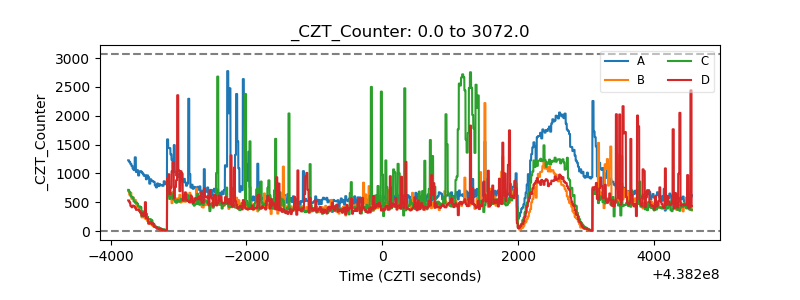 |
| +2.5 Volts monitor | 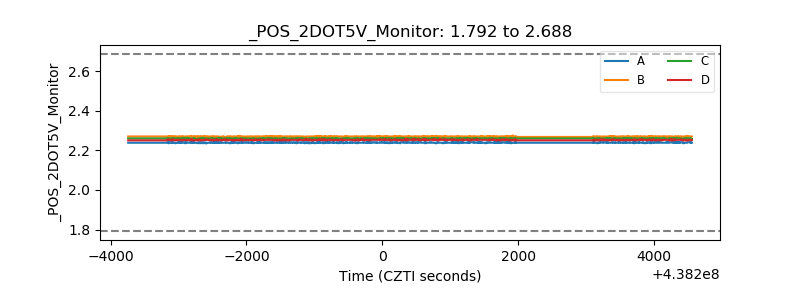 |
| +5 Volts monitor | 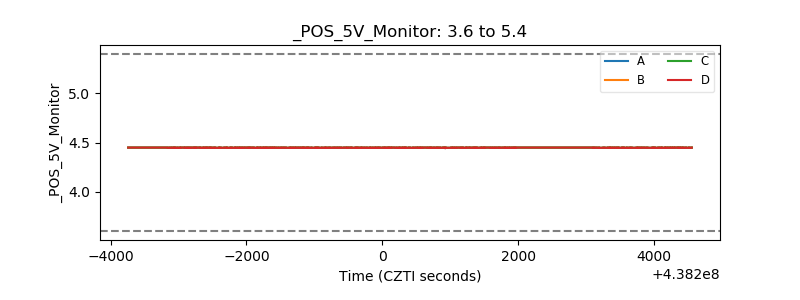 |
| _ROLL_ROT | 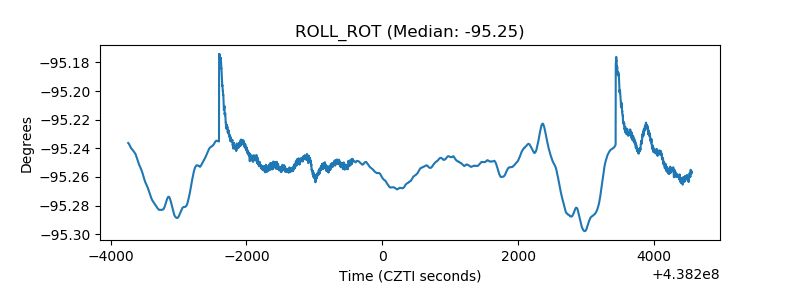 |
| _Roll_DEC | 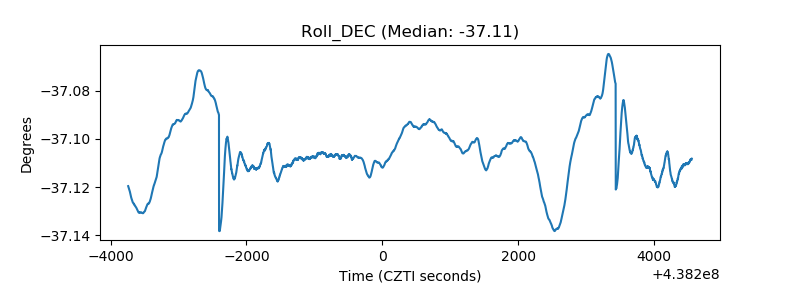 |
| _Roll_RA | 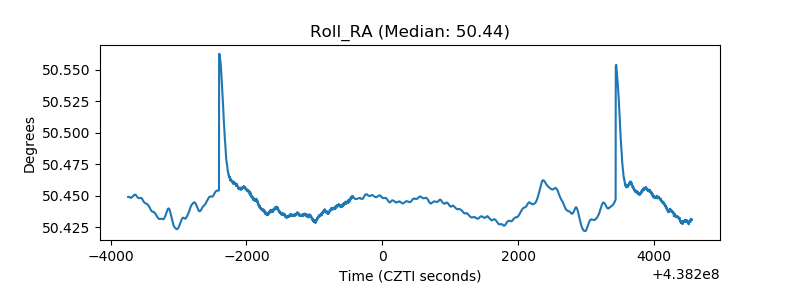 |
| Veto Counter | 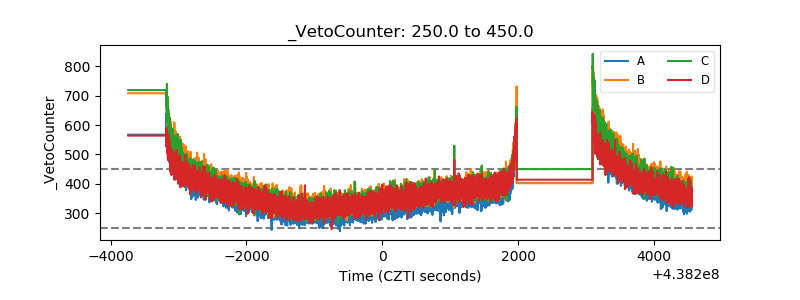 |