| Param | Original file | Final file |
|---|---|---|
| Filename | modeM0/AS1A13_025T02_9000005938_44052cztM0_level2.fits | modeM0/AS1A13_025T02_9000005938_44052cztM0_level2_quad_clean.evt |
| Size (bytes) | 402,148,800 | 112,184,640 |
| Size | 383.5 MB | 107.0 MB |
| Events in quadrant A | 4,176,287 | 754,443 |
| Events in quadrant B | 3,145,270 | 794,696 |
| Events in quadrant C | 3,342,897 | 742,120 |
| Events in quadrant D | 3,721,112 | 656,780 |
| Mode M0 | |||
|---|---|---|---|
| Quadrant | BADHDUFLAG | Total packets | Discarded packets |
| A | 0 | 16707 | 2 |
| B | 0 | 13759 | 2 |
| C | 0 | 14298 | 2 |
| D | 0 | 15635 | 3 |
| Mode M9 | |||
|---|---|---|---|
| Quadrant | BADHDUFLAG | Total packets | Discarded packets |
| A | 0 | 12 | 0 |
| B | 0 | 13 | 0 |
| C | 0 | 13 | 0 |
| D | 0 | 13 | 0 |
| Mode SS | |||
|---|---|---|---|
| Quadrant | BADHDUFLAG | Total packets | Discarded packets |
| A | 0 | 130 | 0 |
| B | 0 | 130 | 0 |
| C | 0 | 130 | 0 |
| D | 0 | 130 | 0 |
| Quadrant | Total seconds | Saturated seconds | Saturation percentage |
|---|---|---|---|
| A | 6439 | 115 | 1.785992% |
| B | 6439 | 49 | 0.760988% |
| C | 6439 | 30 | 0.465911% |
| D | 6438 | 215 | 3.339546% |
Noise dominated data is calculated using 1-second bins in cleaned event files. If a bin has >2000 counts, and if more than 50% of those come from <1% of pixels, then it is considered to be noise-dominated and hence unusable.
| Quadrant | # 1 sec bins | Bins with >0 counts | Bins with >2000 counts | High rate bins dominated by noise | Noise dominated (total time) | Noise dominated (detector-on time) | Marked lightcurve |
|---|---|---|---|---|---|---|---|
| A | 7625 | 6441 | 11 | 11 | 0.14% | 0.17% | 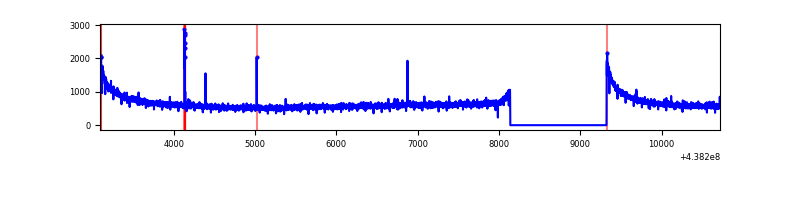 |
| B | 7625 | 6441 | 7 | 7 | 0.09% | 0.11% | 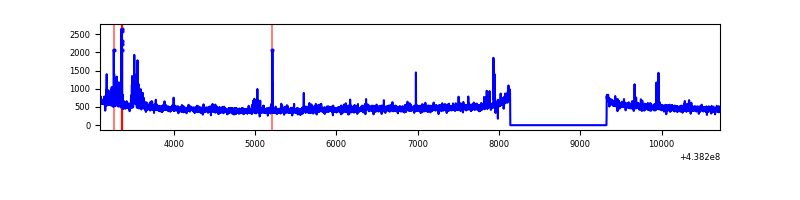 |
| C | 7625 | 6441 | 21 | 21 | 0.28% | 0.33% | 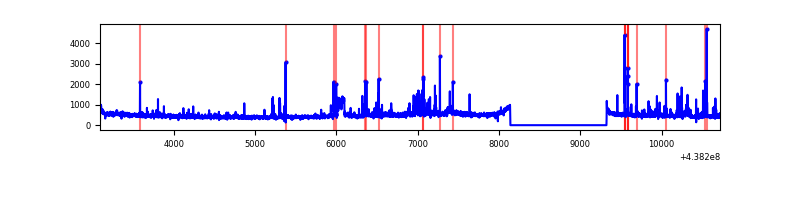 |
| D | 7624 | 6440 | 108 | 108 | 1.42% | 1.68% | 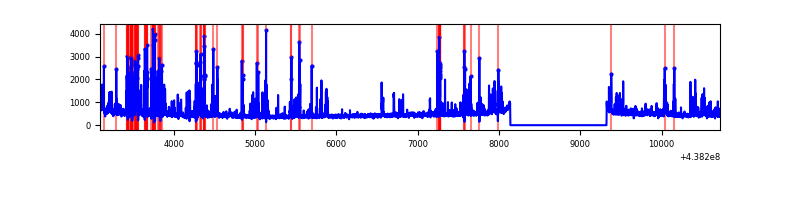 |
Top three noisy pixels from each quadrant. If the there are fewer than three noisy pixels in the level2.evt file, extra rows are filled as -1
| Pixel properties | Quadrant properties | ||||||
|---|---|---|---|---|---|---|---|
| Quadrant | DetID | PixID | Counts | Sigma | Mean | Median | Sigma |
| A | 10 | 83 | 1236700 | 8064.0 | 748 | 734 | 153.3 |
| A | 15 | 223 | 30009 | 191.0 | 748 | 734 | 153.3 |
| A | 13 | 6 | 11269 | 68.74 | 748 | 734 | 153.3 |
| B | 0 | 200 | 104851 | 706.15 | 755 | 733 | 147.4 |
| B | 0 | 213 | 60342 | 404.28 | 755 | 733 | 147.4 |
| B | 12 | 111 | 19056 | 124.27 | 755 | 733 | 147.4 |
| C | 14 | 254 | 190283 | 1097.61 | 731 | 735 | 172.7 |
| C | 3 | 233 | 186644 | 1076.53 | 731 | 735 | 172.7 |
| C | 1 | 241 | 61103 | 349.57 | 731 | 735 | 172.7 |
| D | 1 | 52 | 526225 | 2991.81 | 707 | 686 | 175.7 |
| D | 2 | 249 | 139179 | 788.42 | 707 | 686 | 175.7 |
| D | 5 | 222 | 97415 | 550.66 | 707 | 686 | 175.7 |
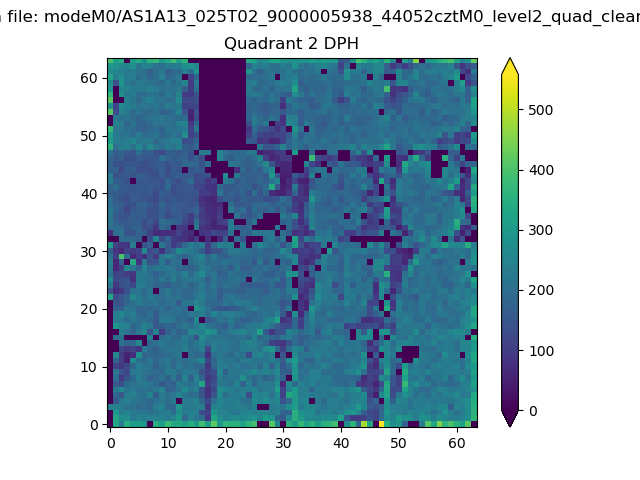
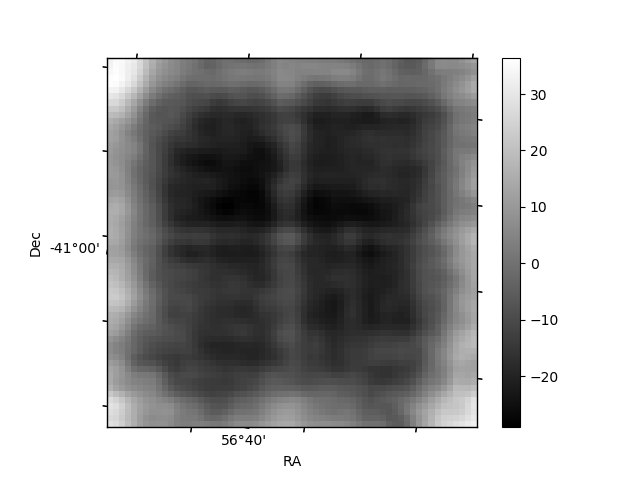
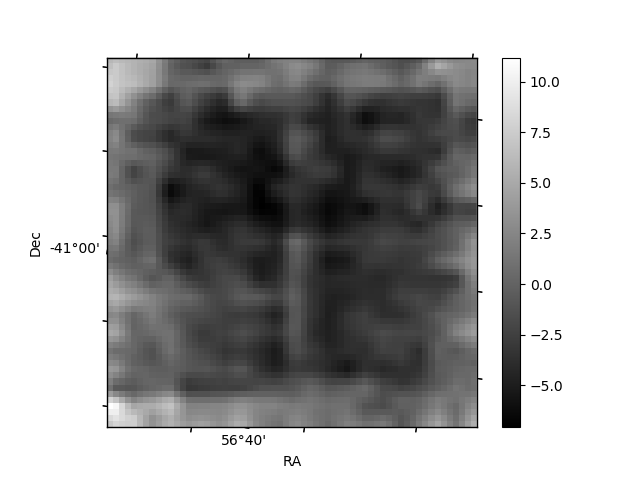
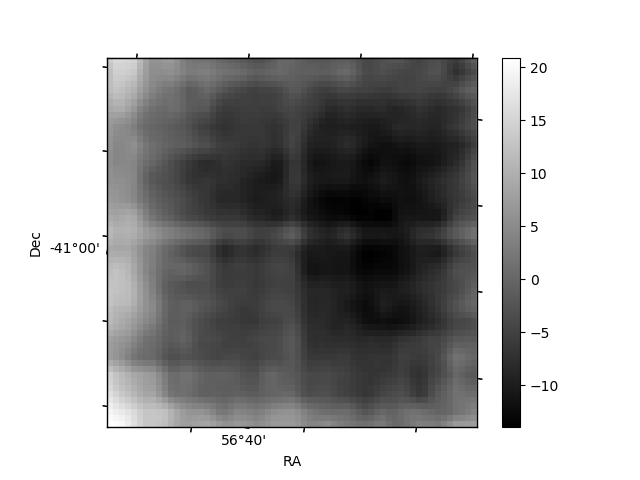
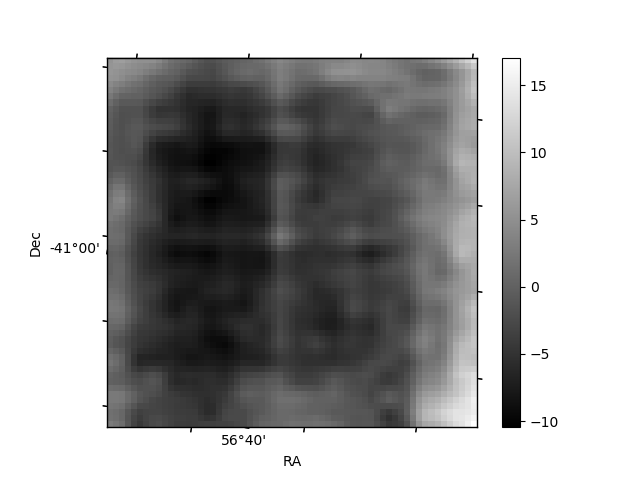
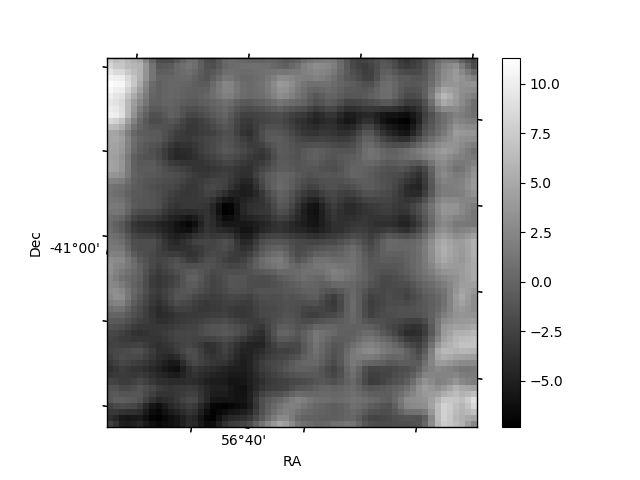
Histogram calculated using DETX and DETY for each event in the final _common_clean file
| Quadrant A | 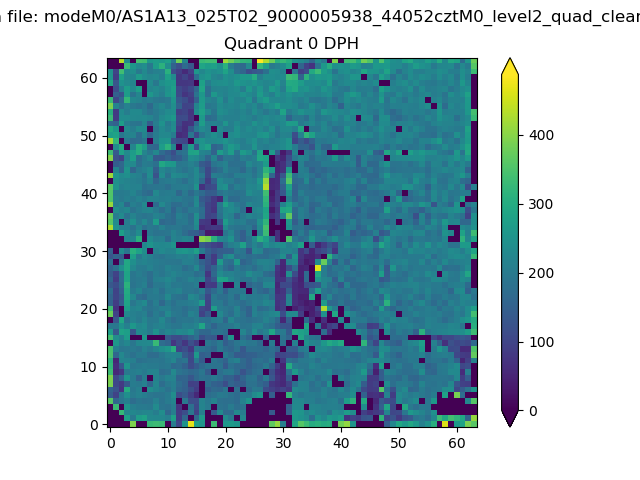 |
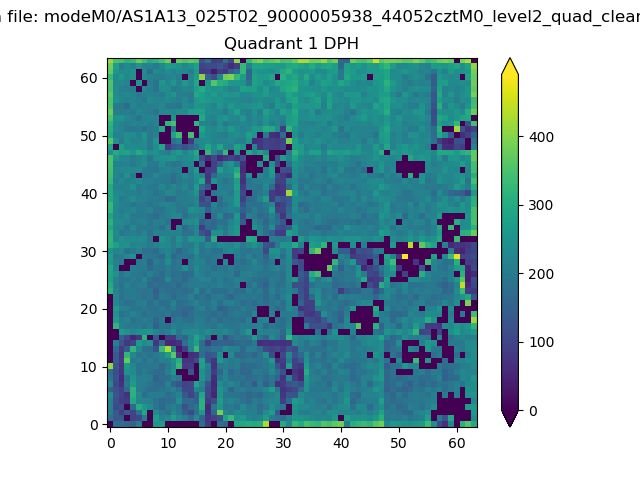 |
Quadrant B |
|---|---|---|---|
| Quadrant D | 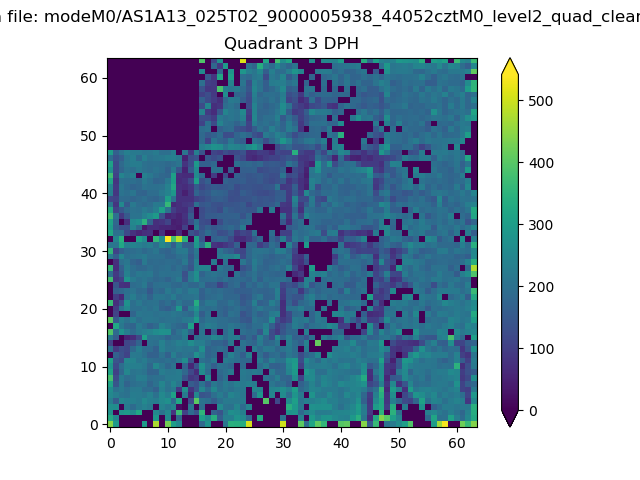 |
 |
Quadrant C |
| Plot type | Count rate plots | Images |
|---|---|---|
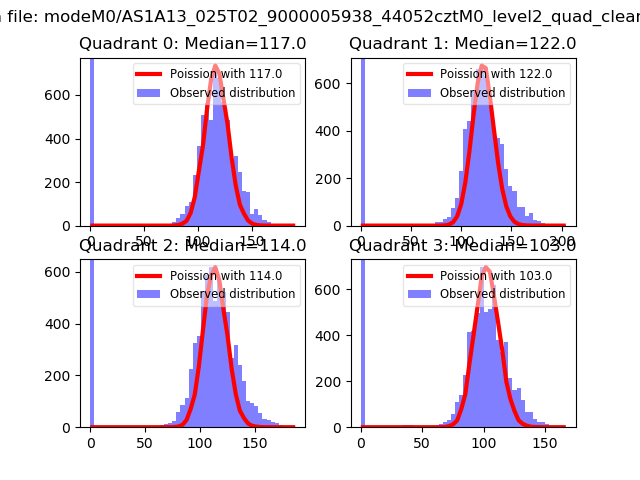
| Comparison with Poisson distribution Blue bars denote a histogram of data divided into 1 sec bins. Red curve is a Poisson curve with rate = median count rate of data. |
 |
 |
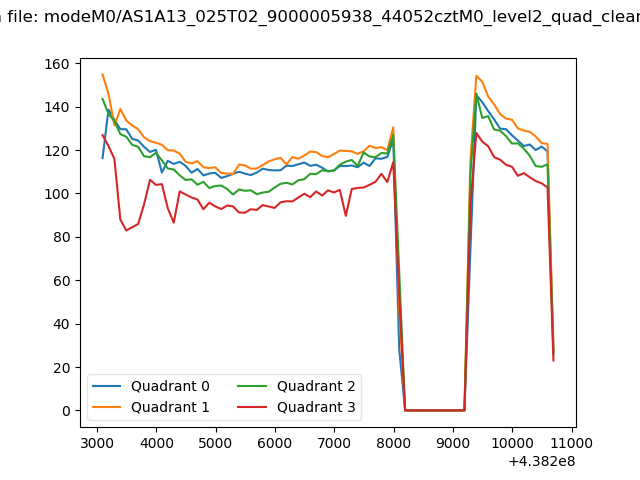
| Quadrant-wise count rates Data is divided into 100 sec bins |
 |
|
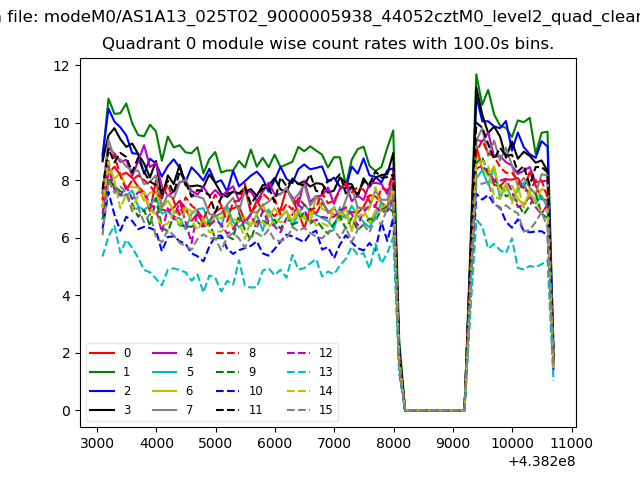
| Module-wise count rates for Quadrant A Data is divided into 100 sec bins |
 |
 |
| Module-wise count rates for Quadrant B Data is divided into 100 sec bins |
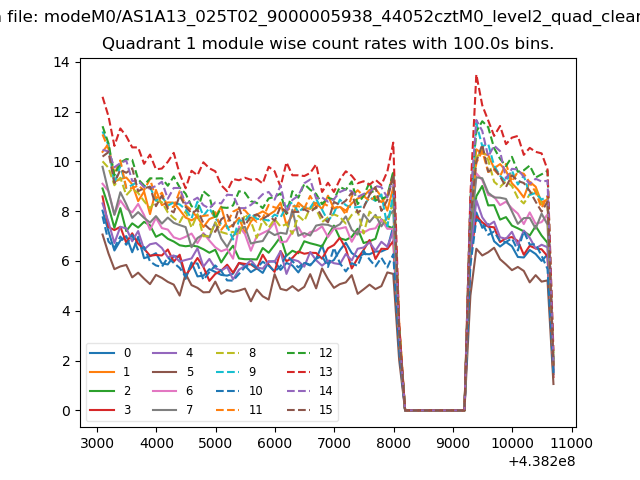 |
 |
| Module-wise count rates for Quadrant C Data is divided into 100 sec bins |
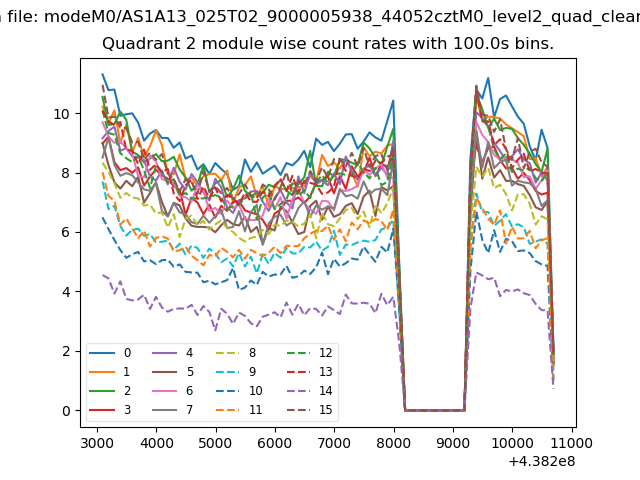 |
 |
| Module-wise count rates for Quadrant D Data is divided into 100 sec bins |
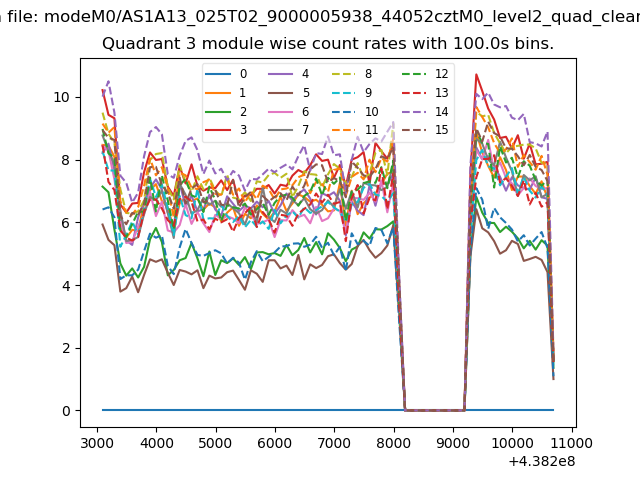 |
 |
| Parameter | Plot |
|---|---|
| CZT HV Monitor |  |
| D_VDD | 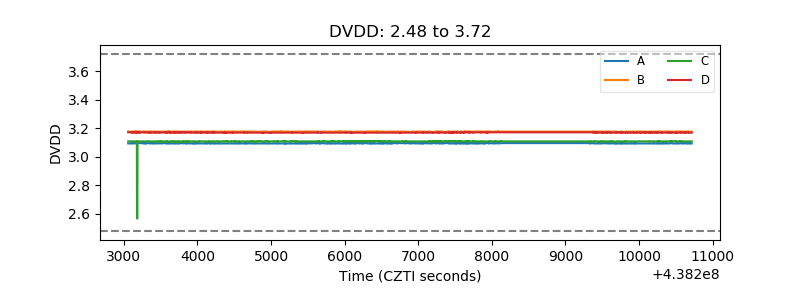 |
| Temperature 1 | 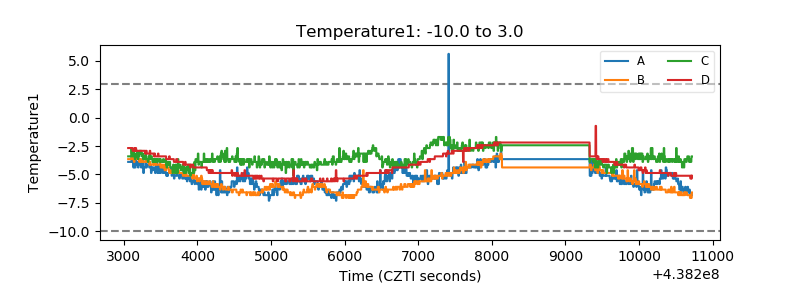 |
| Veto HV Monitor | 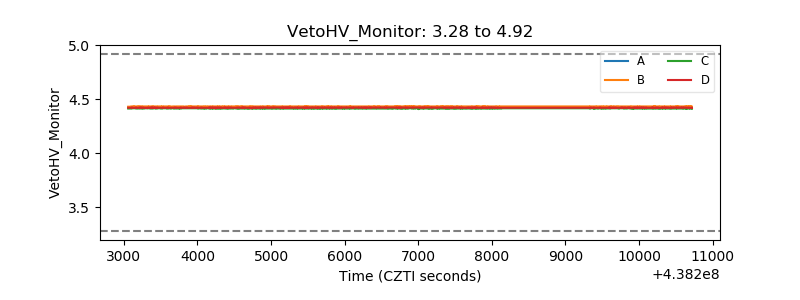 |
| Veto LLD | 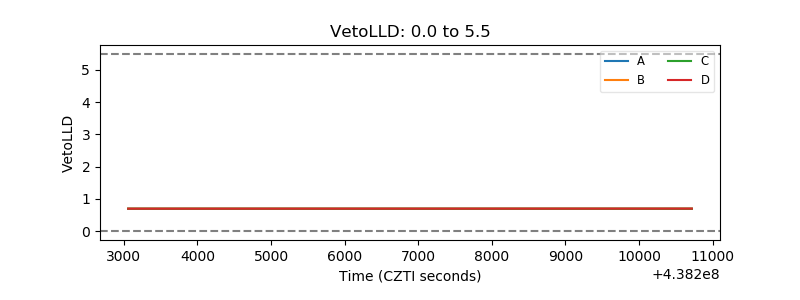 |
| Alpha Counter | 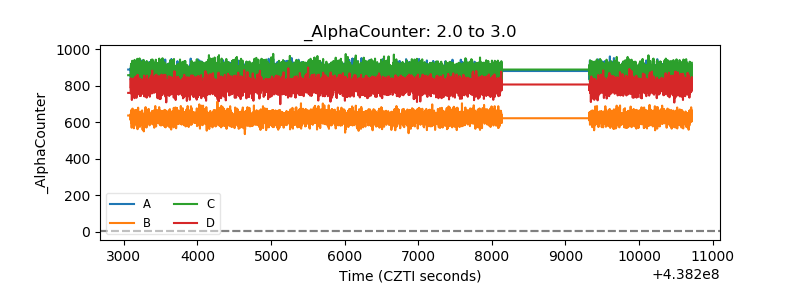 |
| _CPM_Rate | 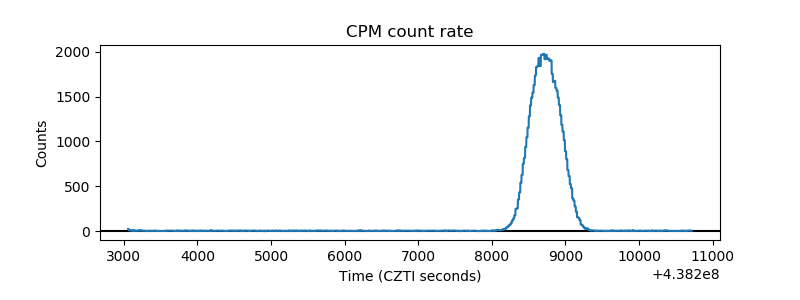 |
| CZT Counter | 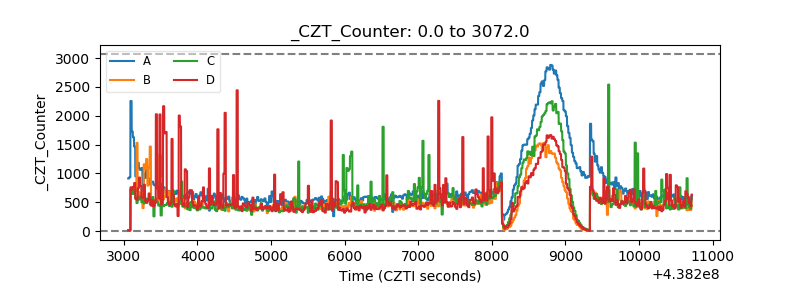 |
| +2.5 Volts monitor |  |
| +5 Volts monitor | 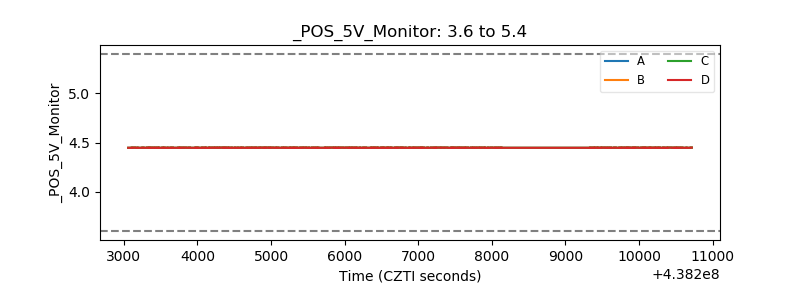 |
| _ROLL_ROT | 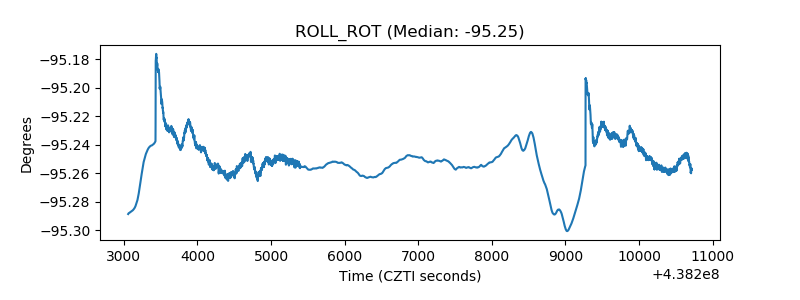 |
| _Roll_DEC | 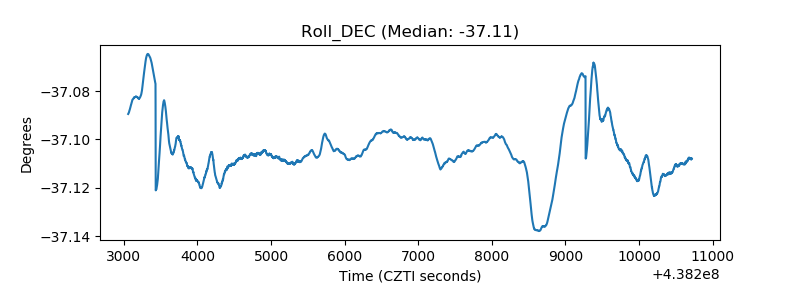 |
| _Roll_RA | 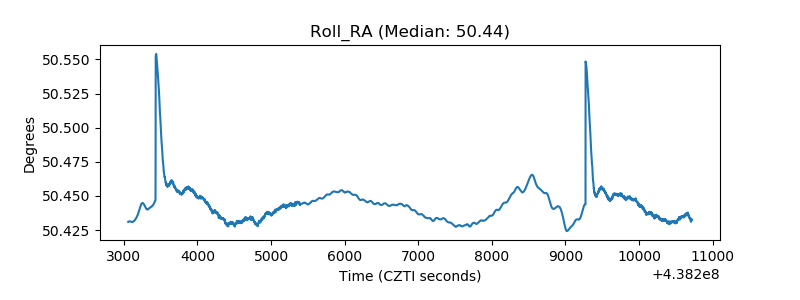 |
| Veto Counter | 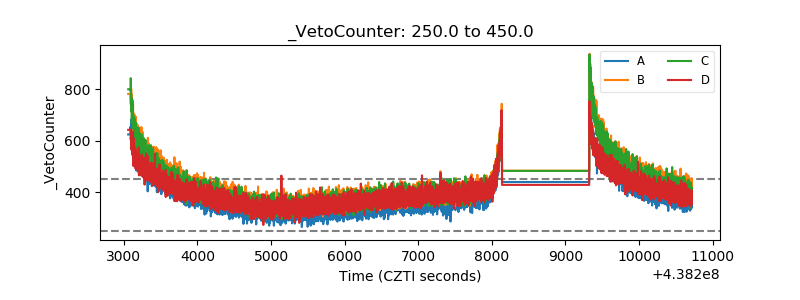 |