| Param | Original file | Final file |
|---|---|---|
| Filename | modeM0/AS1A13_025T02_9000005938_44053cztM0_level2.fits | modeM0/AS1A13_025T02_9000005938_44053cztM0_level2_quad_clean.evt |
| Size (bytes) | 414,561,600 | 116,268,480 |
| Size | 395.4 MB | 110.9 MB |
| Events in quadrant A | 4,224,139 | 781,513 |
| Events in quadrant B | 3,305,010 | 825,947 |
| Events in quadrant C | 3,397,914 | 768,714 |
| Events in quadrant D | 3,912,910 | 690,466 |
| Mode M0 | |||
|---|---|---|---|
| Quadrant | BADHDUFLAG | Total packets | Discarded packets |
| A | 0 | 16929 | 2 |
| B | 0 | 14089 | 2 |
| C | 0 | 14442 | 2 |
| D | 0 | 16222 | 2 |
| Mode M9 | |||
|---|---|---|---|
| Quadrant | BADHDUFLAG | Total packets | Discarded packets |
| A | 0 | 17 | 0 |
| B | 0 | 18 | 0 |
| C | 0 | 18 | 0 |
| D | 0 | 18 | 0 |
| Mode SS | |||
|---|---|---|---|
| Quadrant | BADHDUFLAG | Total packets | Discarded packets |
| A | 0 | 134 | 0 |
| B | 0 | 134 | 0 |
| C | 0 | 134 | 0 |
| D | 0 | 134 | 0 |
| Quadrant | Total seconds | Saturated seconds | Saturation percentage |
|---|---|---|---|
| A | 6507 | 82 | 1.260181% |
| B | 6507 | 54 | 0.829876% |
| C | 6507 | 57 | 0.875980% |
| D | 6507 | 120 | 1.844168% |
Noise dominated data is calculated using 1-second bins in cleaned event files. If a bin has >2000 counts, and if more than 50% of those come from <1% of pixels, then it is considered to be noise-dominated and hence unusable.
| Quadrant | # 1 sec bins | Bins with >0 counts | Bins with >2000 counts | High rate bins dominated by noise | Noise dominated (total time) | Noise dominated (detector-on time) | Marked lightcurve |
|---|---|---|---|---|---|---|---|
| A | 7767 | 6508 | 6 | 6 | 0.08% | 0.09% | 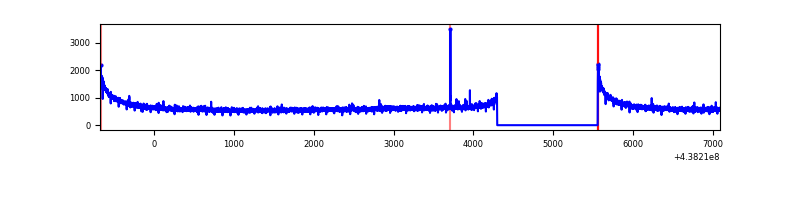 |
| B | 7767 | 6508 | 20 | 20 | 0.26% | 0.31% | 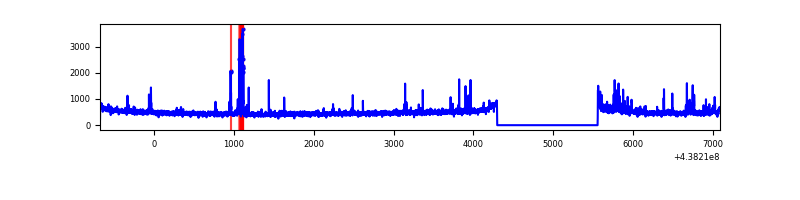 |
| C | 7767 | 6508 | 41 | 41 | 0.53% | 0.63% | 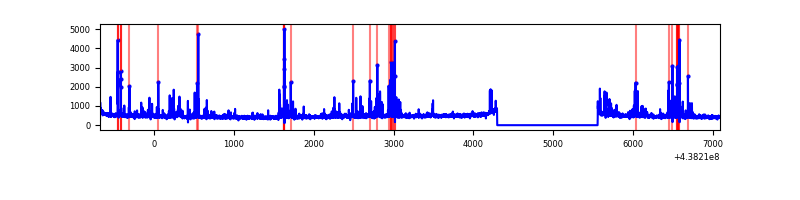 |
| D | 7767 | 6508 | 66 | 66 | 0.85% | 1.01% | 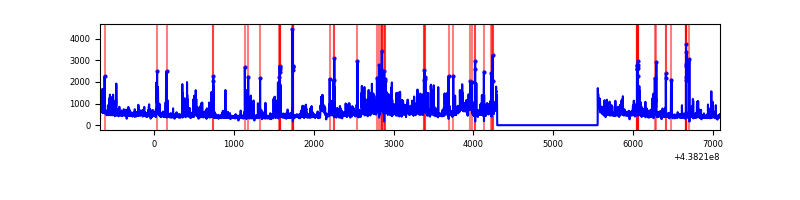 |
Top three noisy pixels from each quadrant. If the there are fewer than three noisy pixels in the level2.evt file, extra rows are filled as -1
| Pixel properties | Quadrant properties | ||||||
|---|---|---|---|---|---|---|---|
| Quadrant | DetID | PixID | Counts | Sigma | Mean | Median | Sigma |
| A | 10 | 83 | 1264214 | 8055.99 | 760 | 746 | 156.8 |
| A | 7 | 3 | 8995 | 52.6 | 760 | 746 | 156.8 |
| A | 3 | 137 | 8379 | 48.67 | 760 | 746 | 156.8 |
| B | 0 | 213 | 196818 | 1320.1 | 770 | 749 | 148.5 |
| B | 0 | 200 | 70276 | 468.12 | 770 | 749 | 148.5 |
| B | 12 | 111 | 18998 | 122.87 | 770 | 749 | 148.5 |
| C | 14 | 254 | 367247 | 2086.1 | 750 | 756 | 175.7 |
| C | 12 | 249 | 80556 | 454.23 | 750 | 756 | 175.7 |
| C | 3 | 233 | 16289 | 88.42 | 750 | 756 | 175.7 |
| D | 5 | 222 | 462630 | 2551.81 | 732 | 713 | 181.0 |
| D | 1 | 52 | 296489 | 1633.98 | 732 | 713 | 181.0 |
| D | 2 | 249 | 139427 | 766.31 | 732 | 713 | 181.0 |
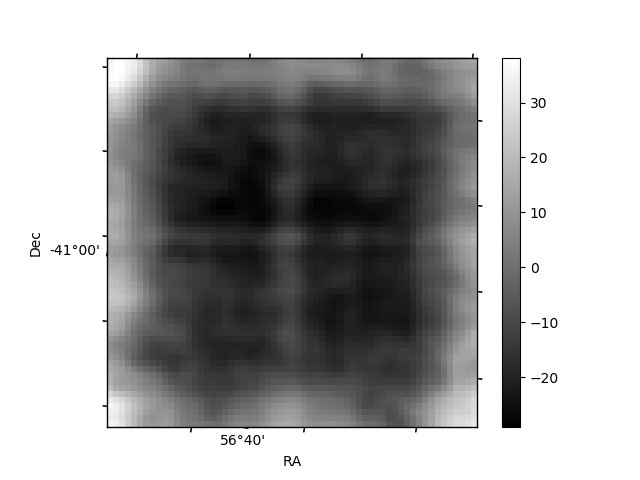
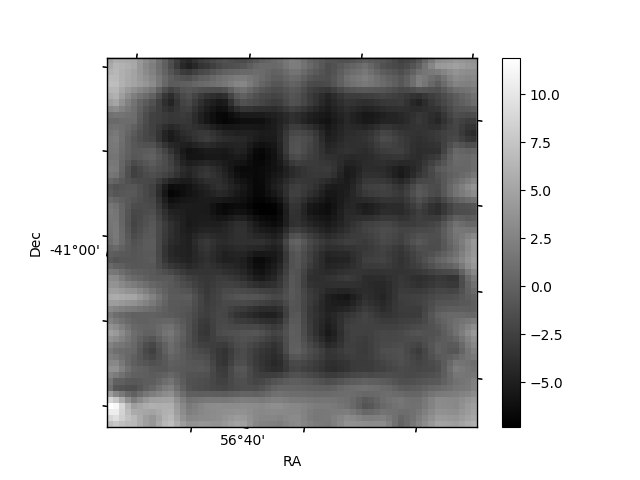
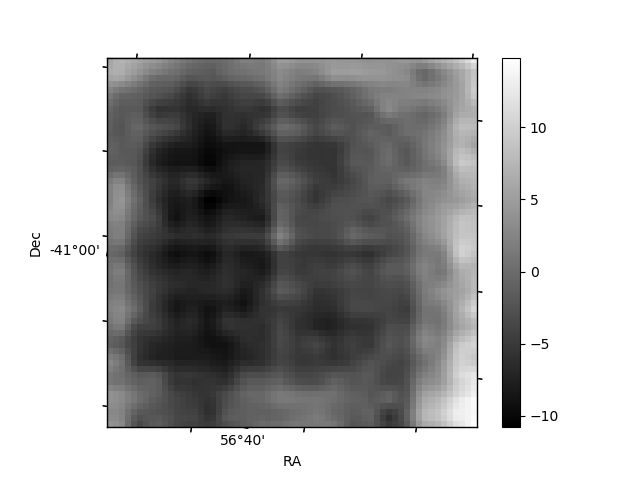
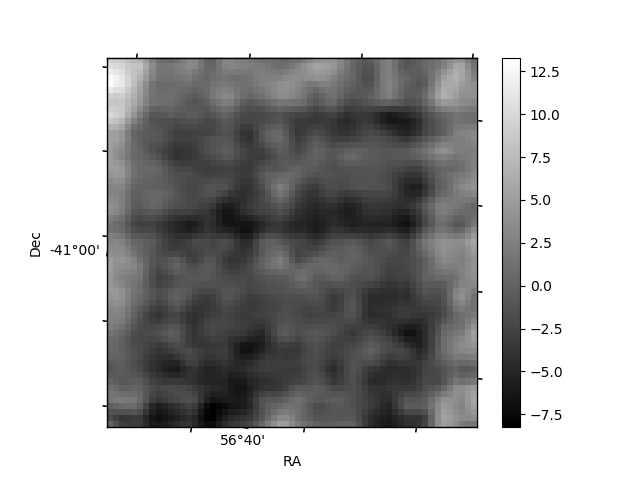
Histogram calculated using DETX and DETY for each event in the final _common_clean file
| Quadrant A | 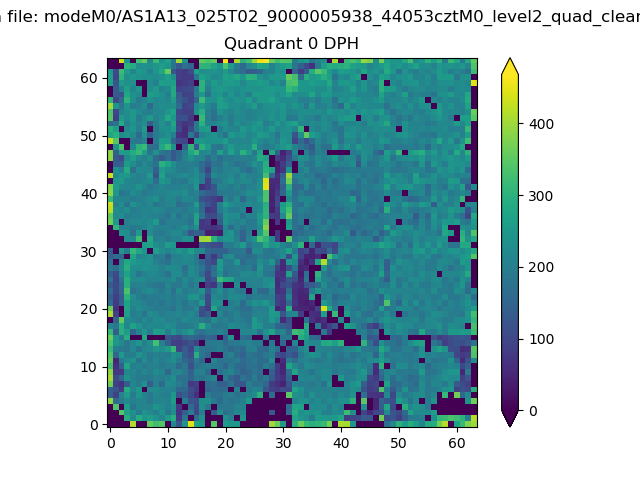 |
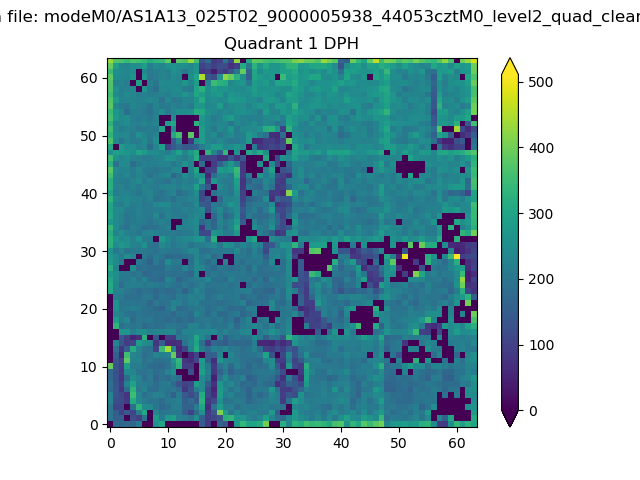 |
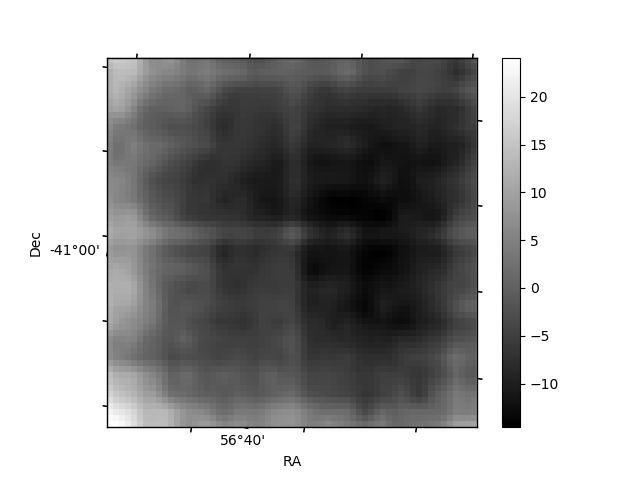
Quadrant B |
|---|---|---|---|
| Quadrant D | 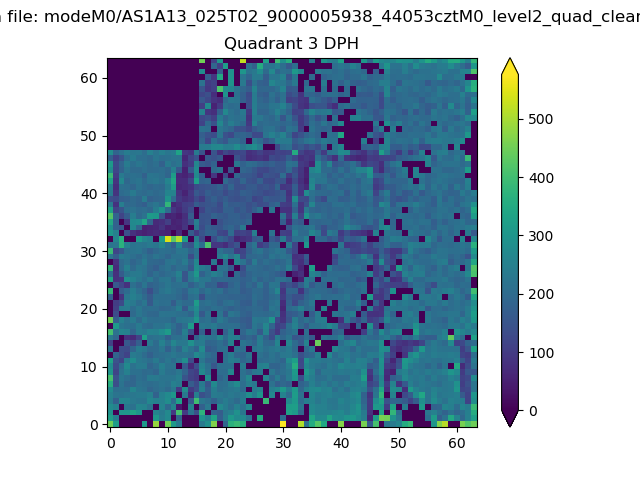 |
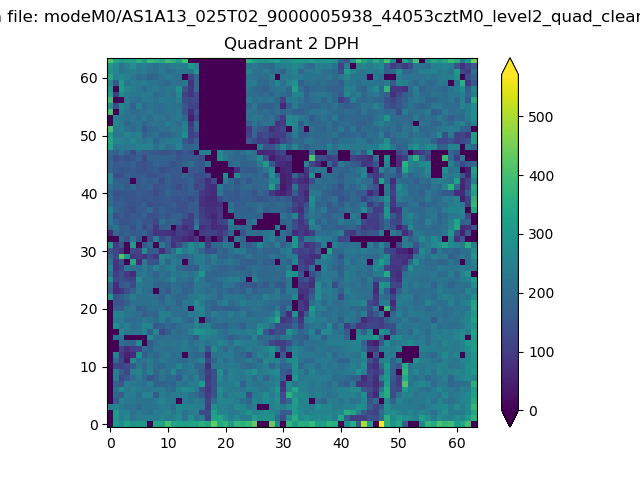 |
Quadrant C |
| Plot type | Count rate plots | Images |
|---|---|---|
| Comparison with Poisson distribution Blue bars denote a histogram of data divided into 1 sec bins. Red curve is a Poisson curve with rate = median count rate of data. |
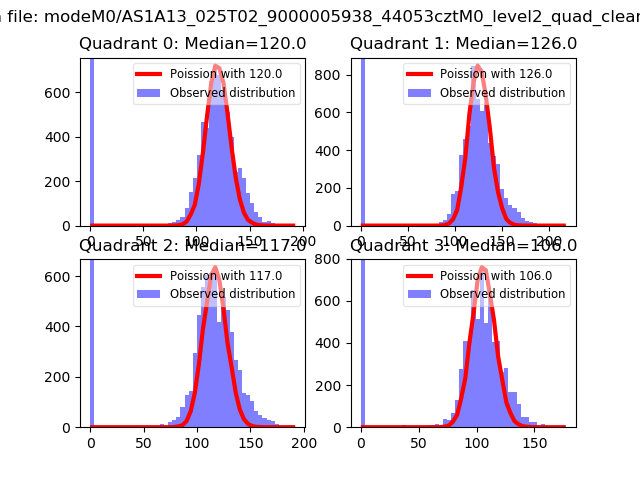 |
 |
| Quadrant-wise count rates Data is divided into 100 sec bins |
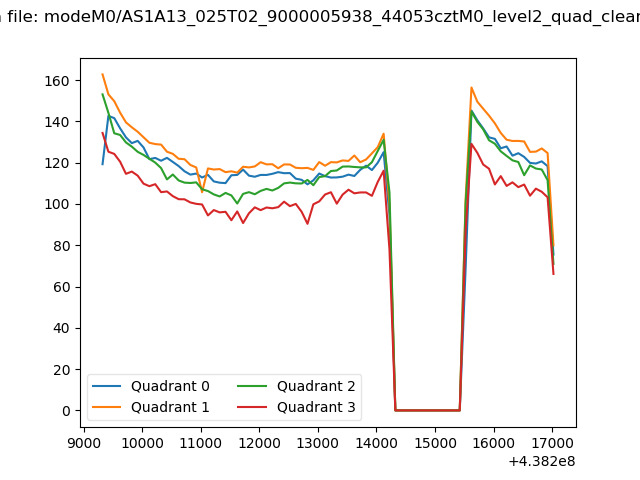 |
|
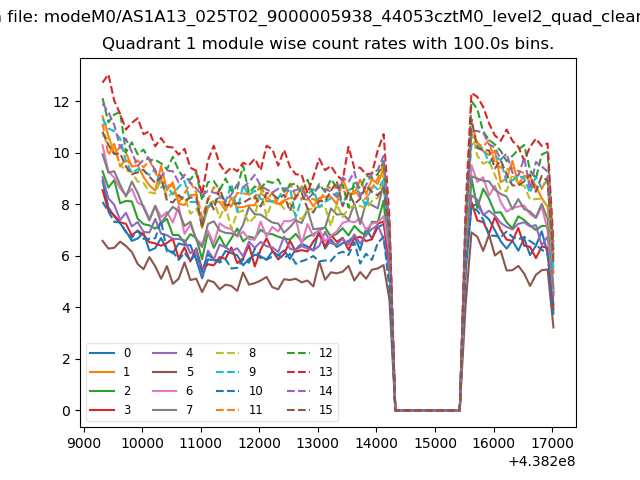
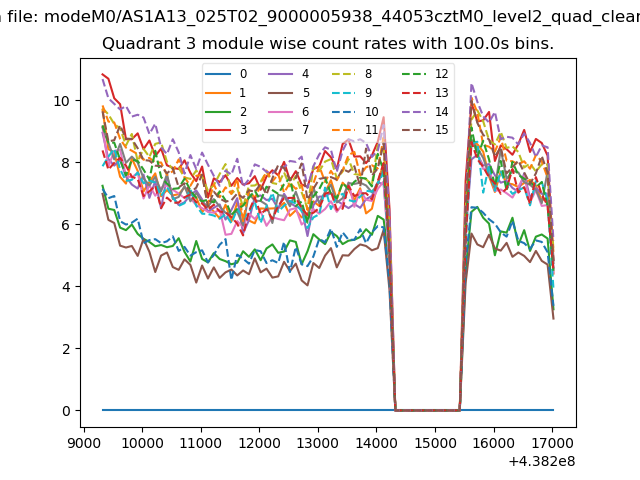
| Module-wise count rates for Quadrant A Data is divided into 100 sec bins |
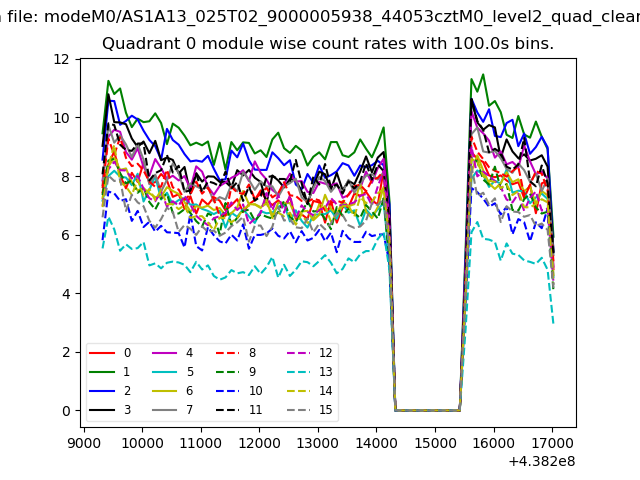 |
 |
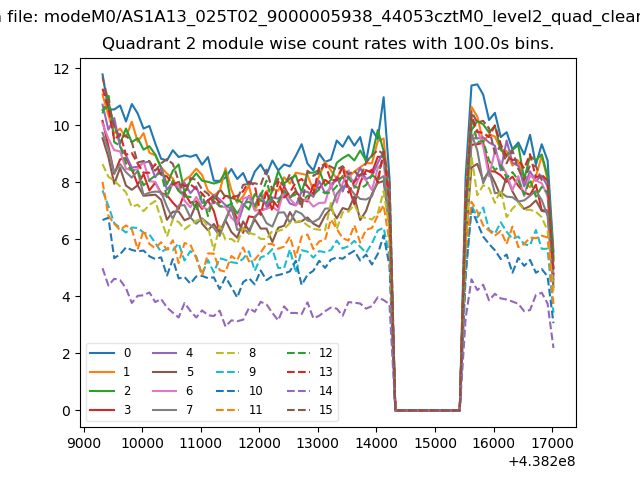
| Module-wise count rates for Quadrant B Data is divided into 100 sec bins |
 |
 |
| Module-wise count rates for Quadrant C Data is divided into 100 sec bins |
 |
 |
| Module-wise count rates for Quadrant D Data is divided into 100 sec bins |
 |
 |
| Parameter | Plot |
|---|---|
| CZT HV Monitor |  |
| D_VDD | 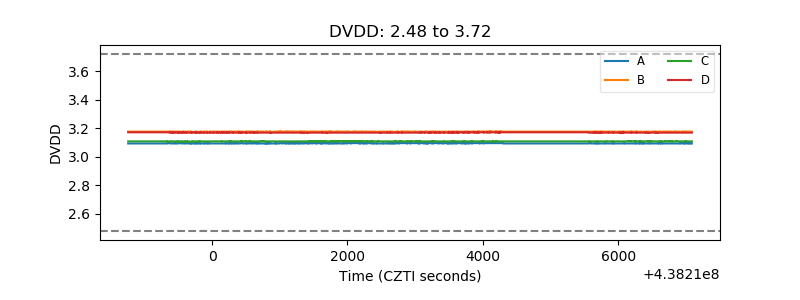 |
| Temperature 1 | 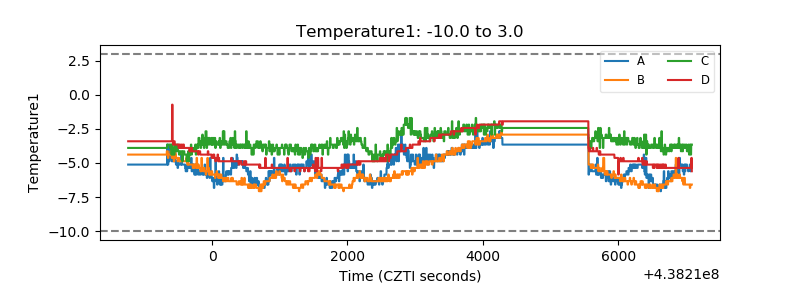 |
| Veto HV Monitor | 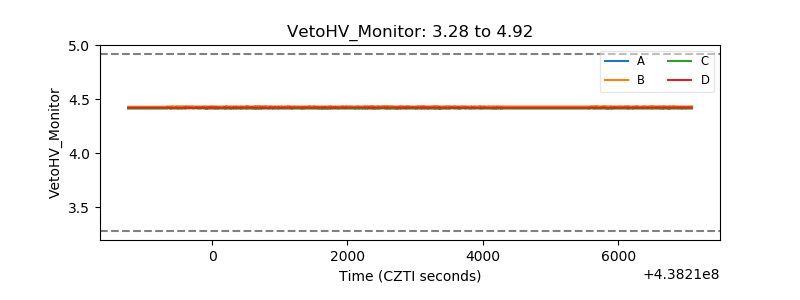 |
| Veto LLD | 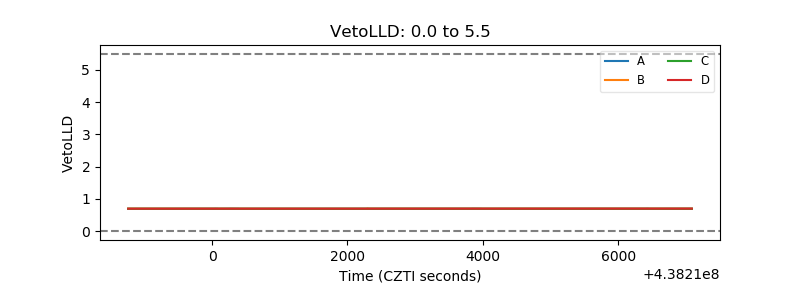 |
| Alpha Counter | 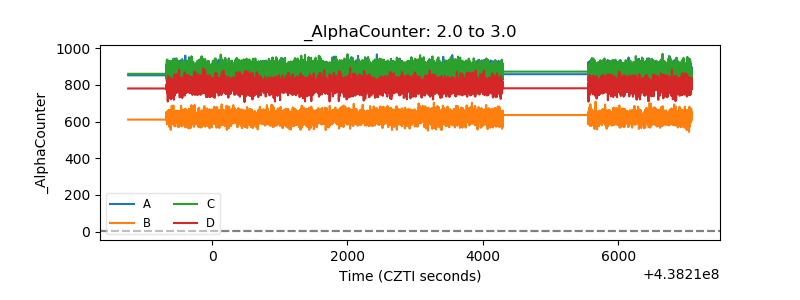 |
| _CPM_Rate | 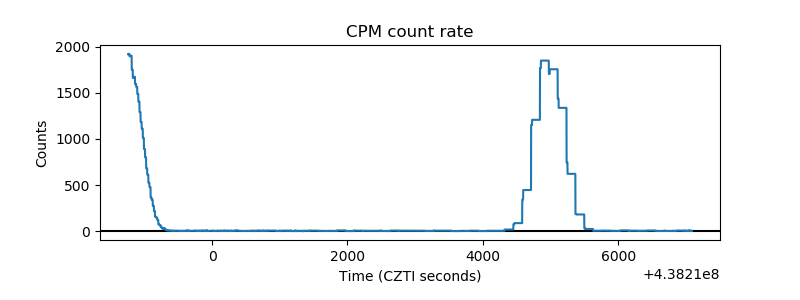 |
| CZT Counter | 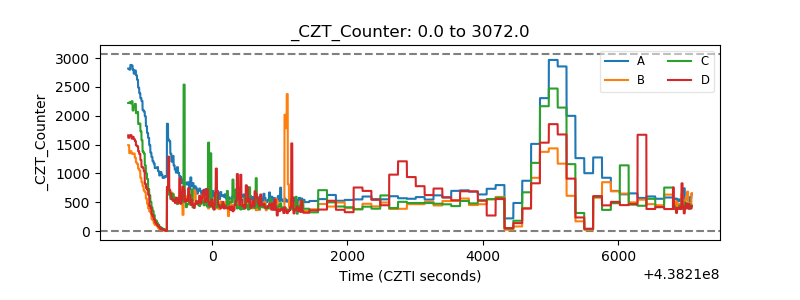 |
| +2.5 Volts monitor | 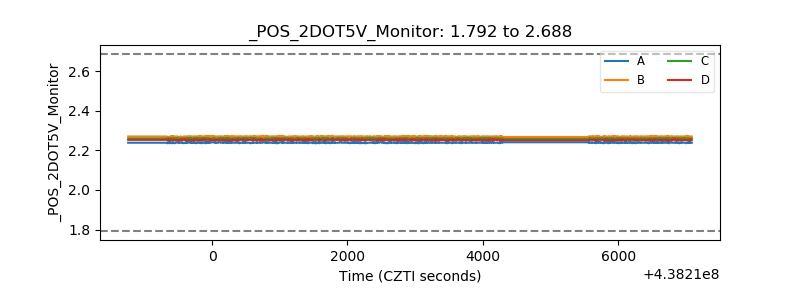 |
| +5 Volts monitor | 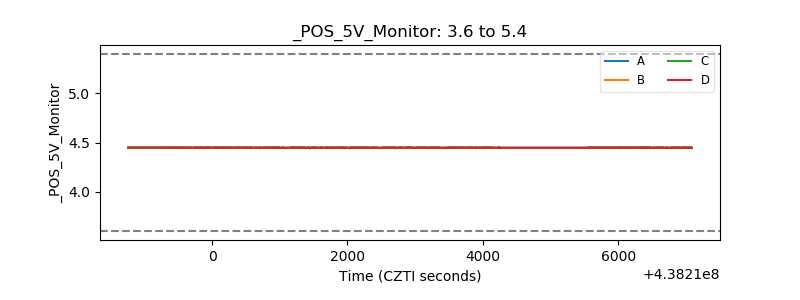 |
| _ROLL_ROT | 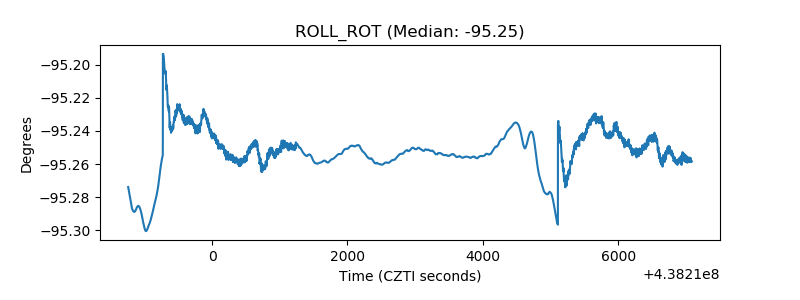 |
| _Roll_DEC | 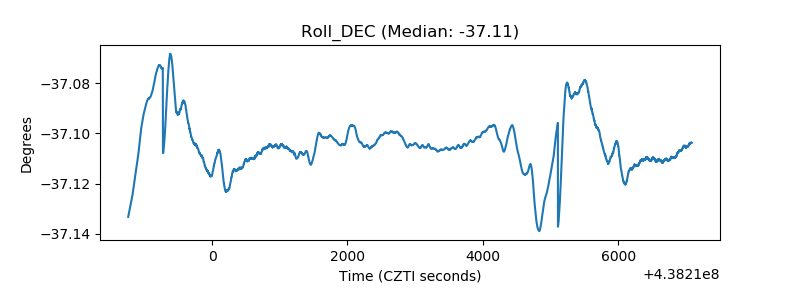 |
| _Roll_RA | 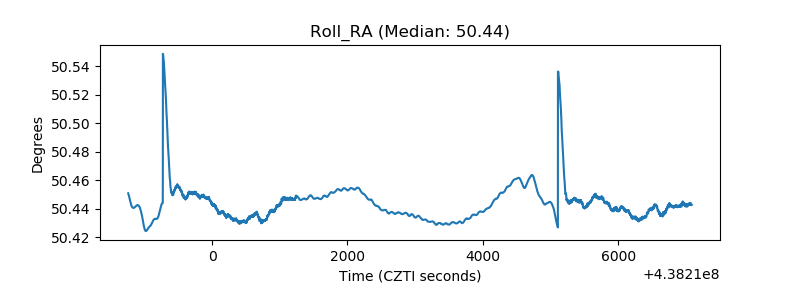 |
| Veto Counter | 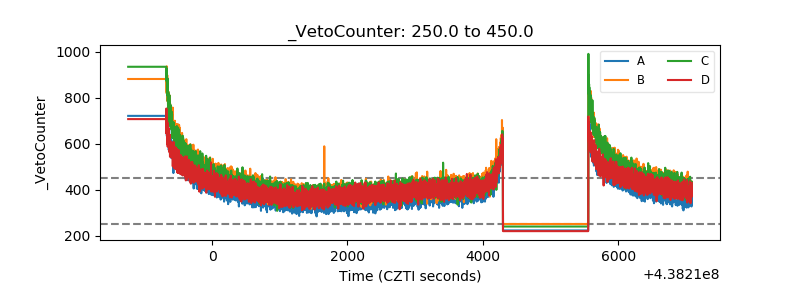 |