| Param | Original file | Final file |
|---|---|---|
| Filename | modeM0/AS1A13_025T02_9000005938_44054cztM0_level2.fits | modeM0/AS1A13_025T02_9000005938_44054cztM0_level2_quad_clean.evt |
| Size (bytes) | 413,910,720 | 115,464,960 |
| Size | 394.7 MB | 110.1 MB |
| Events in quadrant A | 4,148,759 | 777,317 |
| Events in quadrant B | 3,321,027 | 817,369 |
| Events in quadrant C | 3,575,608 | 763,901 |
| Events in quadrant D | 3,771,539 | 685,417 |
| Mode M0 | |||
|---|---|---|---|
| Quadrant | BADHDUFLAG | Total packets | Discarded packets |
| A | 0 | 16591 | 1 |
| B | 0 | 14072 | 1 |
| C | 0 | 14936 | 1 |
| D | 0 | 15703 | 1 |
| Mode M9 | |||
|---|---|---|---|
| Quadrant | BADHDUFLAG | Total packets | Discarded packets |
| A | 0 | 13 | 0 |
| B | 0 | 13 | 0 |
| C | 0 | 13 | 0 |
| D | 0 | 13 | 0 |
| Mode SS | |||
|---|---|---|---|
| Quadrant | BADHDUFLAG | Total packets | Discarded packets |
| A | 0 | 130 | 0 |
| B | 0 | 130 | 0 |
| C | 0 | 130 | 0 |
| D | 0 | 130 | 0 |
| Quadrant | Total seconds | Saturated seconds | Saturation percentage |
|---|---|---|---|
| A | 6493 | 60 | 0.924072% |
| B | 6493 | 41 | 0.631449% |
| C | 6494 | 56 | 0.862334% |
| D | 6494 | 136 | 2.094241% |
Noise dominated data is calculated using 1-second bins in cleaned event files. If a bin has >2000 counts, and if more than 50% of those come from <1% of pixels, then it is considered to be noise-dominated and hence unusable.
| Quadrant | # 1 sec bins | Bins with >0 counts | Bins with >2000 counts | High rate bins dominated by noise | Noise dominated (total time) | Noise dominated (detector-on time) | Marked lightcurve |
|---|---|---|---|---|---|---|---|
| A | 7728 | 6494 | 1 | 1 | 0.01% | 0.02% | 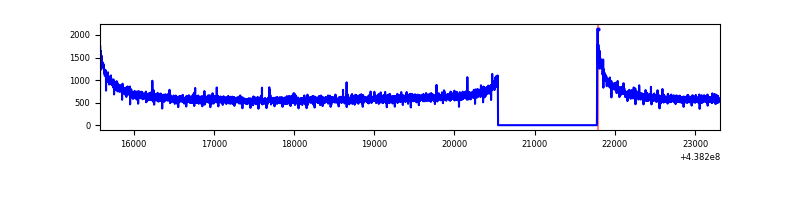 |
| B | 7728 | 6494 | 7 | 7 | 0.09% | 0.11% | 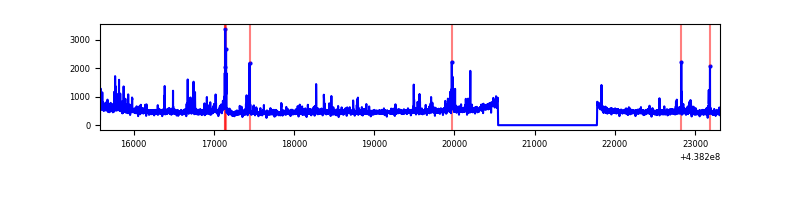 |
| C | 7729 | 6495 | 36 | 36 | 0.47% | 0.55% | 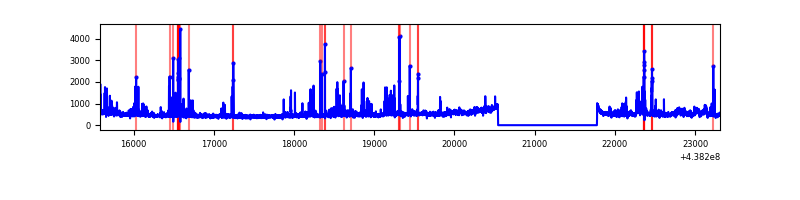 |
| D | 7729 | 6495 | 112 | 112 | 1.45% | 1.72% | 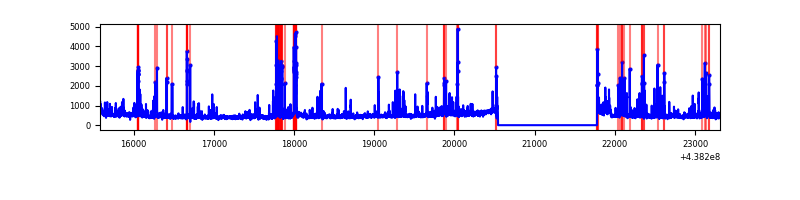 |
Top three noisy pixels from each quadrant. If the there are fewer than three noisy pixels in the level2.evt file, extra rows are filled as -1
| Pixel properties | Quadrant properties | ||||||
|---|---|---|---|---|---|---|---|
| Quadrant | DetID | PixID | Counts | Sigma | Mean | Median | Sigma |
| A | 10 | 83 | 1214221 | 7803.99 | 757 | 744 | 155.5 |
| A | 15 | 223 | 12608 | 76.3 | 757 | 744 | 155.5 |
| A | 3 | 137 | 8280 | 48.46 | 757 | 744 | 155.5 |
| B | 0 | 213 | 226268 | 1530.41 | 766 | 743 | 147.4 |
| B | 0 | 200 | 68054 | 456.77 | 766 | 743 | 147.4 |
| B | 12 | 111 | 18819 | 122.66 | 766 | 743 | 147.4 |
| C | 14 | 254 | 441775 | 2494.61 | 752 | 758 | 176.8 |
| C | 3 | 233 | 198620 | 1119.2 | 752 | 758 | 176.8 |
| C | 9 | 237 | 5857 | 28.84 | 752 | 758 | 176.8 |
| D | 1 | 52 | 463348 | 2559.41 | 733 | 713 | 180.8 |
| D | 2 | 249 | 110988 | 610.07 | 733 | 713 | 180.8 |
| D | 12 | 238 | 103667 | 569.57 | 733 | 713 | 180.8 |
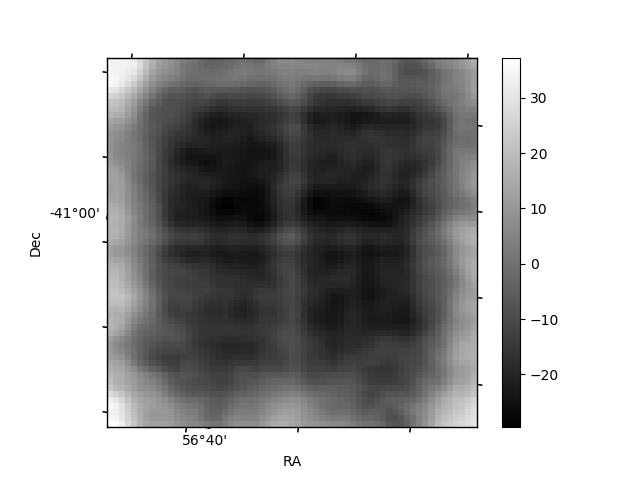
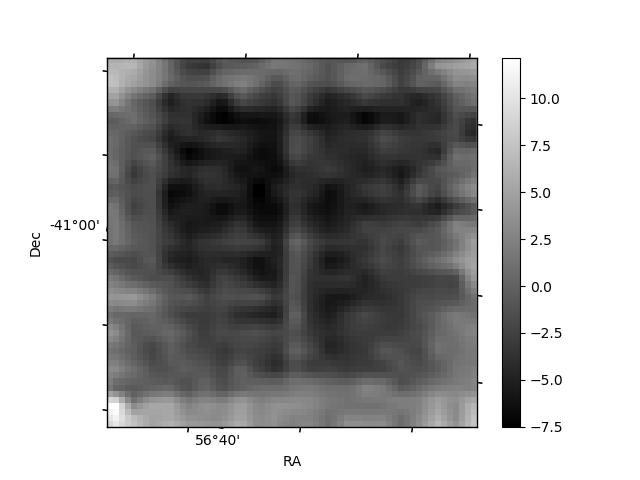
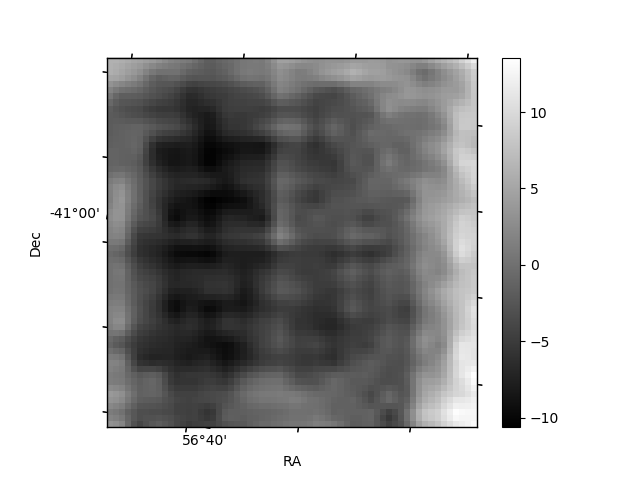
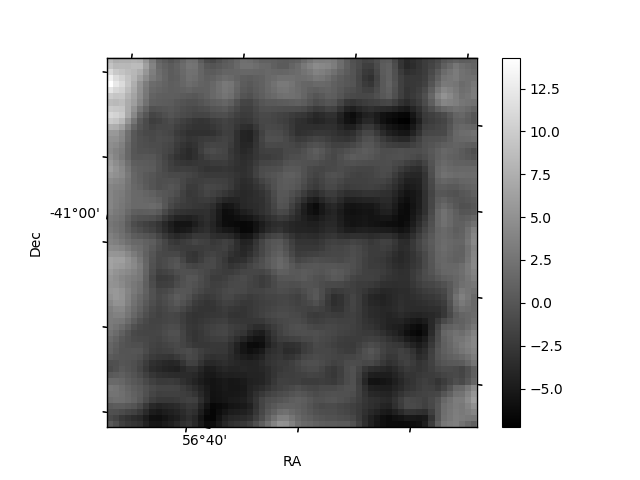
Histogram calculated using DETX and DETY for each event in the final _common_clean file
| Quadrant A | 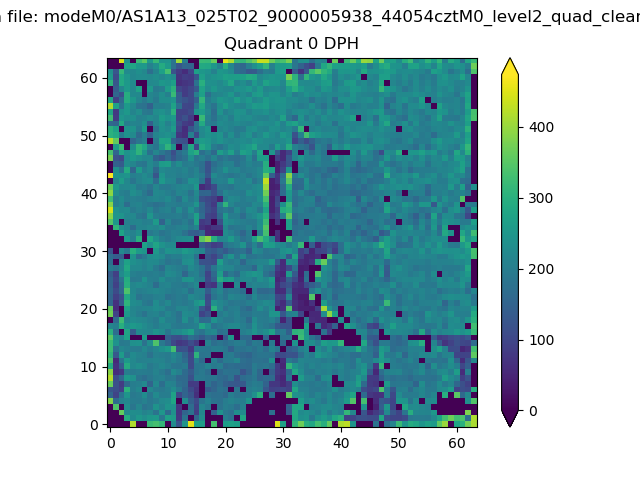 |
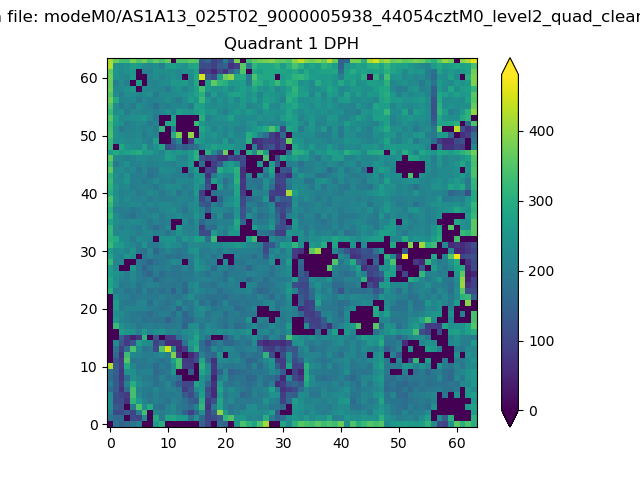 |
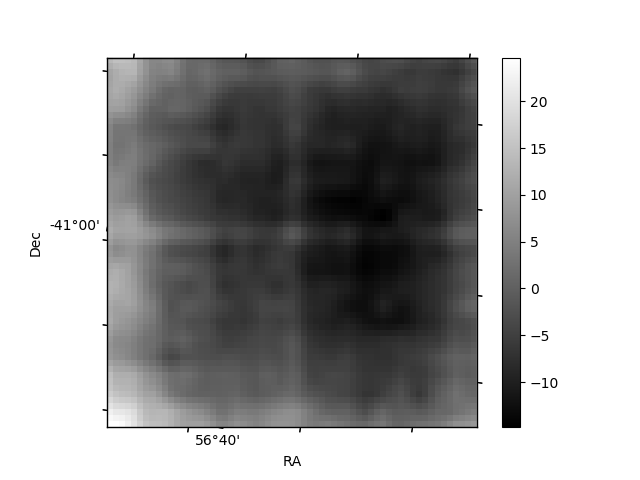
Quadrant B |
|---|---|---|---|
| Quadrant D | 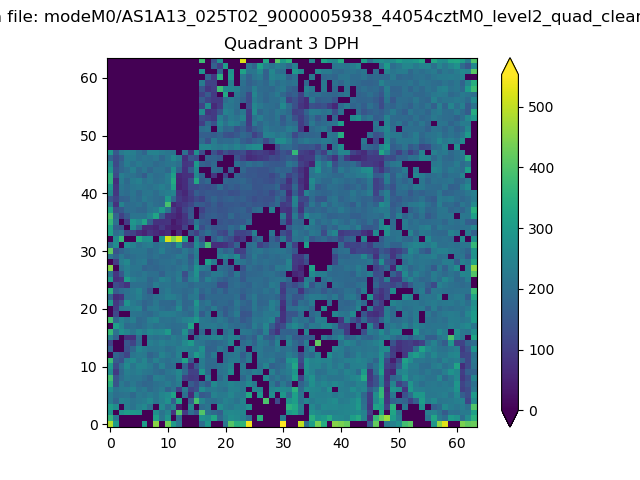 |
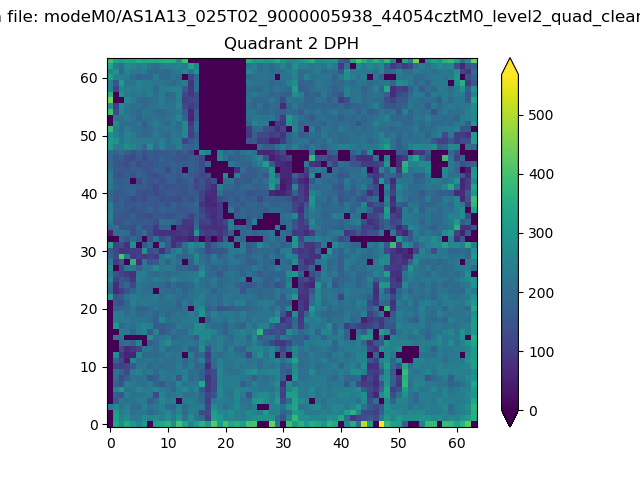 |
Quadrant C |
| Plot type | Count rate plots | Images |
|---|---|---|
| Comparison with Poisson distribution Blue bars denote a histogram of data divided into 1 sec bins. Red curve is a Poisson curve with rate = median count rate of data. |
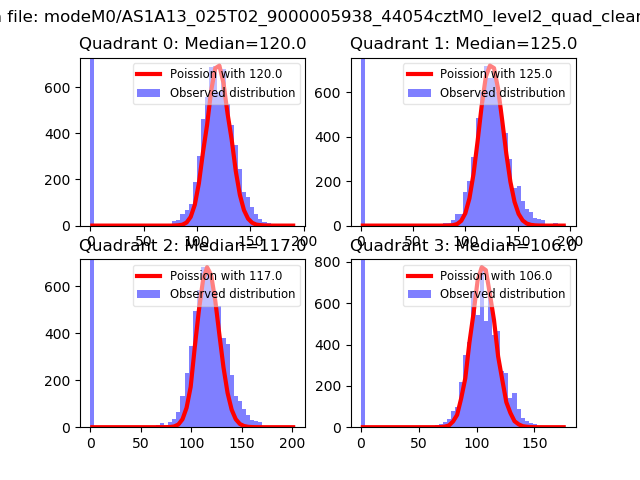 |
 |
| Quadrant-wise count rates Data is divided into 100 sec bins |
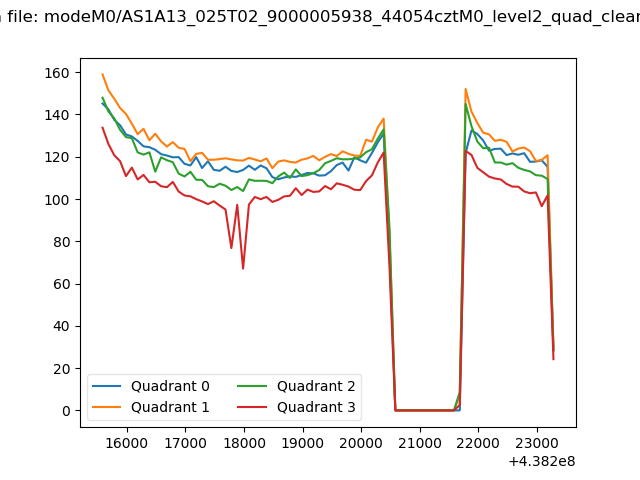 |
|
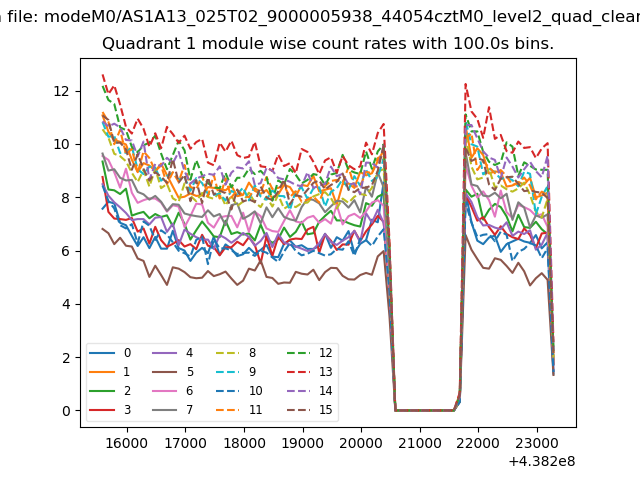
| Module-wise count rates for Quadrant A Data is divided into 100 sec bins |
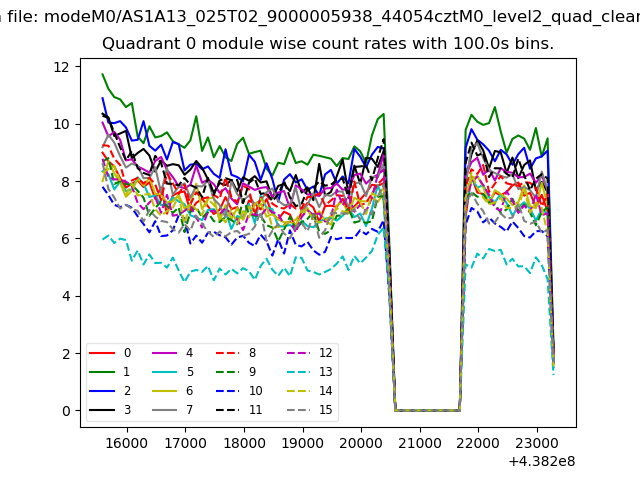 |
 |
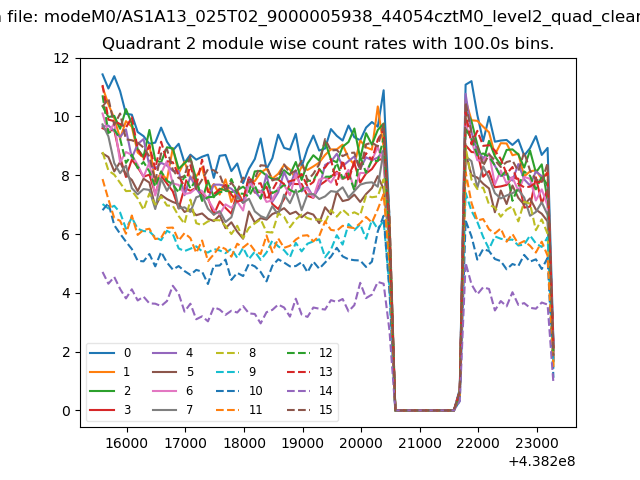
| Module-wise count rates for Quadrant B Data is divided into 100 sec bins |
 |
 |
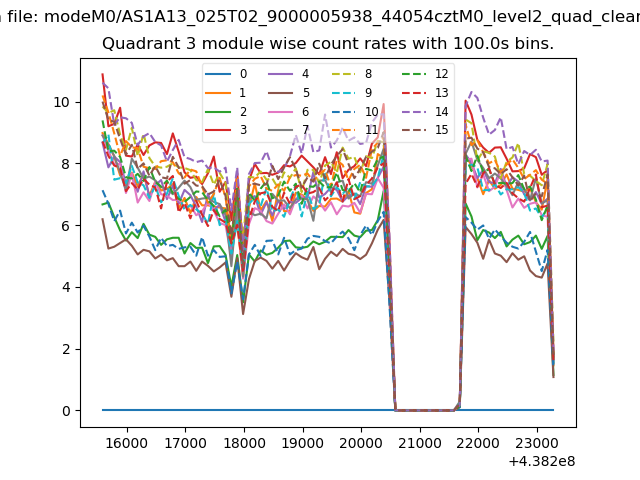
| Module-wise count rates for Quadrant C Data is divided into 100 sec bins |
 |
 |
| Module-wise count rates for Quadrant D Data is divided into 100 sec bins |
 |
 |
| Parameter | Plot |
|---|---|
| CZT HV Monitor | 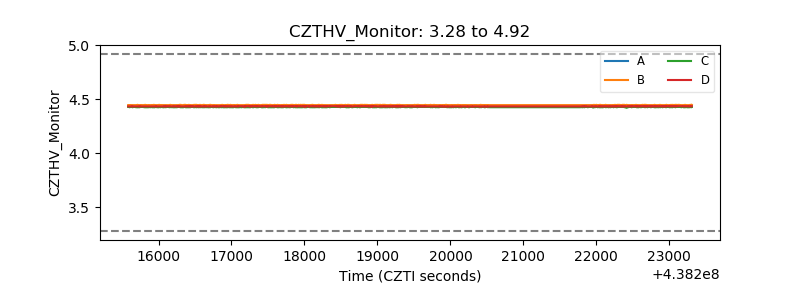 |
| D_VDD | 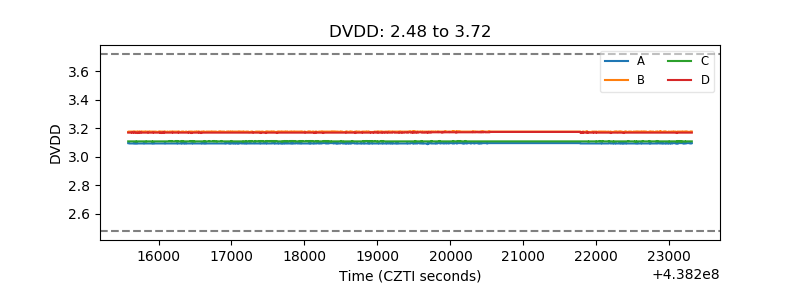 |
| Temperature 1 | 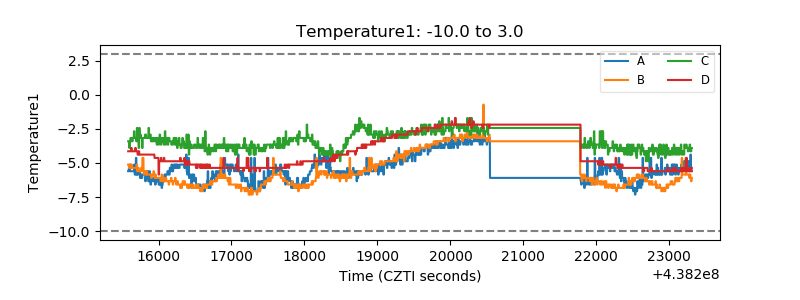 |
| Veto HV Monitor | 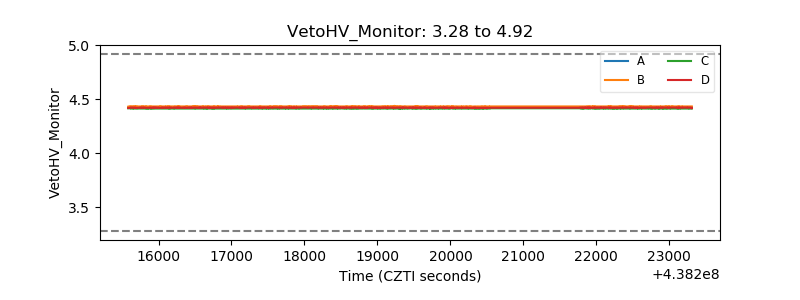 |
| Veto LLD | 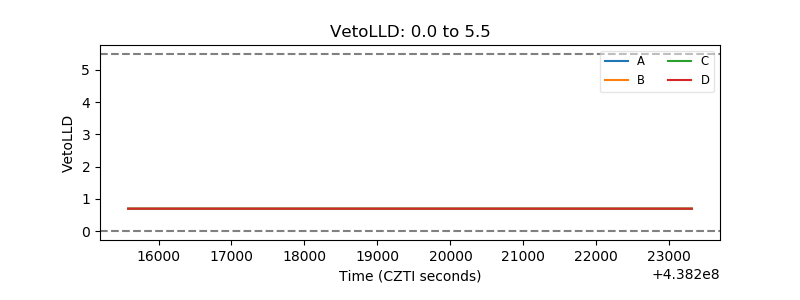 |
| Alpha Counter | 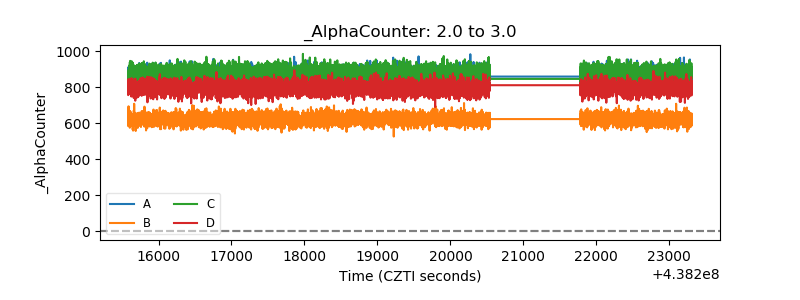 |
| _CPM_Rate | 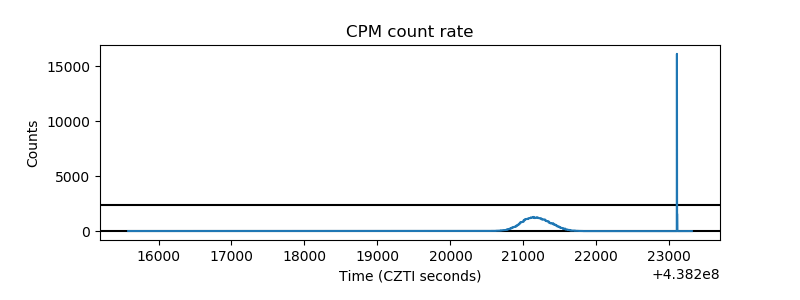 |
| CZT Counter | 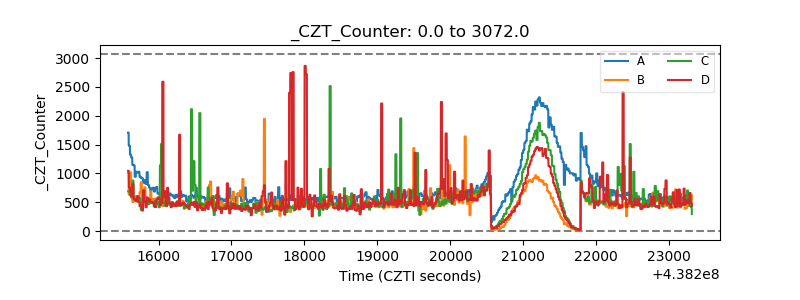 |
| +2.5 Volts monitor | 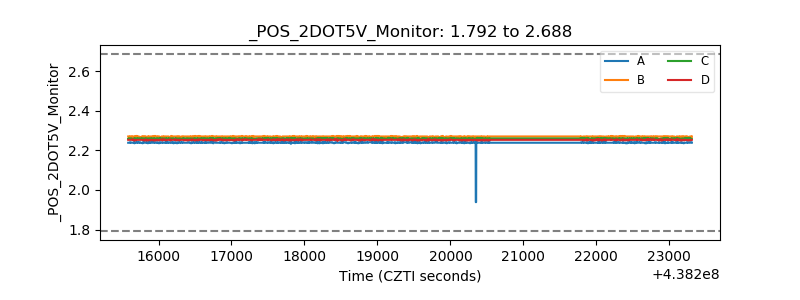 |
| +5 Volts monitor | 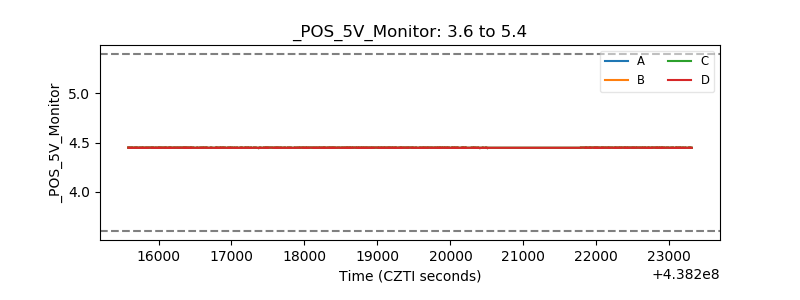 |
| _ROLL_ROT | 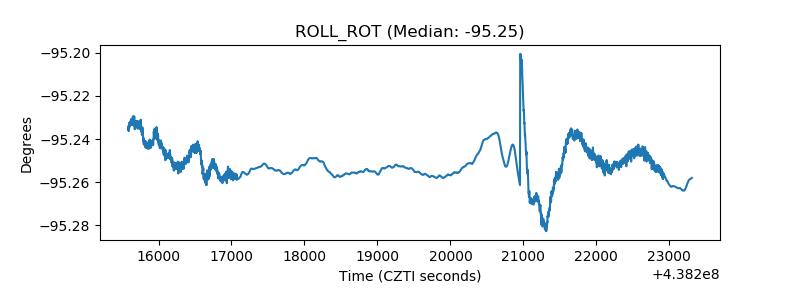 |
| _Roll_DEC | 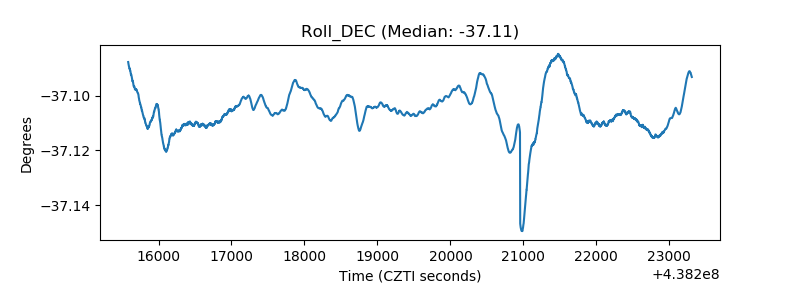 |
| _Roll_RA | 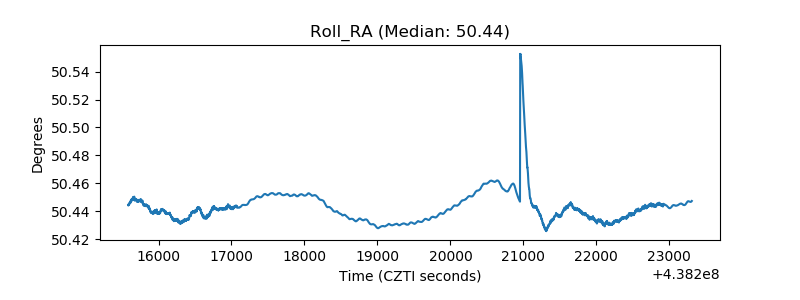 |
| Veto Counter | 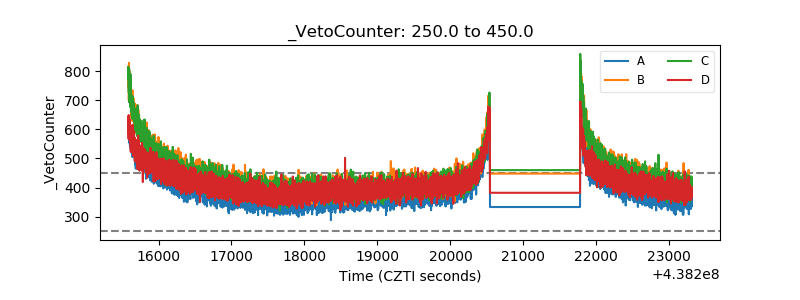 |