| Param | Original file | Final file |
|---|---|---|
| Filename | modeM0/AS1A13_025T02_9000005938_44055cztM0_level2.fits | modeM0/AS1A13_025T02_9000005938_44055cztM0_level2_quad_clean.evt |
| Size (bytes) | 427,489,920 | 100,500,480 |
| Size | 407.7 MB | 95.8 MB |
| Events in quadrant A | 3,922,384 | 686,087 |
| Events in quadrant B | 2,918,388 | 723,269 |
| Events in quadrant C | 3,205,495 | 682,812 |
| Events in quadrant D | 5,316,092 | 536,647 |
| Mode M0 | |||
|---|---|---|---|
| Quadrant | BADHDUFLAG | Total packets | Discarded packets |
| A | 0 | 15692 | 2 |
| B | 0 | 12595 | 2 |
| C | 0 | 13360 | 2 |
| D | 0 | 19830 | 2 |
| Mode M9 | |||
|---|---|---|---|
| Quadrant | BADHDUFLAG | Total packets | Discarded packets |
| A | 0 | 21 | 0 |
| B | 0 | 22 | 0 |
| C | 0 | 22 | 0 |
| D | 0 | 22 | 0 |
| Mode SS | |||
|---|---|---|---|
| Quadrant | BADHDUFLAG | Total packets | Discarded packets |
| A | 0 | 118 | 0 |
| B | 0 | 118 | 0 |
| C | 0 | 118 | 0 |
| D | 0 | 118 | 0 |
| Quadrant | Total seconds | Saturated seconds | Saturation percentage |
|---|---|---|---|
| A | 5940 | 87 | 1.464646% |
| B | 5940 | 41 | 0.690236% |
| C | 5940 | 60 | 1.010101% |
| D | 5940 | 873 | 14.696970% |
Noise dominated data is calculated using 1-second bins in cleaned event files. If a bin has >2000 counts, and if more than 50% of those come from <1% of pixels, then it is considered to be noise-dominated and hence unusable.
| Quadrant | # 1 sec bins | Bins with >0 counts | Bins with >2000 counts | High rate bins dominated by noise | Noise dominated (total time) | Noise dominated (detector-on time) | Marked lightcurve |
|---|---|---|---|---|---|---|---|
| A | 7070 | 5941 | 4 | 4 | 0.06% | 0.07% | 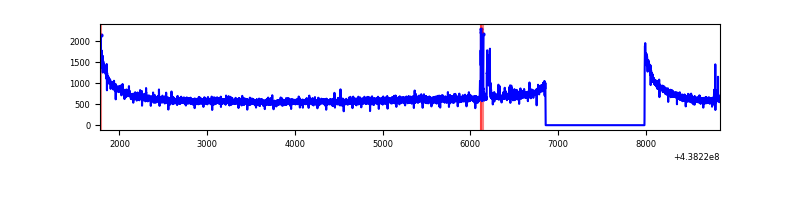 |
| B | 7070 | 5941 | 3 | 3 | 0.04% | 0.05% | 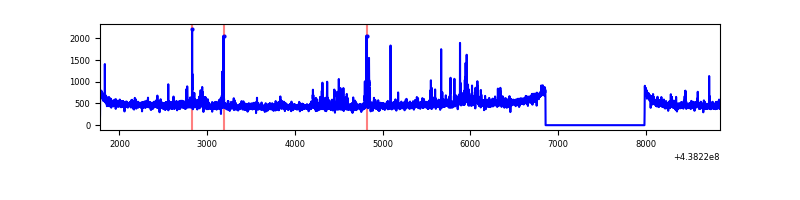 |
| C | 7070 | 5941 | 28 | 28 | 0.40% | 0.47% | 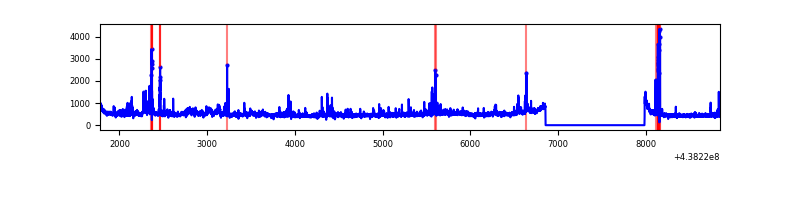 |
| D | 7070 | 5941 | 628 | 628 | 8.88% | 10.57% | 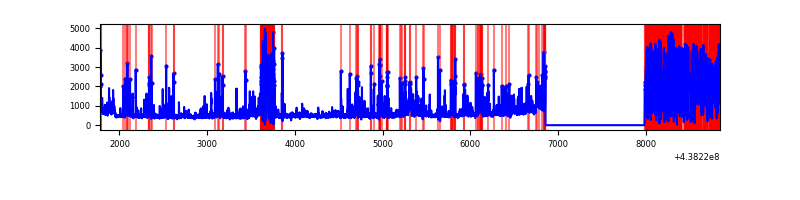 |
Top three noisy pixels from each quadrant. If the there are fewer than three noisy pixels in the level2.evt file, extra rows are filled as -1
| Pixel properties | Quadrant properties | ||||||
|---|---|---|---|---|---|---|---|
| Quadrant | DetID | PixID | Counts | Sigma | Mean | Median | Sigma |
| A | 10 | 83 | 1190443 | 8325.22 | 689 | 674 | 142.9 |
| A | 14 | 238 | 52014 | 359.24 | 689 | 674 | 142.9 |
| A | 15 | 223 | 16518 | 110.87 | 689 | 674 | 142.9 |
| B | 0 | 213 | 107285 | 779.82 | 698 | 677 | 136.7 |
| B | 0 | 200 | 30271 | 216.47 | 698 | 677 | 136.7 |
| B | 4 | 171 | 22594 | 160.32 | 698 | 677 | 136.7 |
| C | 3 | 233 | 248704 | 1523.6 | 686 | 691 | 162.8 |
| C | 14 | 254 | 221125 | 1354.17 | 686 | 691 | 162.8 |
| C | 9 | 237 | 61219 | 371.84 | 686 | 691 | 162.8 |
| D | 1 | 52 | 2432782 | 15665.79 | 617 | 596 | 155.3 |
| D | 13 | 138 | 189634 | 1217.6 | 617 | 596 | 155.3 |
| D | 2 | 249 | 155710 | 999.09 | 617 | 596 | 155.3 |
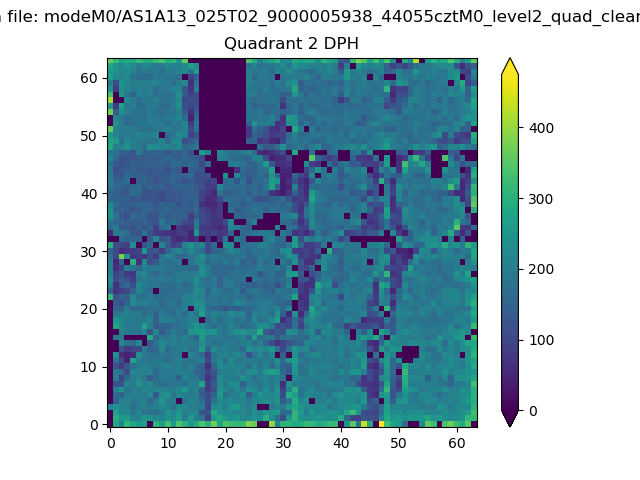
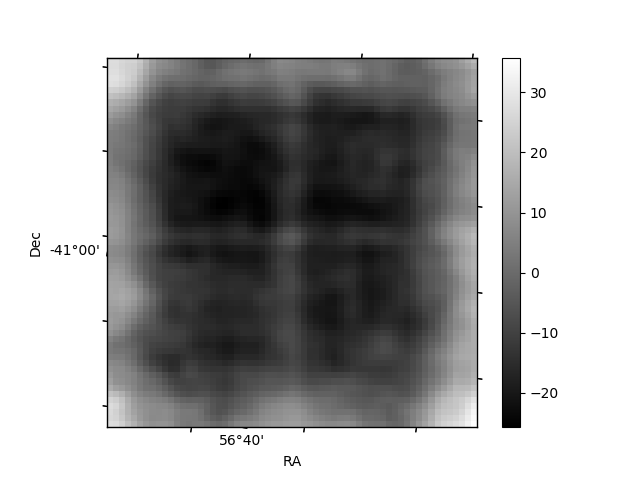
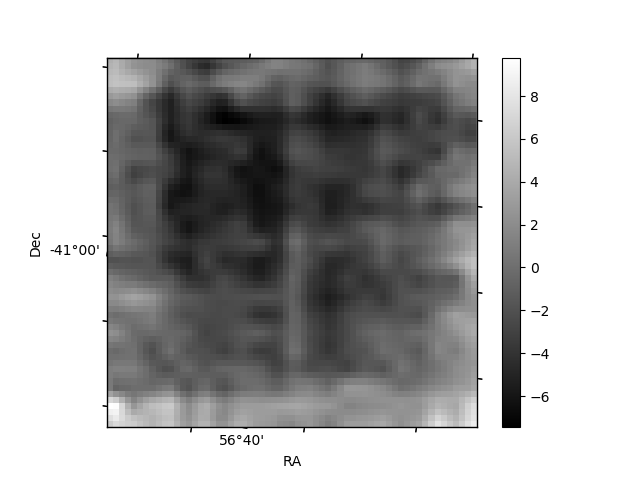
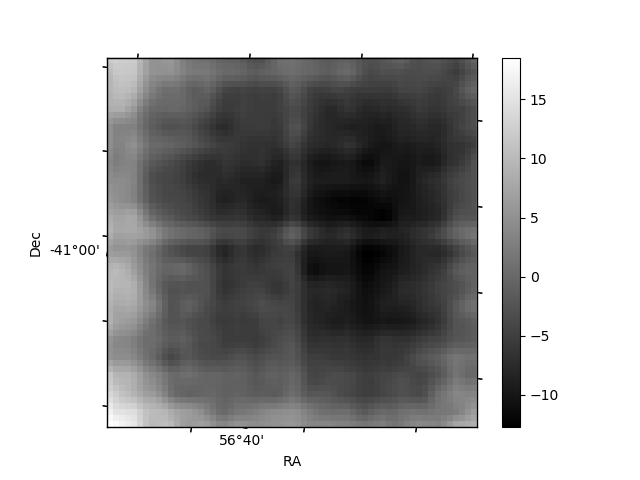
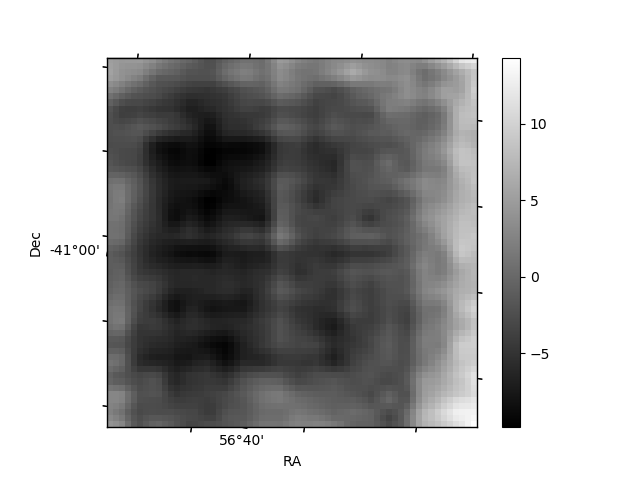
Histogram calculated using DETX and DETY for each event in the final _common_clean file
| Quadrant A | 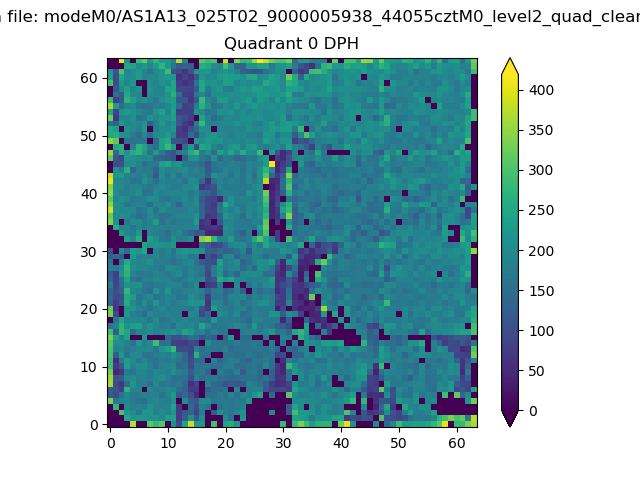 |
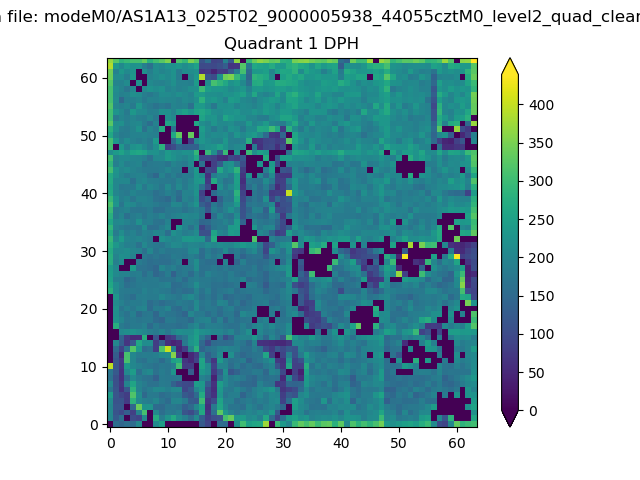 |
Quadrant B |
|---|---|---|---|
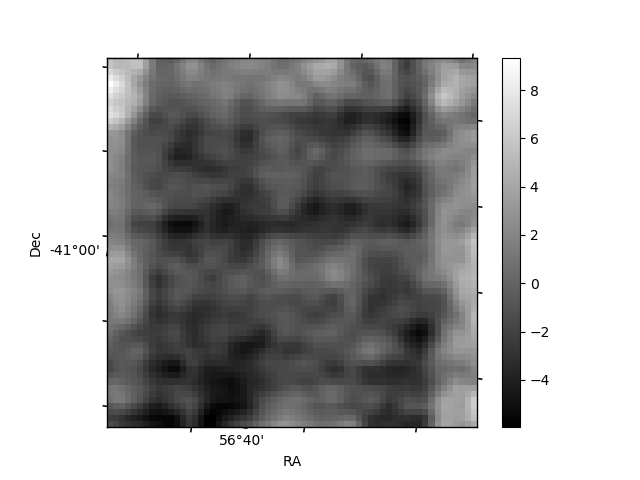
| Quadrant D | 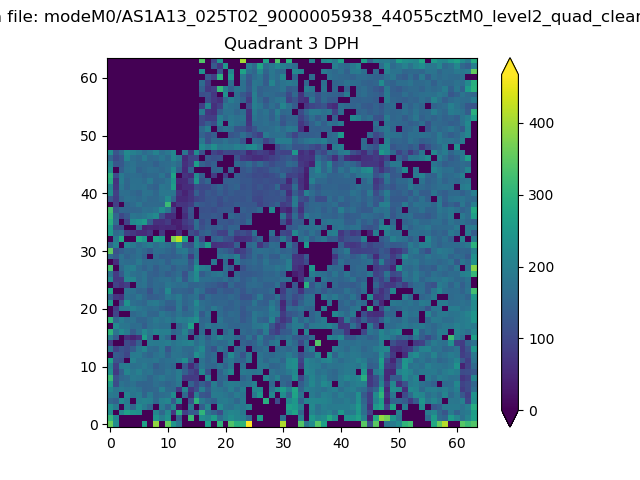 |
 |
Quadrant C |
| Plot type | Count rate plots | Images |
|---|---|---|
| Comparison with Poisson distribution Blue bars denote a histogram of data divided into 1 sec bins. Red curve is a Poisson curve with rate = median count rate of data. |
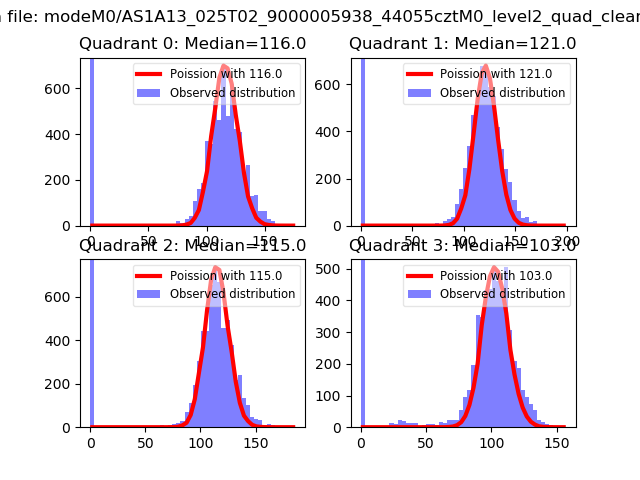 |
 |
| Quadrant-wise count rates Data is divided into 100 sec bins |
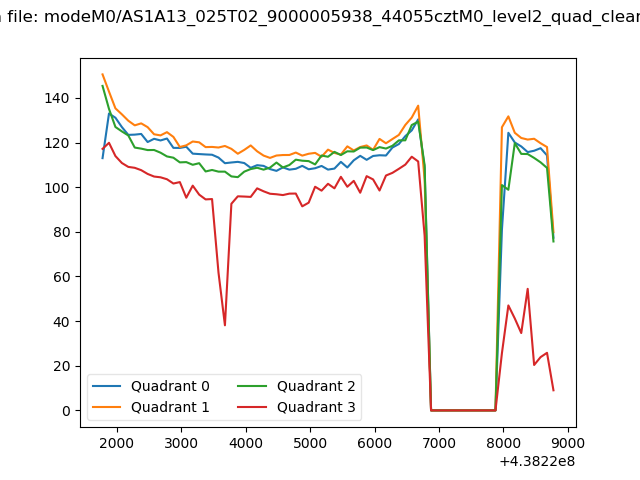 |
|
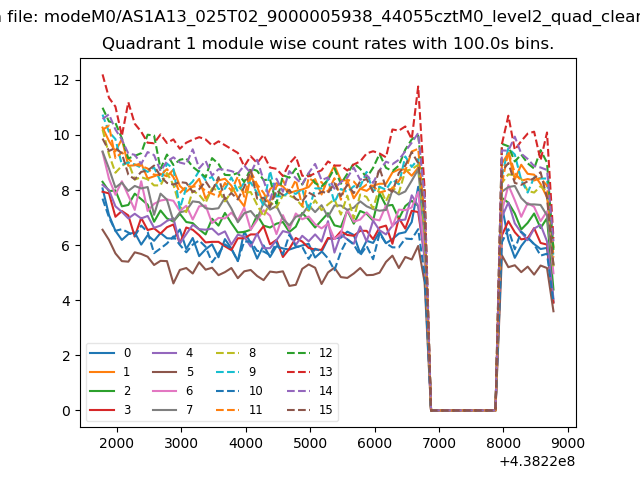
| Module-wise count rates for Quadrant A Data is divided into 100 sec bins |
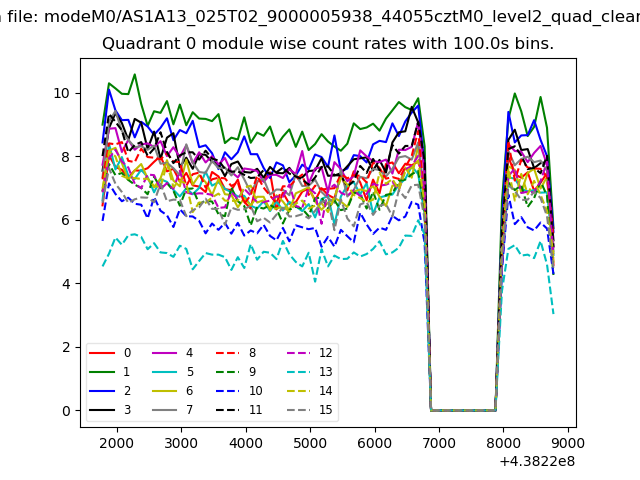 |
 |
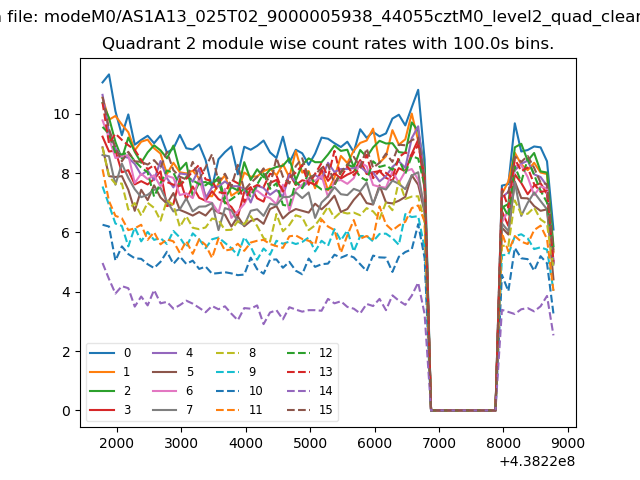
| Module-wise count rates for Quadrant B Data is divided into 100 sec bins |
 |
 |
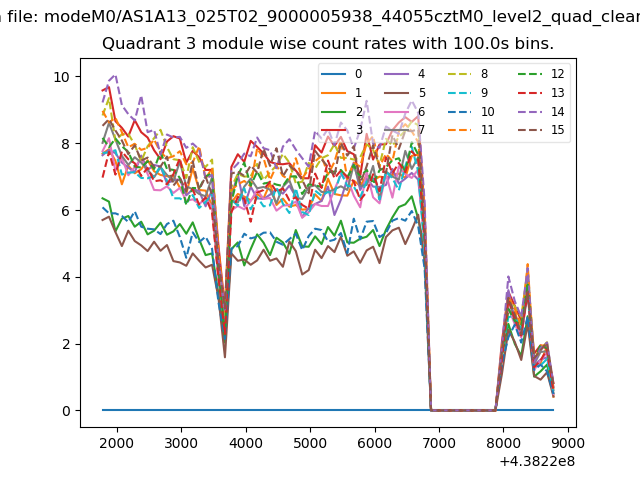
| Module-wise count rates for Quadrant C Data is divided into 100 sec bins |
 |
 |
| Module-wise count rates for Quadrant D Data is divided into 100 sec bins |
 |
 |
| Parameter | Plot |
|---|---|
| CZT HV Monitor | 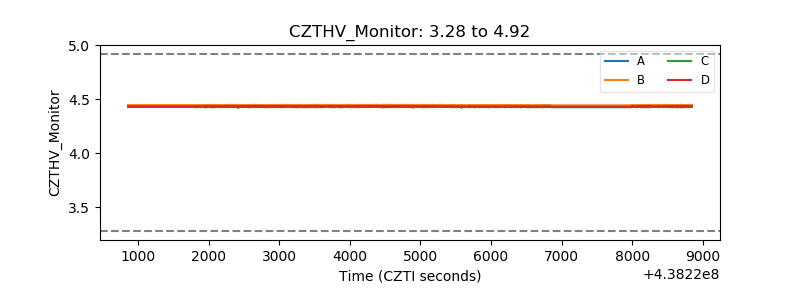 |
| D_VDD | 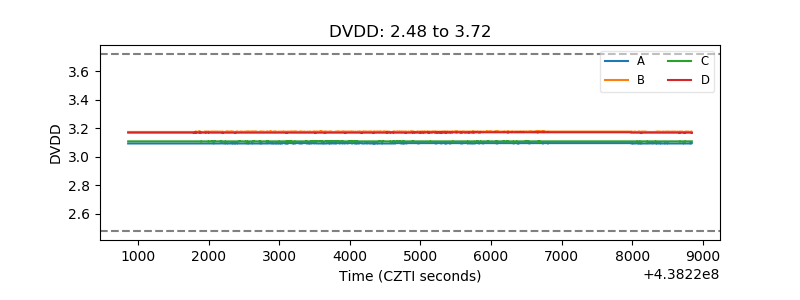 |
| Temperature 1 | 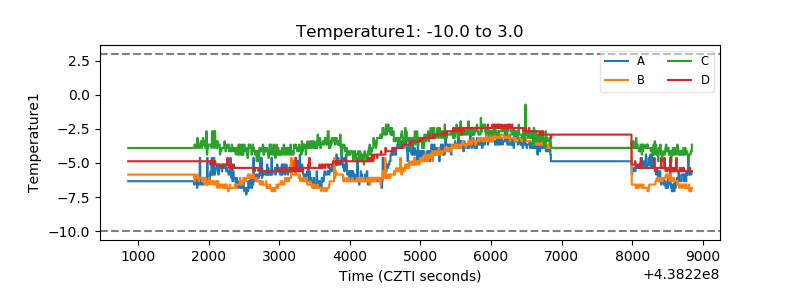 |
| Veto HV Monitor |  |
| Veto LLD | 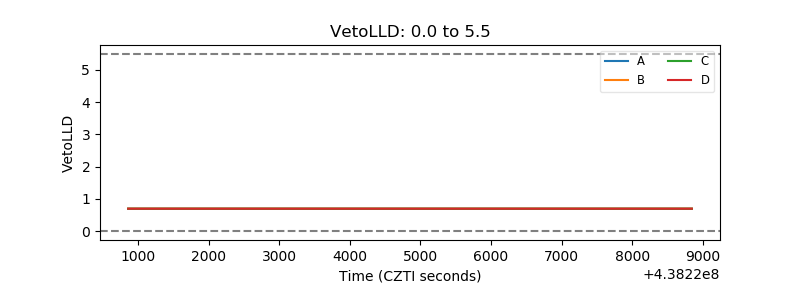 |
| Alpha Counter | 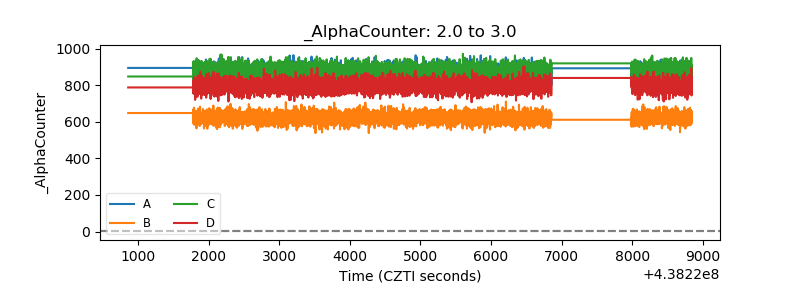 |
| _CPM_Rate | 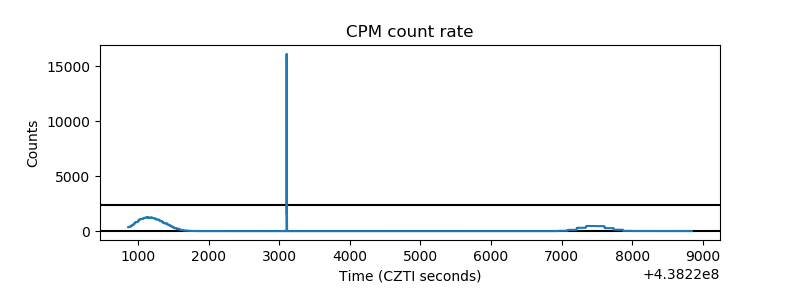 |
| CZT Counter | 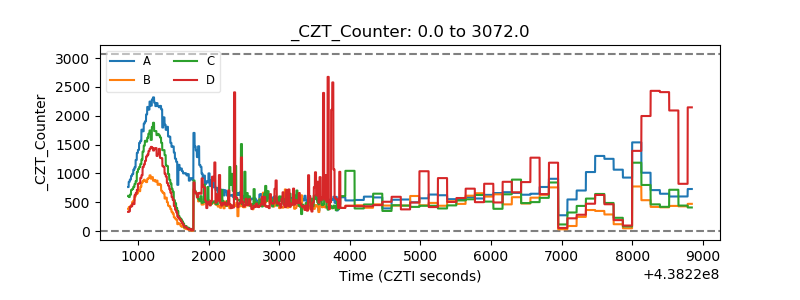 |
| +2.5 Volts monitor | 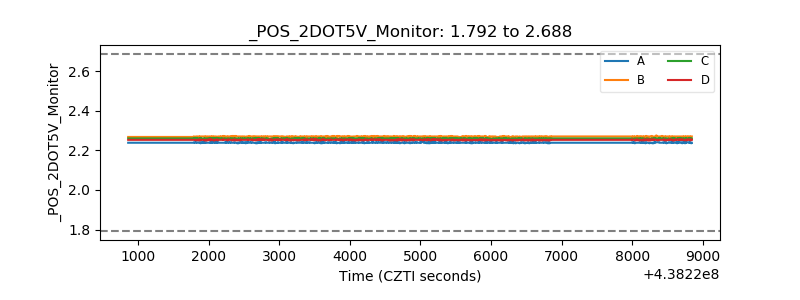 |
| +5 Volts monitor | 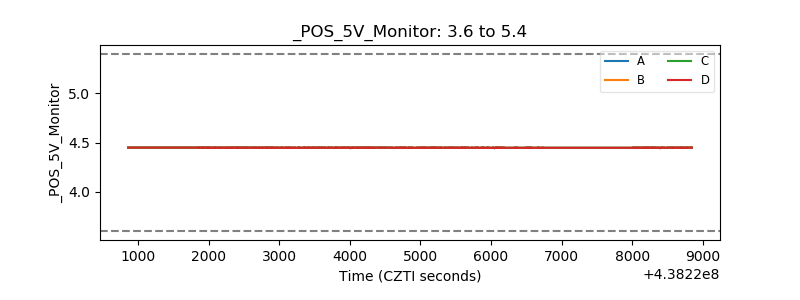 |
| _ROLL_ROT | 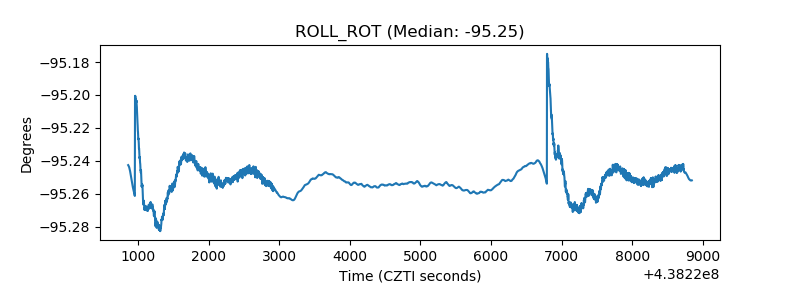 |
| _Roll_DEC | 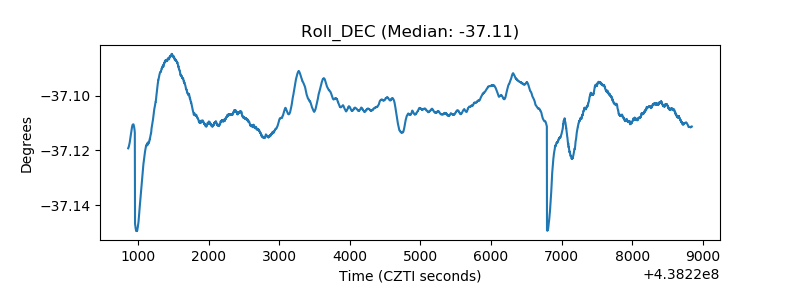 |
| _Roll_RA | 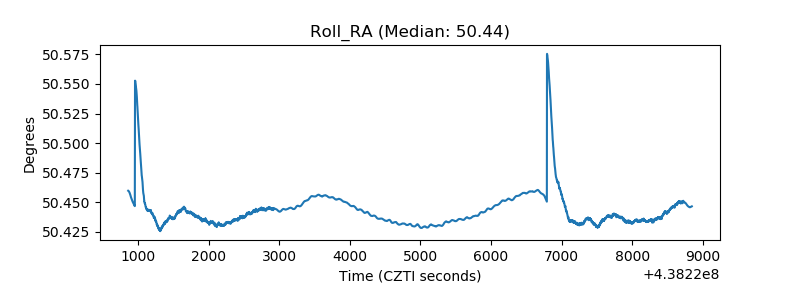 |
| Veto Counter | 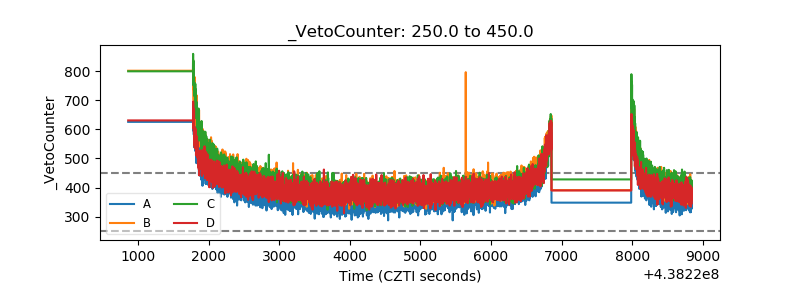 |