| Param | Original file | Final file |
|---|---|---|
| Filename | modeM0/AS1A13_029T01_9000005940_44056cztM0_level2.fits | modeM0/AS1A13_029T01_9000005940_44056cztM0_level2_quad_clean.evt |
| Size (bytes) | 364,858,560 | 88,885,440 |
| Size | 348.0 MB | 84.8 MB |
| Events in quadrant A | 3,344,354 | 604,244 |
| Events in quadrant B | 2,501,172 | 629,849 |
| Events in quadrant C | 2,778,992 | 592,192 |
| Events in quadrant D | 4,455,609 | 482,868 |
| Mode SS | |||
|---|---|---|---|
| Quadrant | BADHDUFLAG | Total packets | Discarded packets |
| A | 0 | 110 | 0 |
| B | 0 | 110 | 0 |
| C | 0 | 110 | 0 |
| D | 0 | 110 | 0 |
| Mode M0 | |||
|---|---|---|---|
| Quadrant | BADHDUFLAG | Total packets | Discarded packets |
| A | 0 | 13442 | 2 |
| B | 0 | 11217 | 1 |
| C | 0 | 11979 | 1 |
| D | 0 | 16812 | 1 |
| Mode M9 | |||
|---|---|---|---|
| Quadrant | BADHDUFLAG | Total packets | Discarded packets |
| A | 0 | 9 | 0 |
| B | 0 | 9 | 0 |
| C | 0 | 9 | 0 |
| D | 0 | 9 | 0 |
| Quadrant | Total seconds | Saturated seconds | Saturation percentage |
|---|---|---|---|
| A | 5464 | 79 | 1.445827% |
| B | 5464 | 76 | 1.390922% |
| C | 5464 | 82 | 1.500732% |
| D | 5464 | 774 | 14.165447% |
Noise dominated data is calculated using 1-second bins in cleaned event files. If a bin has >2000 counts, and if more than 50% of those come from <1% of pixels, then it is considered to be noise-dominated and hence unusable.
| Quadrant | # 1 sec bins | Bins with >0 counts | Bins with >2000 counts | High rate bins dominated by noise | Noise dominated (total time) | Noise dominated (detector-on time) | Marked lightcurve |
|---|---|---|---|---|---|---|---|
| A | 6284 | 5465 | 0 | 0 | 0.00% | 0.00% | 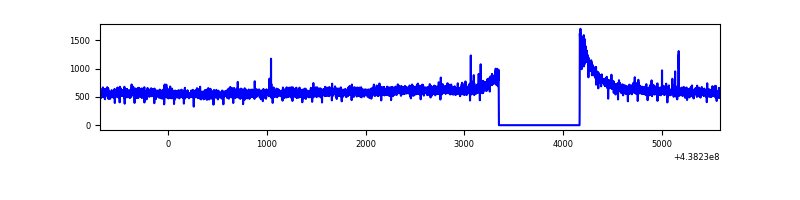 |
| B | 6284 | 5465 | 0 | 0 | 0.00% | 0.00% | 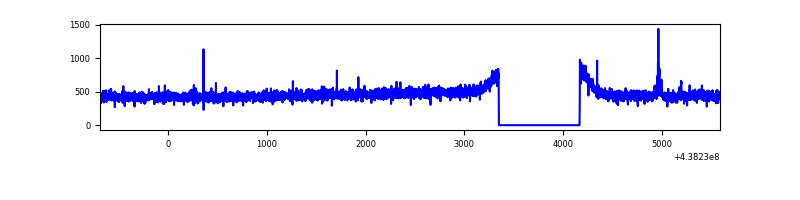 |
| C | 6284 | 5465 | 19 | 19 | 0.30% | 0.35% | 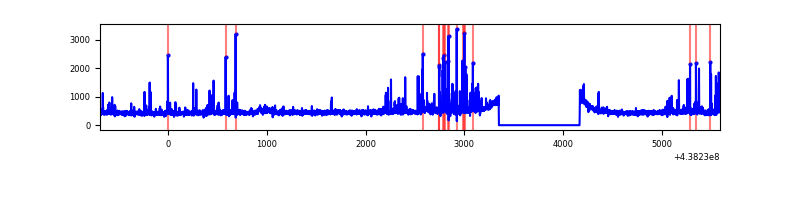 |
| D | 6284 | 5465 | 446 | 446 | 7.10% | 8.16% | 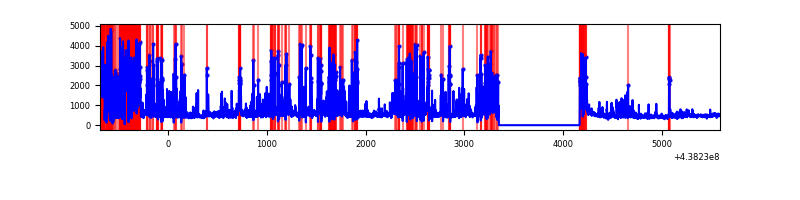 |
Top three noisy pixels from each quadrant. If the there are fewer than three noisy pixels in the level2.evt file, extra rows are filled as -1
| Pixel properties | Quadrant properties | ||||||
|---|---|---|---|---|---|---|---|
| Quadrant | DetID | PixID | Counts | Sigma | Mean | Median | Sigma |
| A | 10 | 83 | 886840 | 6698.13 | 631 | 618 | 132.3 |
| A | 7 | 3 | 11069 | 78.99 | 631 | 618 | 132.3 |
| A | 3 | 137 | 7286 | 50.4 | 631 | 618 | 132.3 |
| B | 12 | 111 | 16325 | 124.43 | 632 | 612 | 126.3 |
| B | 11 | 111 | 14932 | 113.4 | 632 | 612 | 126.3 |
| B | 0 | 200 | 14919 | 113.29 | 632 | 612 | 126.3 |
| C | 14 | 254 | 255680 | 1707.44 | 627 | 631 | 149.4 |
| C | 3 | 233 | 53382 | 353.15 | 627 | 631 | 149.4 |
| C | 12 | 249 | 10869 | 68.54 | 627 | 631 | 149.4 |
| D | 1 | 52 | 2032429 | 14274.49 | 565 | 547 | 142.3 |
| D | 5 | 222 | 99787 | 697.19 | 565 | 547 | 142.3 |
| D | 2 | 249 | 57225 | 398.18 | 565 | 547 | 142.3 |
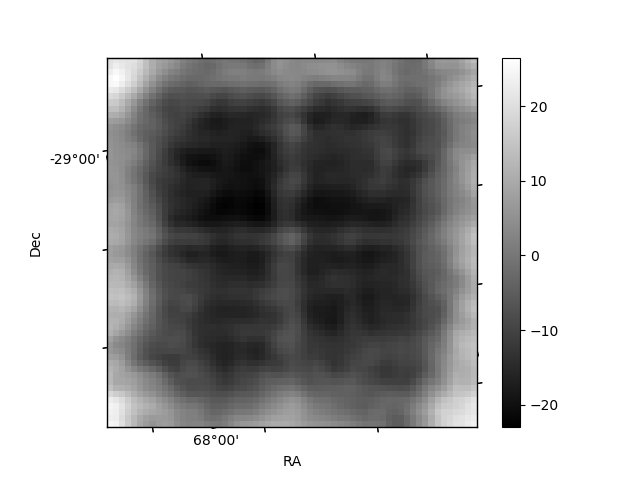
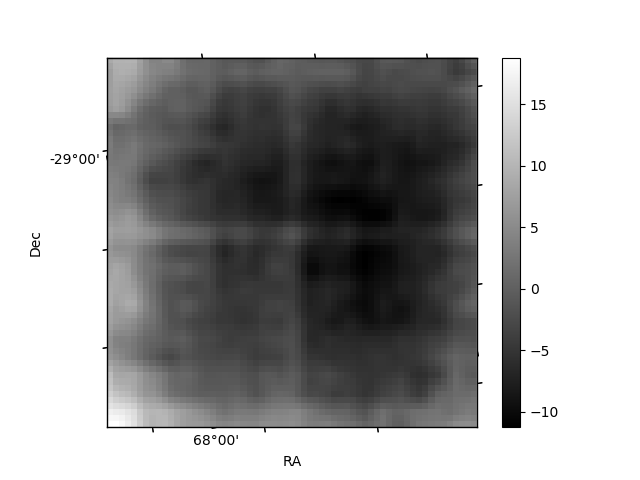
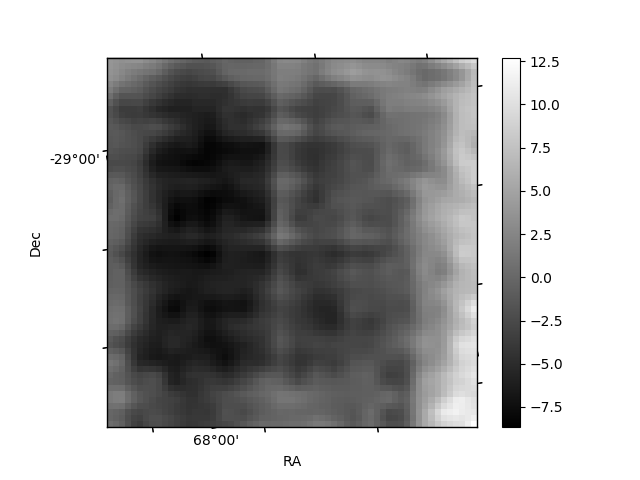
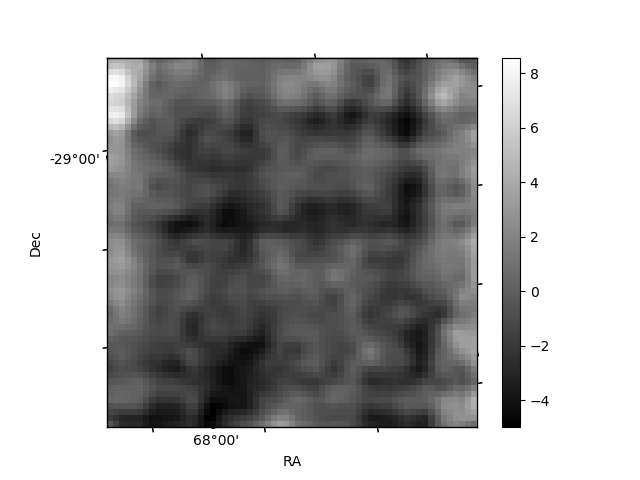
Histogram calculated using DETX and DETY for each event in the final _common_clean file
| Quadrant A | 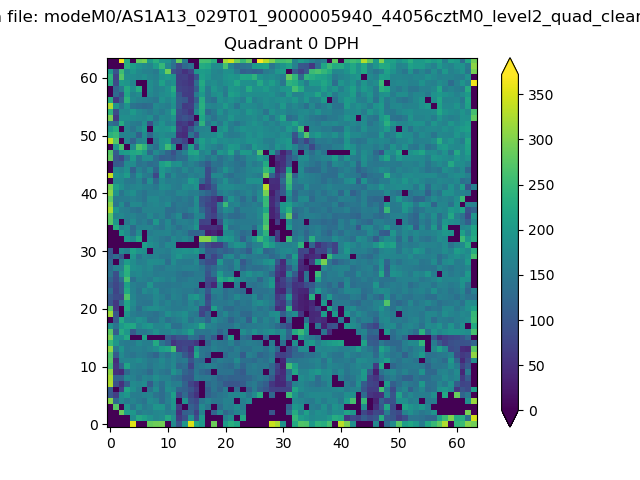 |
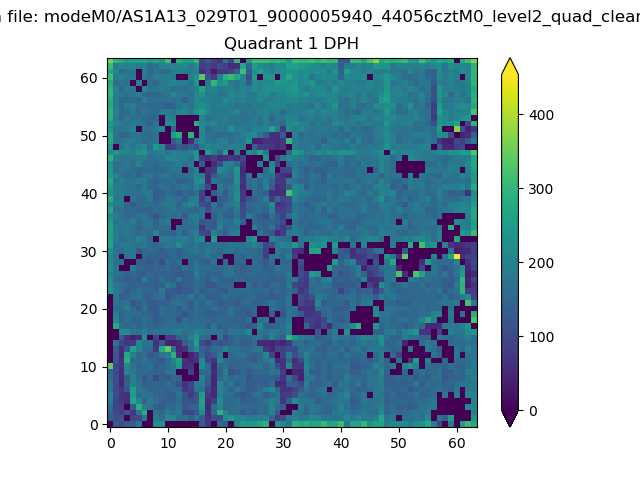 |
Quadrant B |
|---|---|---|---|
| Quadrant D | 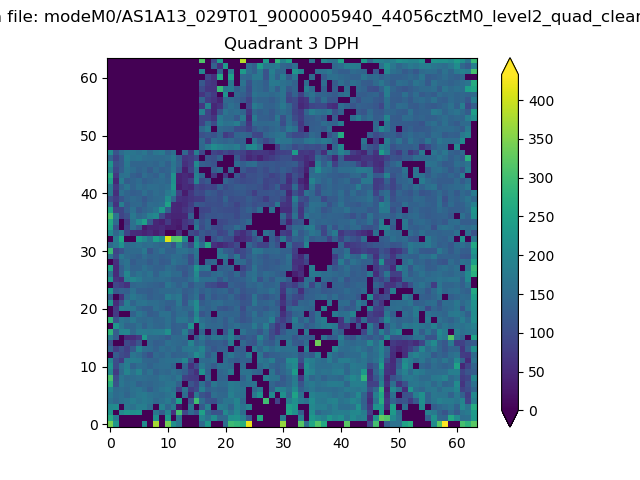 |
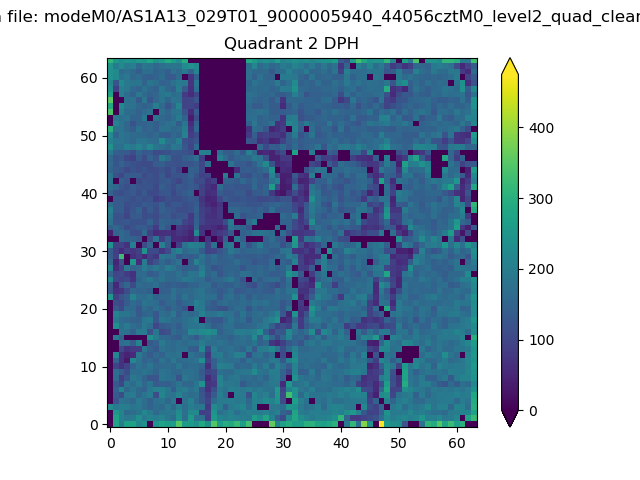 |
Quadrant C |
| Plot type | Count rate plots | Images |
|---|---|---|
| Comparison with Poisson distribution Blue bars denote a histogram of data divided into 1 sec bins. Red curve is a Poisson curve with rate = median count rate of data. |
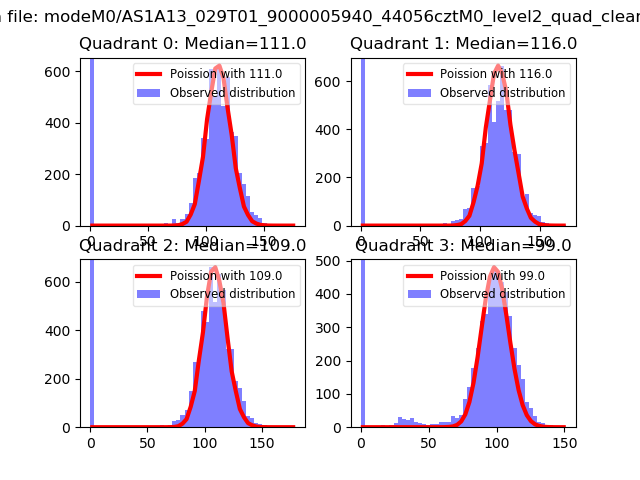 |
 |
| Quadrant-wise count rates Data is divided into 100 sec bins |
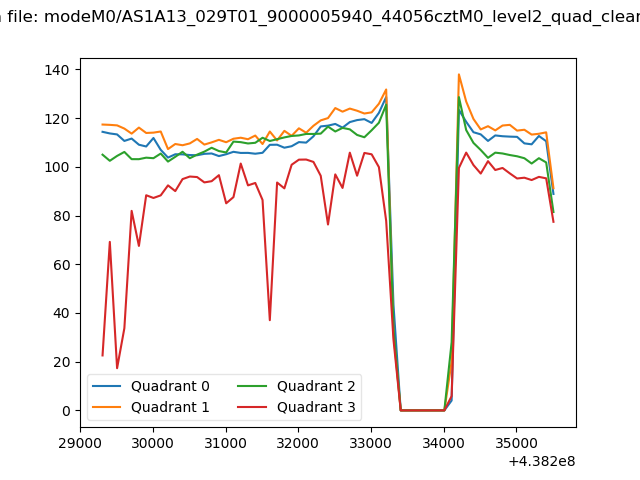 |
|
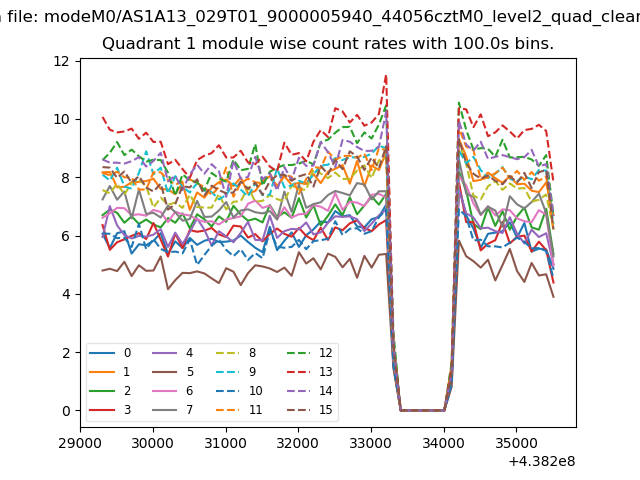
| Module-wise count rates for Quadrant A Data is divided into 100 sec bins |
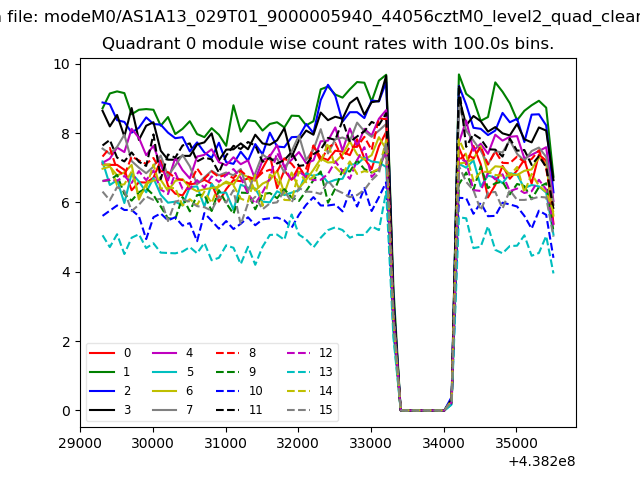 |
 |
| Module-wise count rates for Quadrant B Data is divided into 100 sec bins |
 |
 |
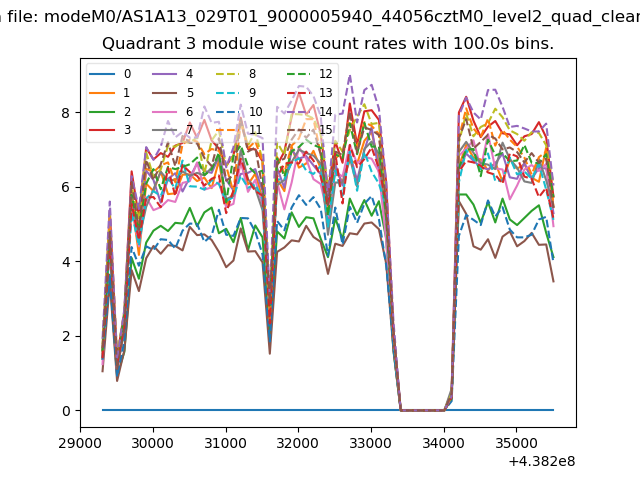
| Module-wise count rates for Quadrant C Data is divided into 100 sec bins |
 |
 |
| Module-wise count rates for Quadrant D Data is divided into 100 sec bins |
 |
 |
| Parameter | Plot |
|---|---|
| CZT HV Monitor | 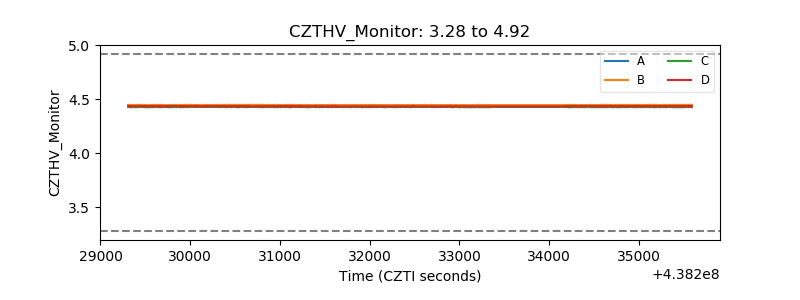 |
| D_VDD | 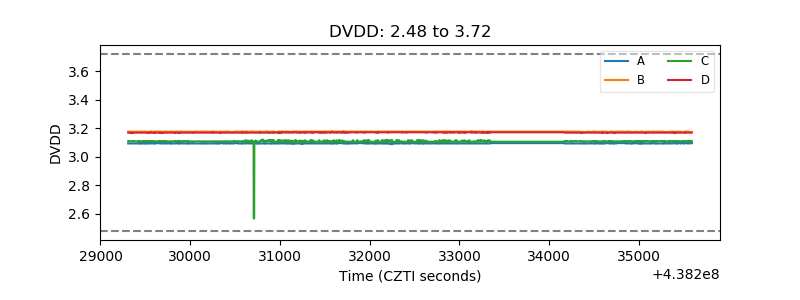 |
| Temperature 1 | 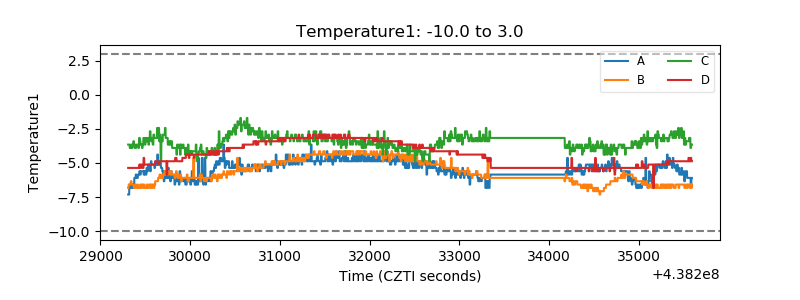 |
| Veto HV Monitor | 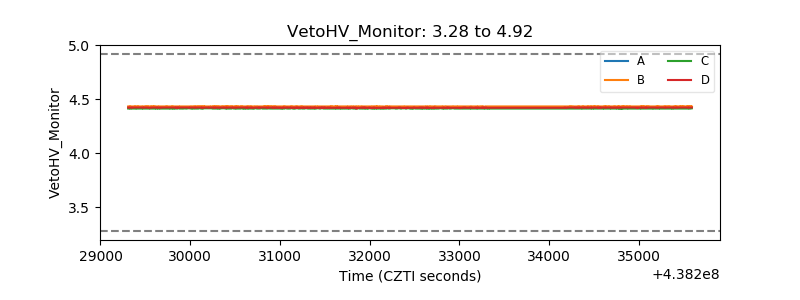 |
| Veto LLD | 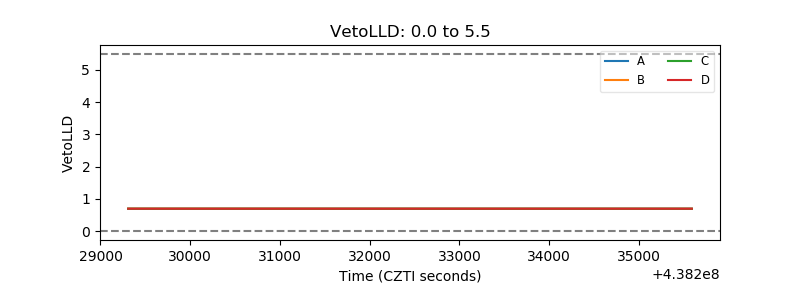 |
| Alpha Counter | 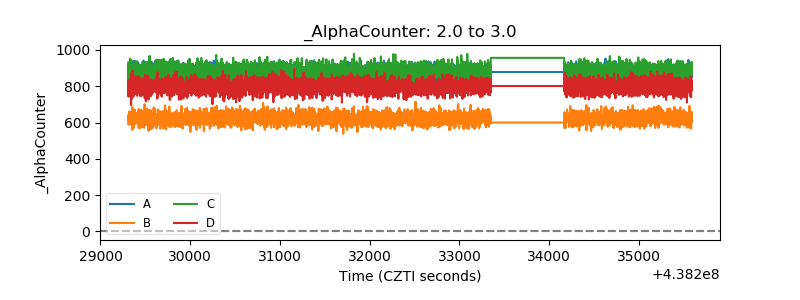 |
| _CPM_Rate | 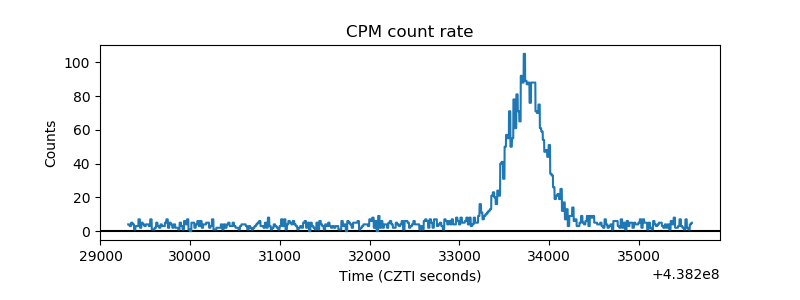 |
| CZT Counter | 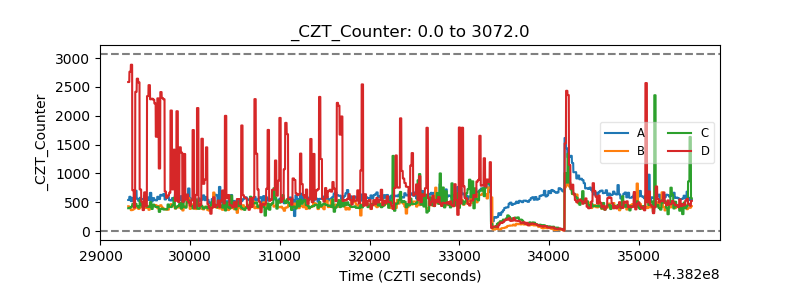 |
| +2.5 Volts monitor | 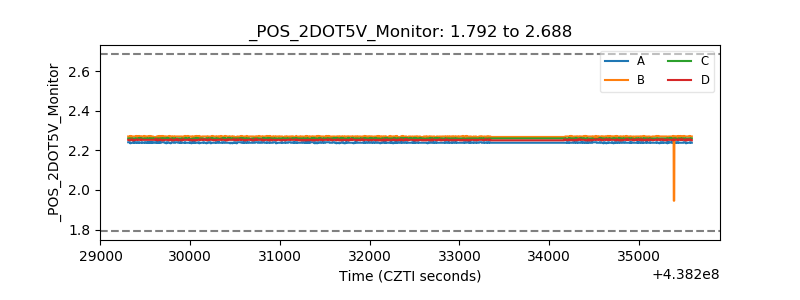 |
| +5 Volts monitor | 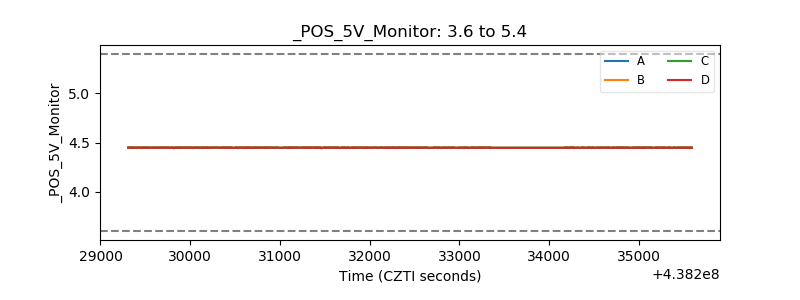 |
| _ROLL_ROT | 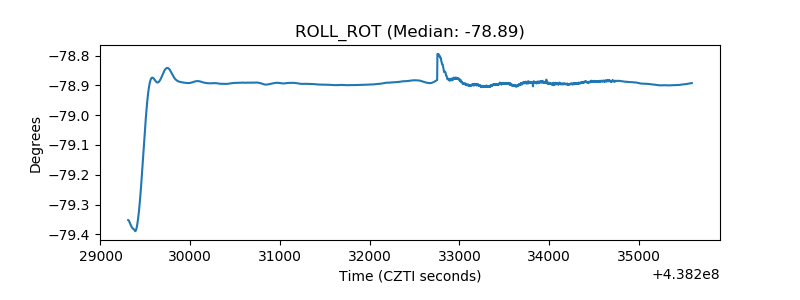 |
| _Roll_DEC | 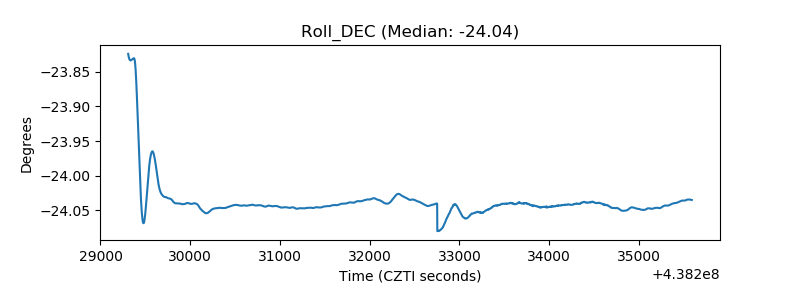 |
| _Roll_RA | 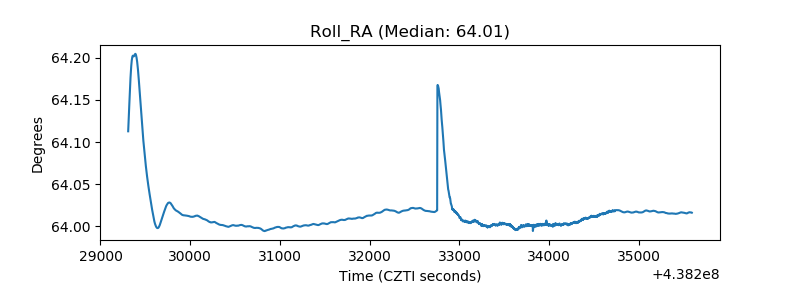 |
| Veto Counter | 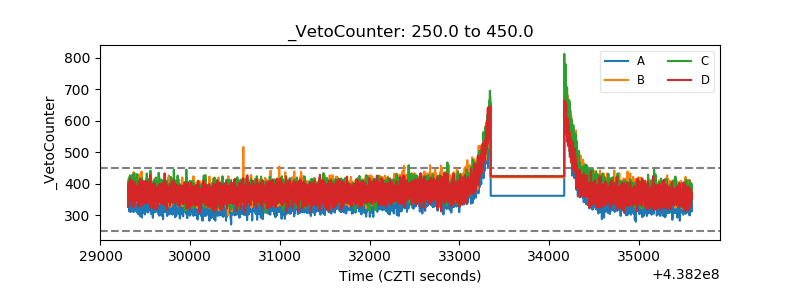 |