| Param | Original file | Final file |
|---|---|---|
| Filename | modeM0/AS1A13_029T01_9000005940_44058cztM0_level2.fits | modeM0/AS1A13_029T01_9000005940_44058cztM0_level2_quad_clean.evt |
| Size (bytes) | 510,563,520 | 128,102,400 |
| Size | 486.9 MB | 122.2 MB |
| Events in quadrant A | 5,003,994 | 862,608 |
| Events in quadrant B | 3,761,550 | 896,834 |
| Events in quadrant C | 4,803,594 | 819,410 |
| Events in quadrant D | 4,709,954 | 745,240 |
| Mode SS | |||
|---|---|---|---|
| Quadrant | BADHDUFLAG | Total packets | Discarded packets |
| A | 0 | 160 | 0 |
| B | 0 | 160 | 0 |
| C | 0 | 160 | 0 |
| D | 0 | 160 | 0 |
| Mode M0 | |||
|---|---|---|---|
| Quadrant | BADHDUFLAG | Total packets | Discarded packets |
| A | 0 | 20060 | 1 |
| B | 0 | 16770 | 1 |
| C | 0 | 19821 | 1 |
| D | 0 | 19748 | 1 |
| Mode M9 | |||
|---|---|---|---|
| Quadrant | BADHDUFLAG | Total packets | Discarded packets |
| A | 1 | 139955969009704 | 139955804307502 |
| B | 1 | -1 | -1 |
| C | 1 | -1 | -1 |
| D | 1 | -1 | -1 |
| Quadrant | Total seconds | Saturated seconds | Saturation percentage |
|---|---|---|---|
| A | 7983 | 168 | 2.104472% |
| B | 7983 | 171 | 2.142052% |
| C | 7983 | 378 | 4.735062% |
| D | 7983 | 411 | 5.148440% |
Noise dominated data is calculated using 1-second bins in cleaned event files. If a bin has >2000 counts, and if more than 50% of those come from <1% of pixels, then it is considered to be noise-dominated and hence unusable.
| Quadrant | # 1 sec bins | Bins with >0 counts | Bins with >2000 counts | High rate bins dominated by noise | Noise dominated (total time) | Noise dominated (detector-on time) | Marked lightcurve |
|---|---|---|---|---|---|---|---|
| A | 7983 | 7983 | 5 | 5 | 0.06% | 0.06% | 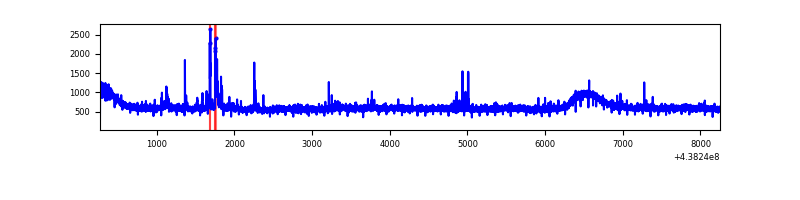 |
| B | 7983 | 7983 | 1 | 1 | 0.01% | 0.01% | 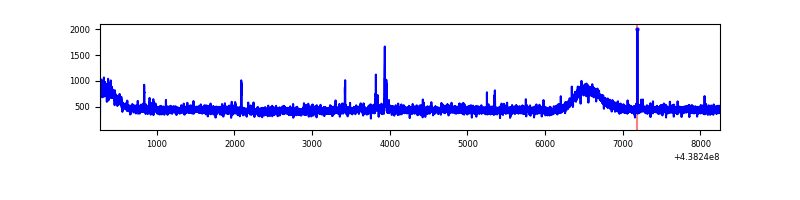 |
| C | 7983 | 7983 | 183 | 183 | 2.29% | 2.29% | 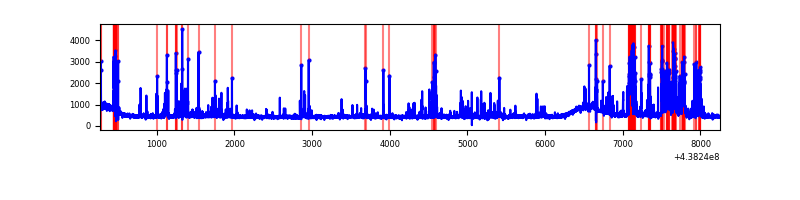 |
| D | 7983 | 7983 | 265 | 265 | 3.32% | 3.32% | 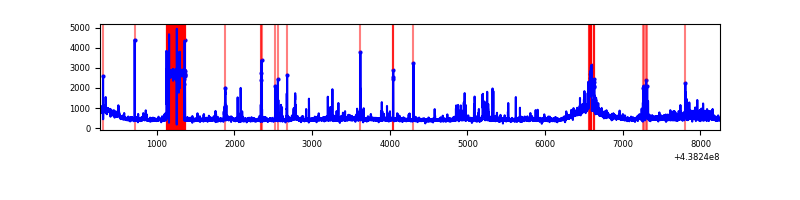 |
Top three noisy pixels from each quadrant. If the there are fewer than three noisy pixels in the level2.evt file, extra rows are filled as -1
| Pixel properties | Quadrant properties | ||||||
|---|---|---|---|---|---|---|---|
| Quadrant | DetID | PixID | Counts | Sigma | Mean | Median | Sigma |
| A | 10 | 83 | 1169007 | 5911.07 | 944 | 924 | 197.6 |
| A | 14 | 238 | 107380 | 538.72 | 944 | 924 | 197.6 |
| A | 13 | 6 | 42117 | 208.46 | 944 | 924 | 197.6 |
| B | 12 | 111 | 24912 | 126.65 | 941 | 911 | 189.5 |
| B | 4 | 171 | 24035 | 122.02 | 941 | 911 | 189.5 |
| B | 14 | 111 | 22974 | 116.42 | 941 | 911 | 189.5 |
| C | 14 | 254 | 1049546 | 4751.57 | 920 | 926 | 220.7 |
| C | 3 | 233 | 108216 | 486.16 | 920 | 926 | 220.7 |
| C | 14 | 96 | 26521 | 115.98 | 920 | 926 | 220.7 |
| D | 13 | 249 | 664597 | 2903.8 | 906 | 878 | 228.6 |
| D | 5 | 222 | 218872 | 953.73 | 906 | 878 | 228.6 |
| D | 1 | 52 | 188060 | 818.93 | 906 | 878 | 228.6 |
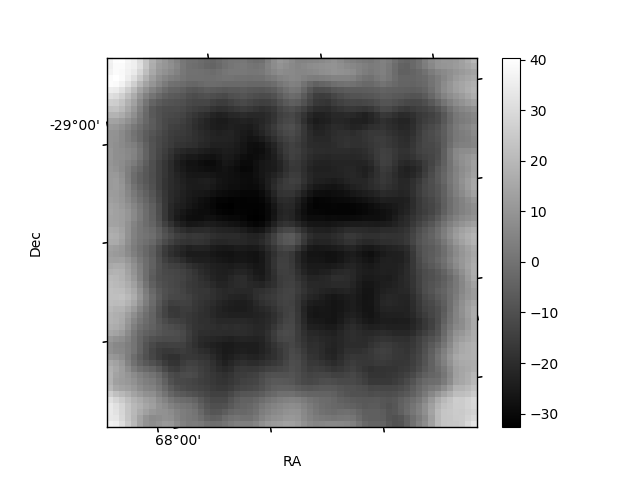
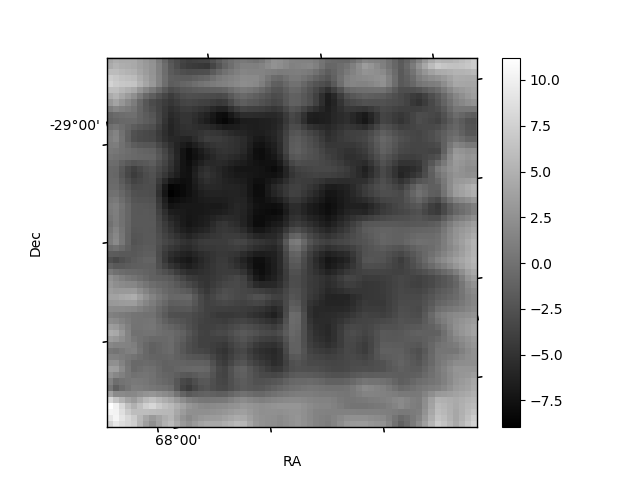
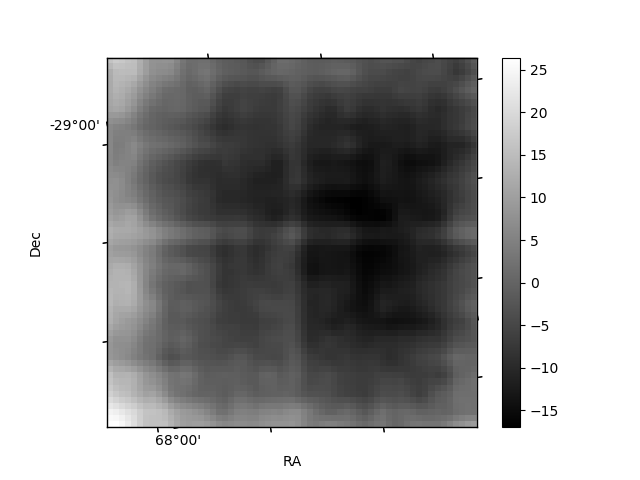
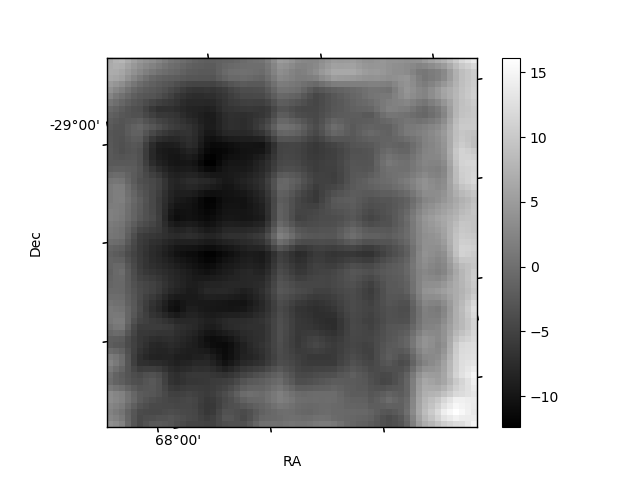
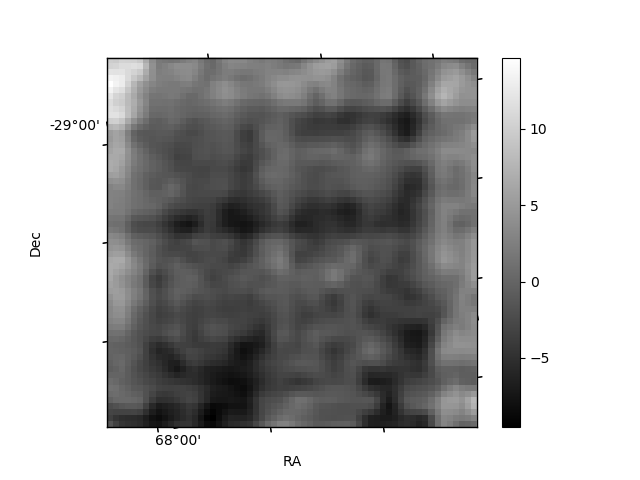
Histogram calculated using DETX and DETY for each event in the final _common_clean file
| Quadrant A | 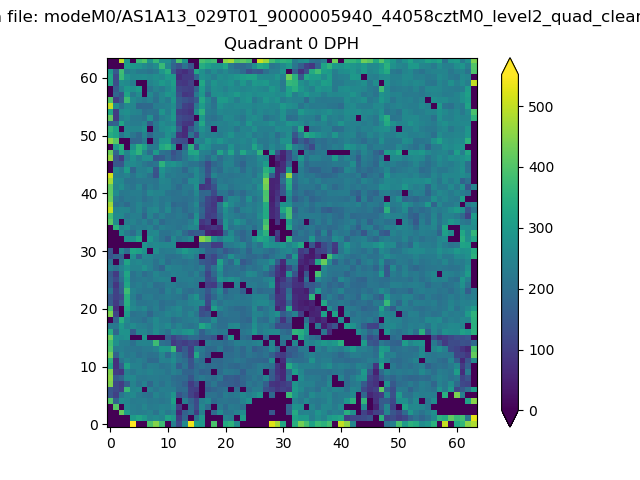 |
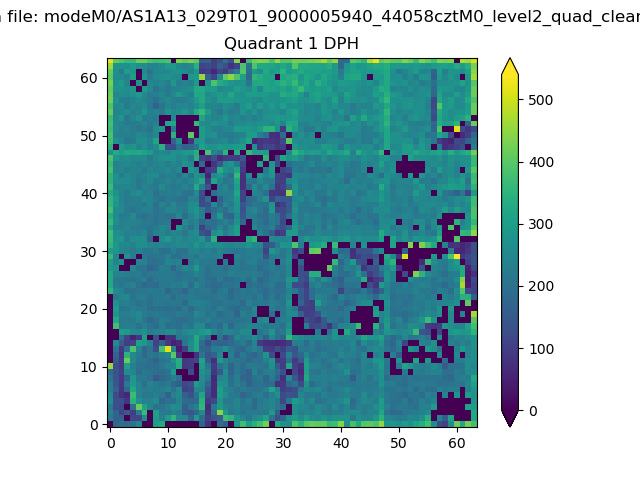 |
Quadrant B |
|---|---|---|---|
| Quadrant D | 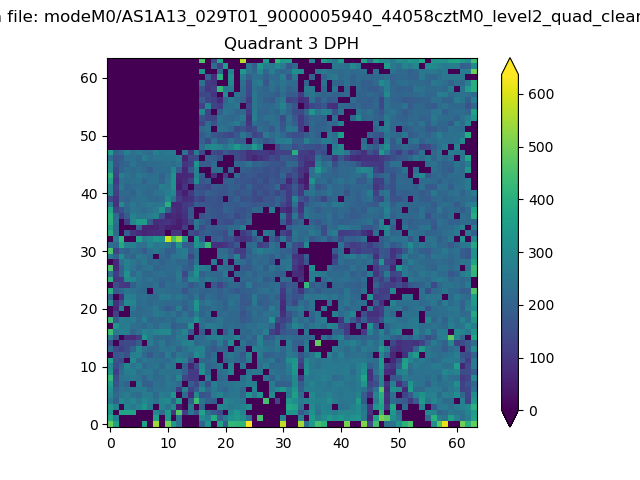 |
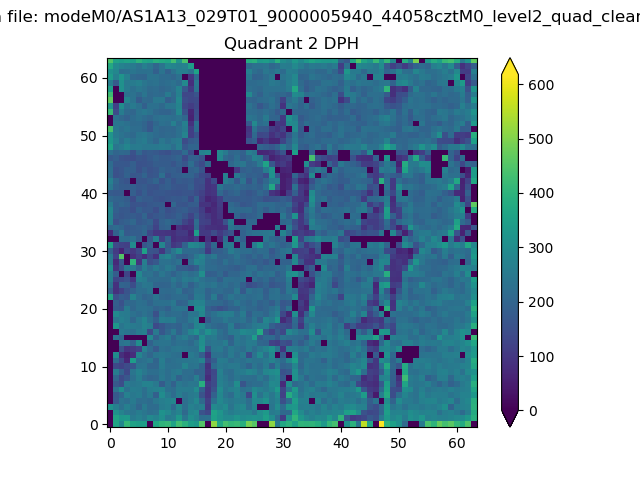 |
Quadrant C |
| Plot type | Count rate plots | Images |
|---|---|---|
| Comparison with Poisson distribution Blue bars denote a histogram of data divided into 1 sec bins. Red curve is a Poisson curve with rate = median count rate of data. |
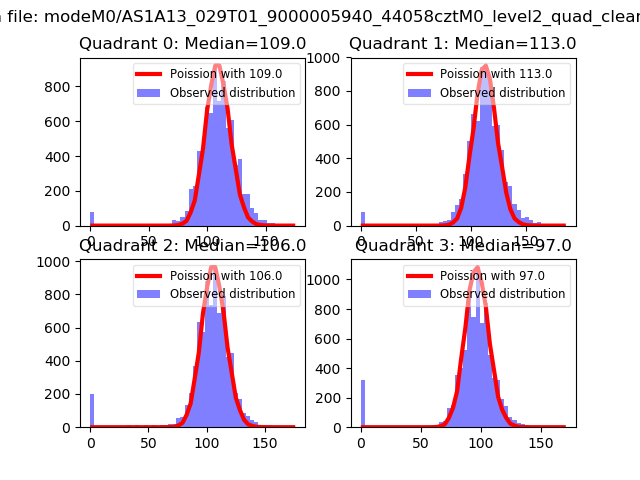 |
 |
| Quadrant-wise count rates Data is divided into 100 sec bins |
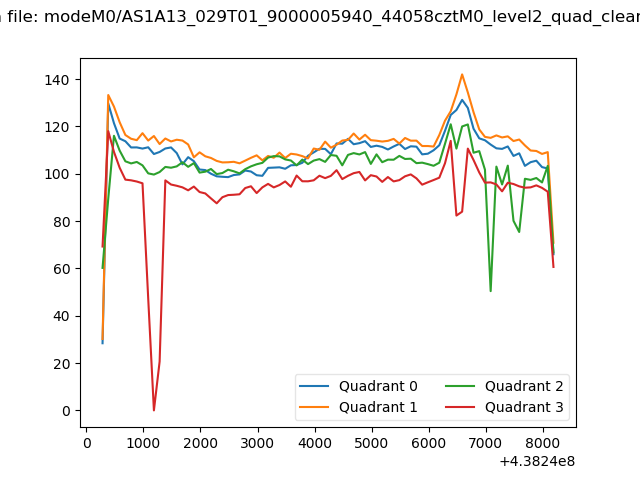 |
|
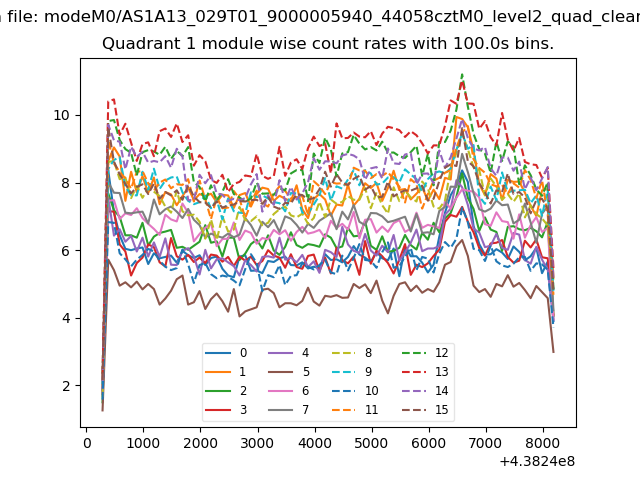
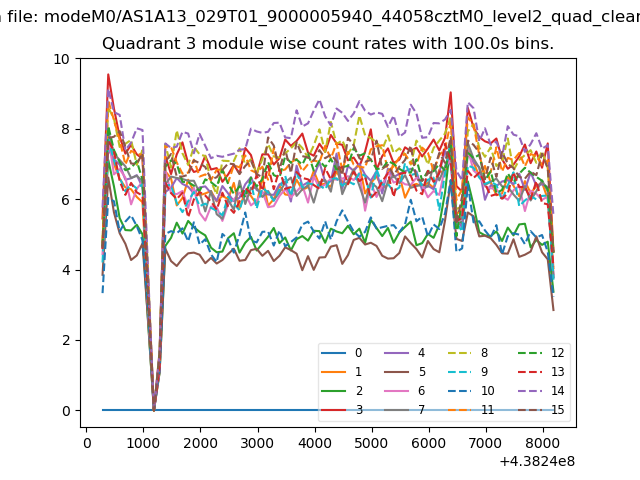
| Module-wise count rates for Quadrant A Data is divided into 100 sec bins |
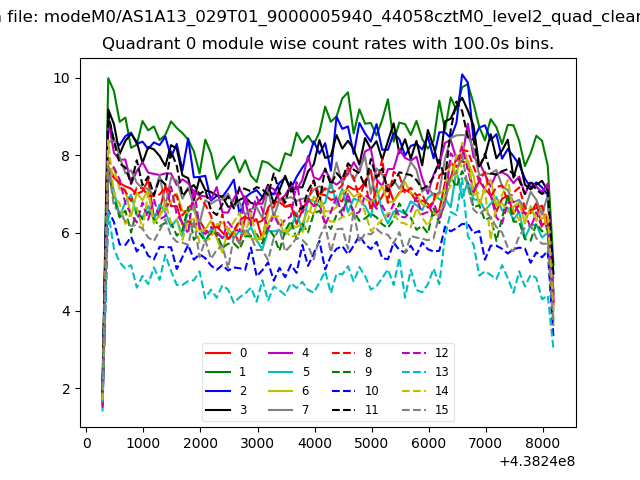 |
 |
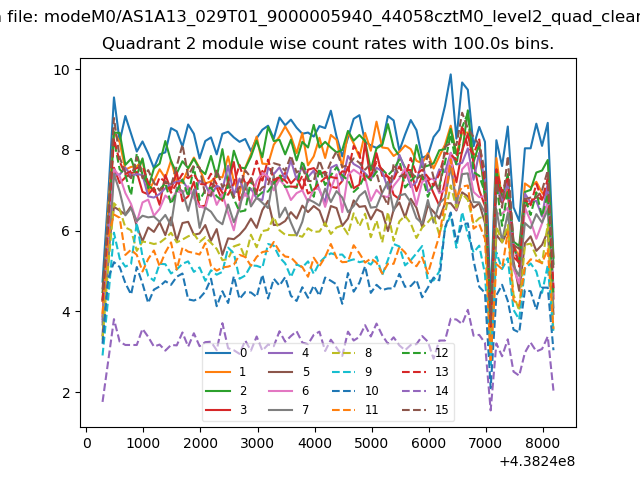
| Module-wise count rates for Quadrant B Data is divided into 100 sec bins |
 |
 |
| Module-wise count rates for Quadrant C Data is divided into 100 sec bins |
 |
 |
| Module-wise count rates for Quadrant D Data is divided into 100 sec bins |
 |
 |
| Parameter | Plot |
|---|---|
| CZT HV Monitor |  |
| D_VDD | 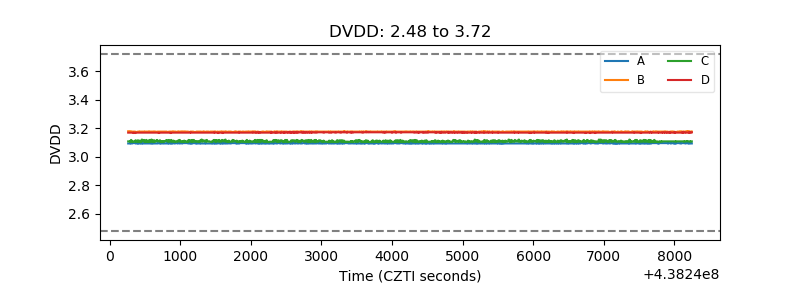 |
| Temperature 1 | 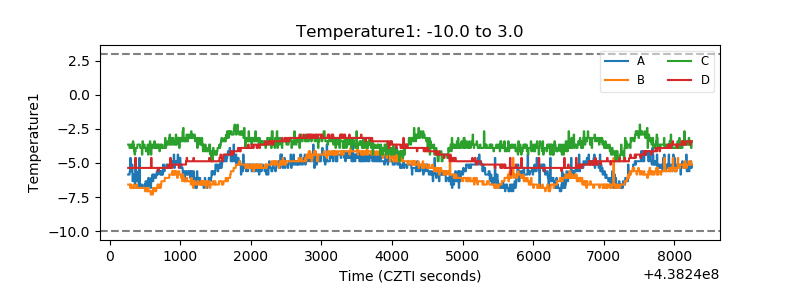 |
| Veto HV Monitor | 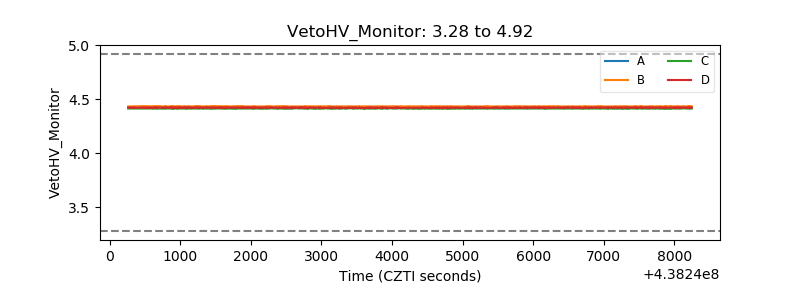 |
| Veto LLD | 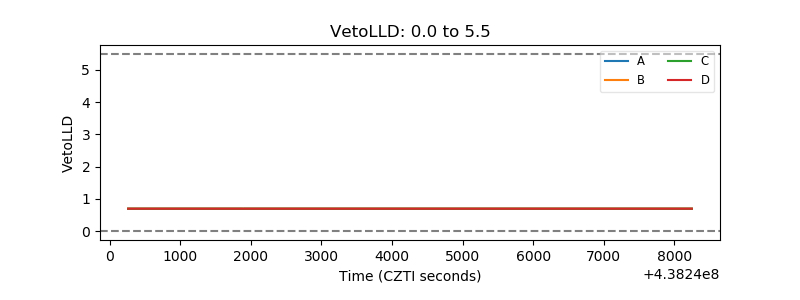 |
| Alpha Counter | 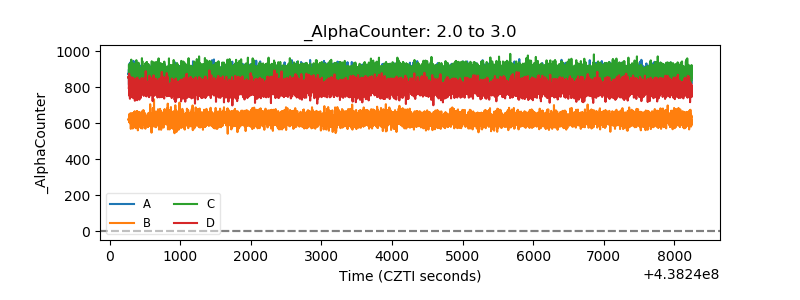 |
| _CPM_Rate | 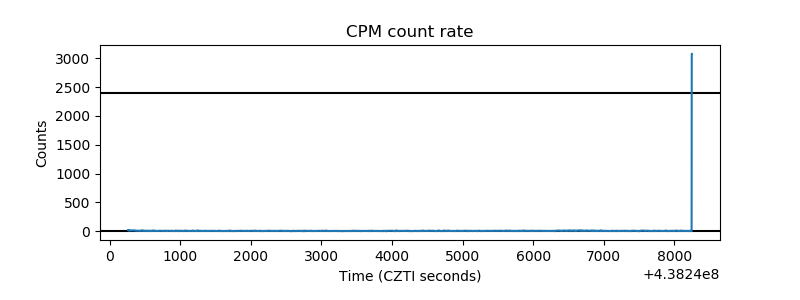 |
| CZT Counter | 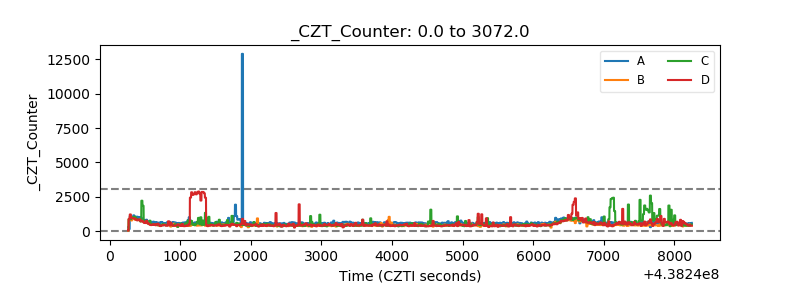 |
| +2.5 Volts monitor | 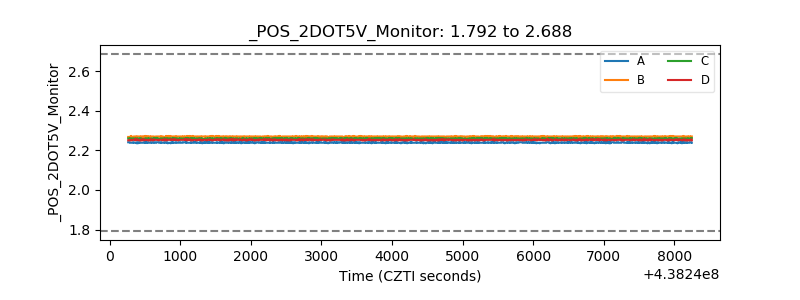 |
| +5 Volts monitor | 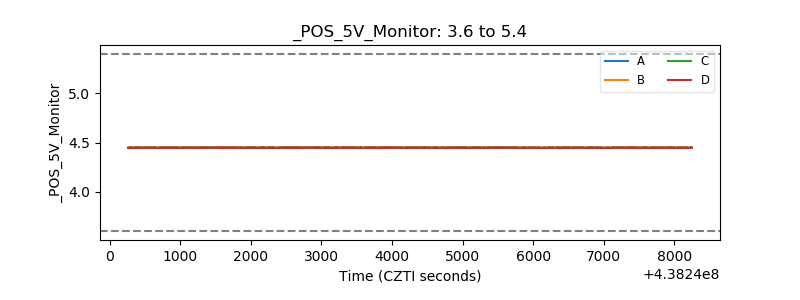 |
| _ROLL_ROT | 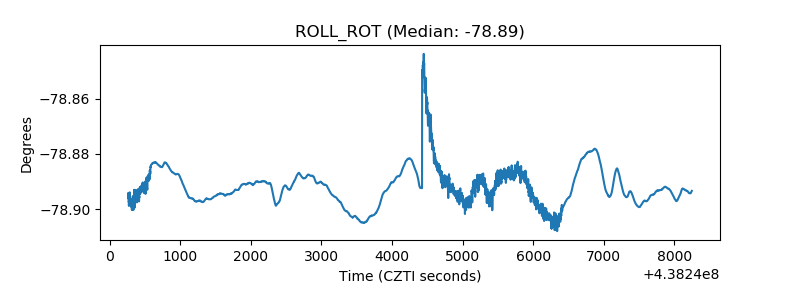 |
| _Roll_DEC | 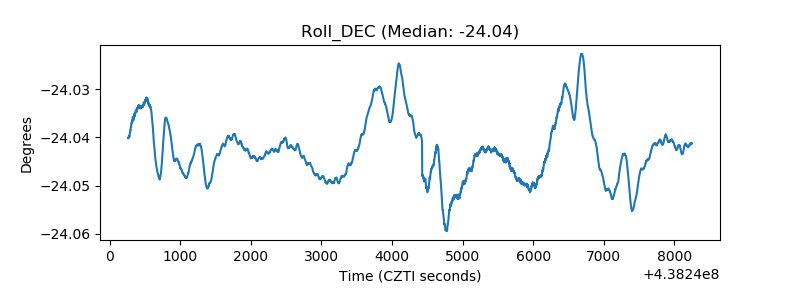 |
| _Roll_RA | 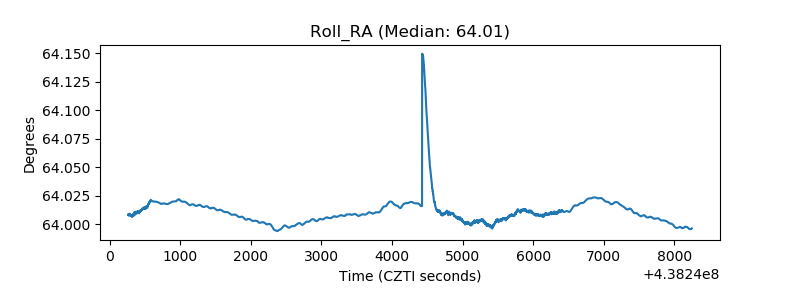 |
| Veto Counter | 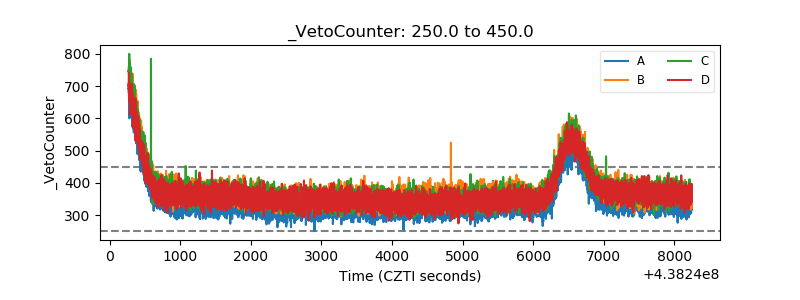 |