| Param | Original file | Final file |
|---|---|---|
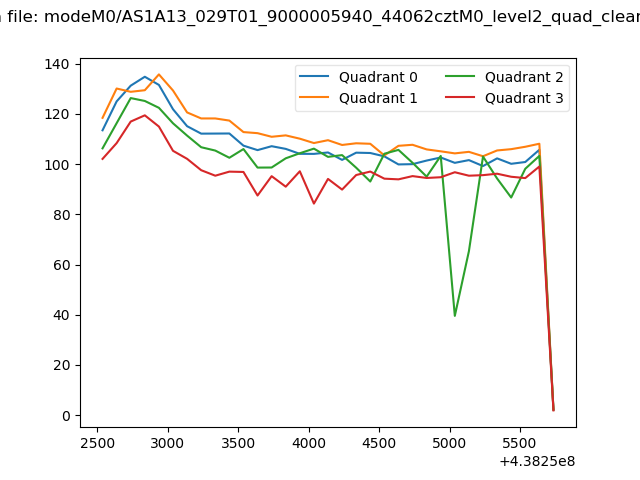
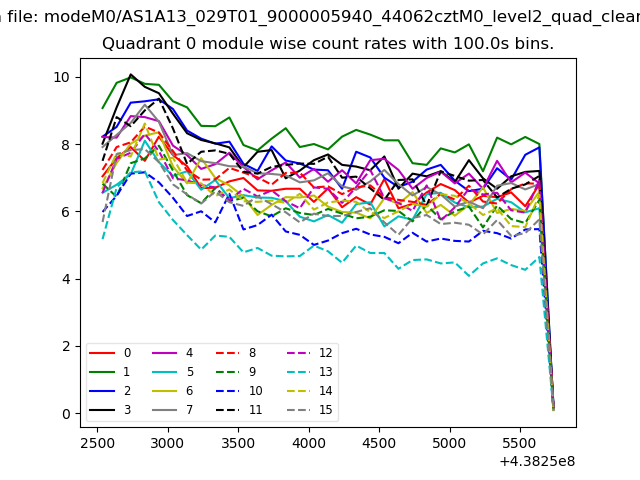
| Filename | modeM0/AS1A13_029T01_9000005940_44062cztM0_level2.fits | modeM0/AS1A13_029T01_9000005940_44062cztM0_level2_quad_clean.evt |
| Size (bytes) | 237,602,880 | 52,044,480 |
| Size | 226.6 MB | 49.6 MB |
| Events in quadrant A | 1,988,738 | 347,839 |
| Events in quadrant B | 1,571,451 | 361,575 |
| Events in quadrant C | 2,690,136 | 325,380 |
| Events in quadrant D | 2,294,254 | 313,454 |
| Mode SS | |||
|---|---|---|---|
| Quadrant | BADHDUFLAG | Total packets | Discarded packets |
| A | 0 | 64 | 0 |
| B | 0 | 64 | 0 |
| C | 0 | 64 | 0 |
| D | 0 | 64 | 0 |
| Mode M0 | |||
|---|---|---|---|
| Quadrant | BADHDUFLAG | Total packets | Discarded packets |
| A | 0 | 7856 | 0 |
| B | 0 | 6896 | 0 |
| C | 0 | 10122 | 0 |
| D | 0 | 9001 | 0 |
| Quadrant | Total seconds | Saturated seconds | Saturation percentage |
|---|---|---|---|
| A | 3205 | 33 | 1.029641% |
| B | 3206 | 67 | 2.089832% |
| C | 3205 | 277 | 8.642746% |
| D | 3205 | 77 | 2.402496% |
Noise dominated data is calculated using 1-second bins in cleaned event files. If a bin has >2000 counts, and if more than 50% of those come from <1% of pixels, then it is considered to be noise-dominated and hence unusable.
| Quadrant | # 1 sec bins | Bins with >0 counts | Bins with >2000 counts | High rate bins dominated by noise | Noise dominated (total time) | Noise dominated (detector-on time) | Marked lightcurve |
|---|---|---|---|---|---|---|---|
| A | 3205 | 3205 | 0 | 0 | 0.00% | 0.00% |  |
| B | 3206 | 3206 | 1 | 1 | 0.03% | 0.03% | 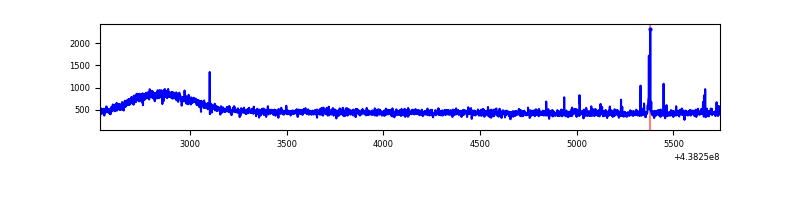 |
| C | 3205 | 3205 | 201 | 201 | 6.27% | 6.27% | 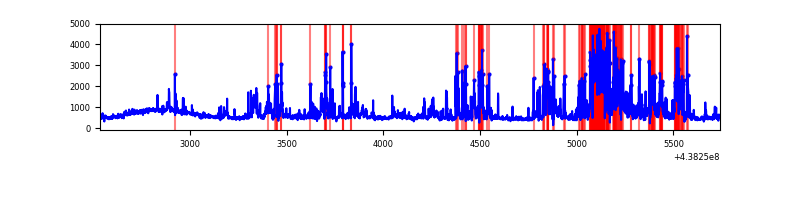 |
| D | 3205 | 3205 | 57 | 57 | 1.78% | 1.78% | 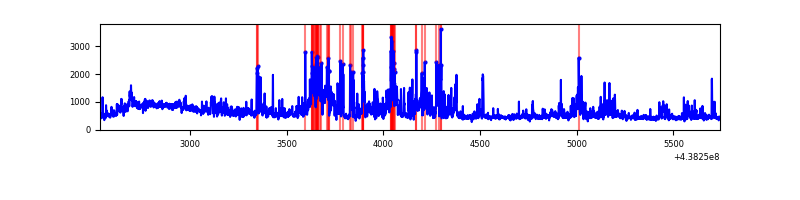 |
Top three noisy pixels from each quadrant. If the there are fewer than three noisy pixels in the level2.evt file, extra rows are filled as -1
| Pixel properties | Quadrant properties | ||||||
|---|---|---|---|---|---|---|---|
| Quadrant | DetID | PixID | Counts | Sigma | Mean | Median | Sigma |
| A | 10 | 83 | 452590 | 5393.36 | 396 | 388 | 83.8 |
| A | 3 | 137 | 4881 | 53.59 | 396 | 388 | 83.8 |
| A | 2 | 79 | 3616 | 38.5 | 396 | 388 | 83.8 |
| B | 4 | 158 | 14496 | 172.73 | 393 | 380 | 81.7 |
| B | 12 | 111 | 10617 | 125.26 | 393 | 380 | 81.7 |
| B | 11 | 111 | 9933 | 116.89 | 393 | 380 | 81.7 |
| C | 1 | 241 | 876349 | 9542.95 | 382 | 383 | 91.8 |
| C | 14 | 254 | 229199 | 2492.77 | 382 | 383 | 91.8 |
| C | 15 | 158 | 36284 | 391.11 | 382 | 383 | 91.8 |
| D | 1 | 52 | 399021 | 3971.81 | 393 | 380 | 100.4 |
| D | 5 | 222 | 265365 | 2640.15 | 393 | 380 | 100.4 |
| D | 4 | 222 | 76352 | 756.94 | 393 | 380 | 100.4 |
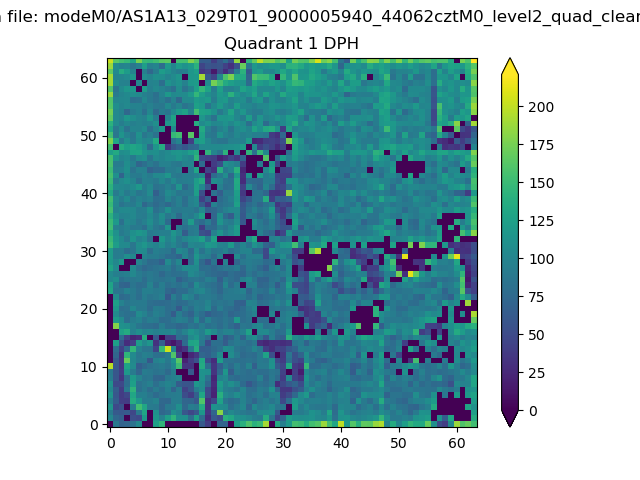
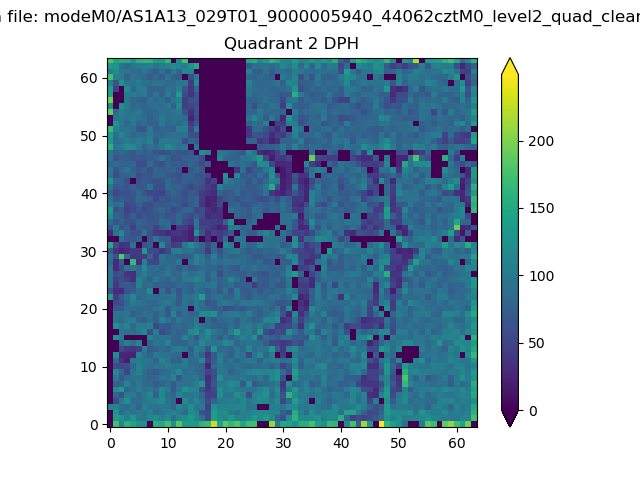
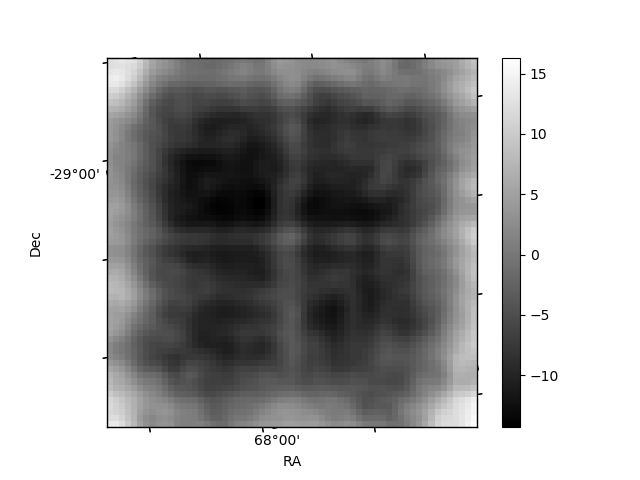
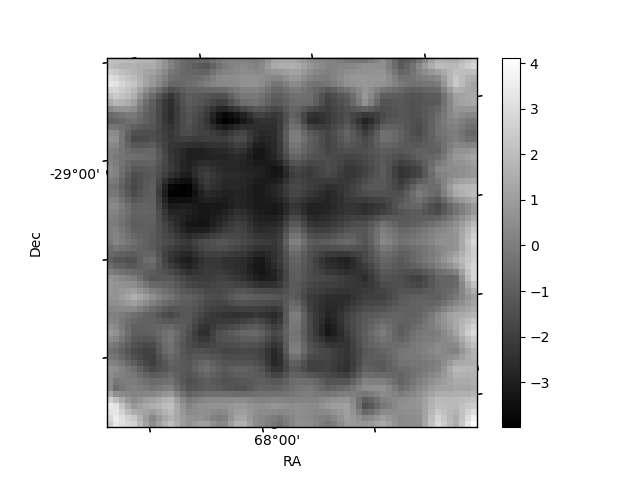
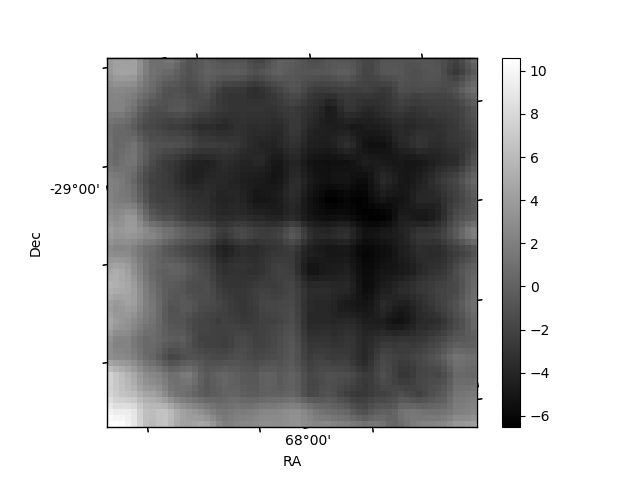
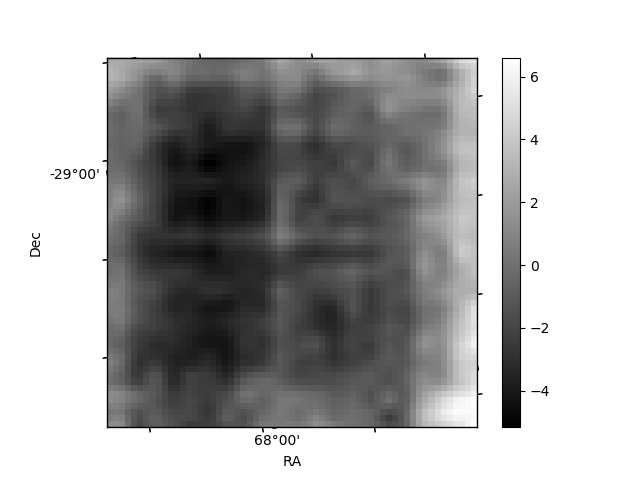
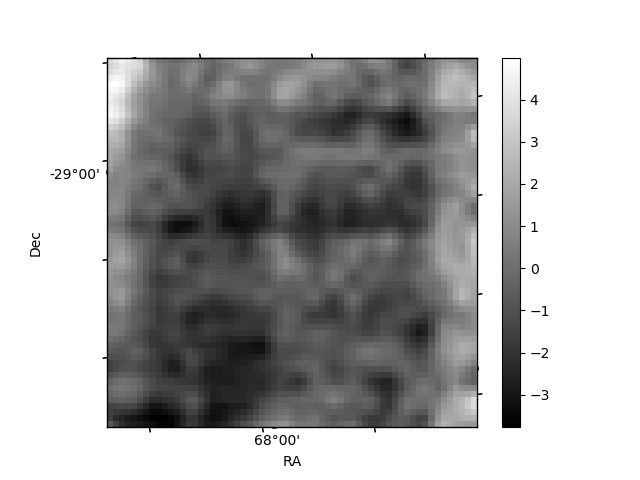
Histogram calculated using DETX and DETY for each event in the final _common_clean file
| Quadrant A | 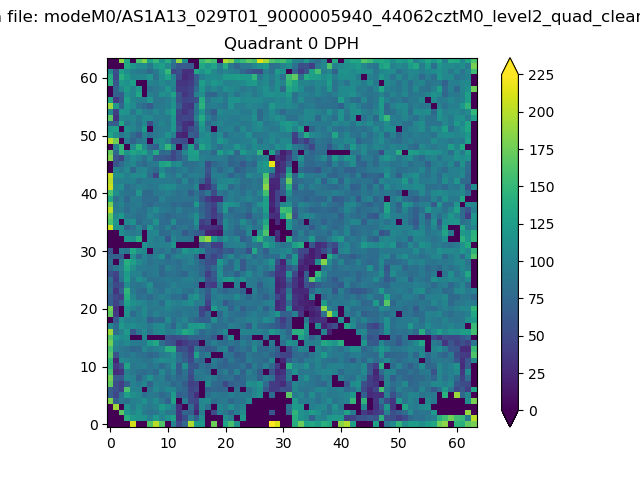 |
 |
Quadrant B |
|---|---|---|---|
| Quadrant D | 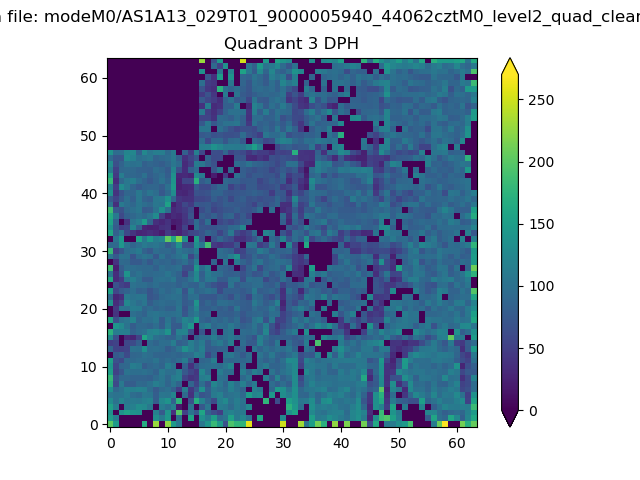 |
 |
Quadrant C |
| Plot type | Count rate plots | Images |
|---|---|---|
| Comparison with Poisson distribution Blue bars denote a histogram of data divided into 1 sec bins. Red curve is a Poisson curve with rate = median count rate of data. |
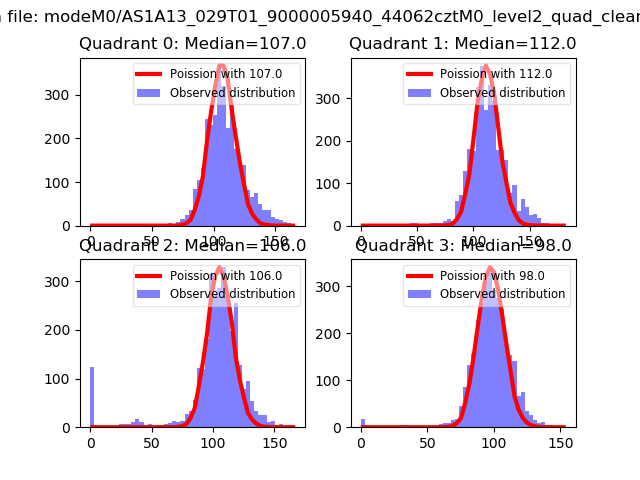 |
 |
| Quadrant-wise count rates Data is divided into 100 sec bins |
 |
|
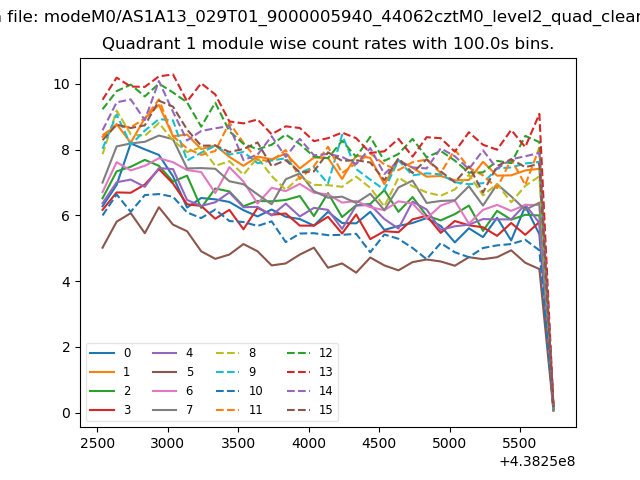
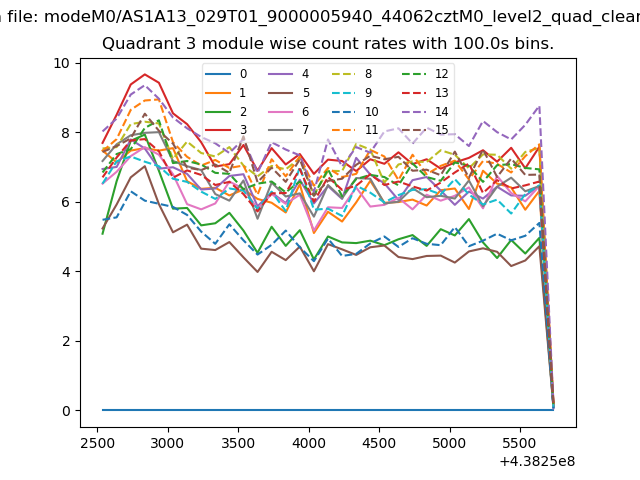
| Module-wise count rates for Quadrant A Data is divided into 100 sec bins |
 |
 |
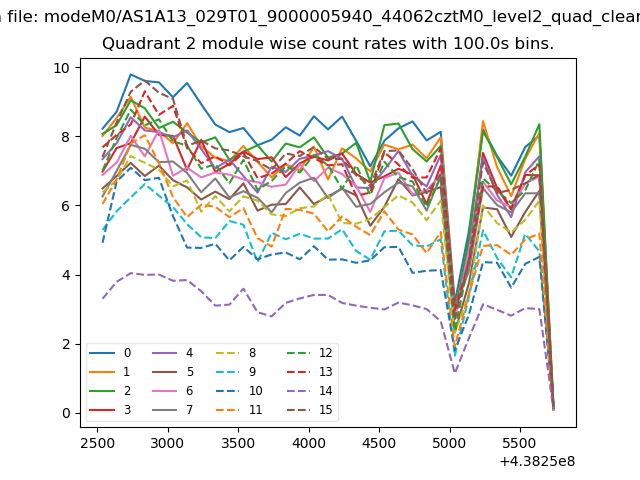
| Module-wise count rates for Quadrant B Data is divided into 100 sec bins |
 |
 |
| Module-wise count rates for Quadrant C Data is divided into 100 sec bins |
 |
 |
| Module-wise count rates for Quadrant D Data is divided into 100 sec bins |
 |
 |
| Parameter | Plot |
|---|---|
| CZT HV Monitor | 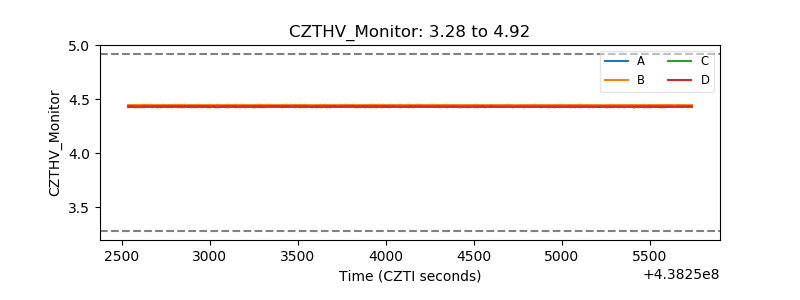 |
| D_VDD | 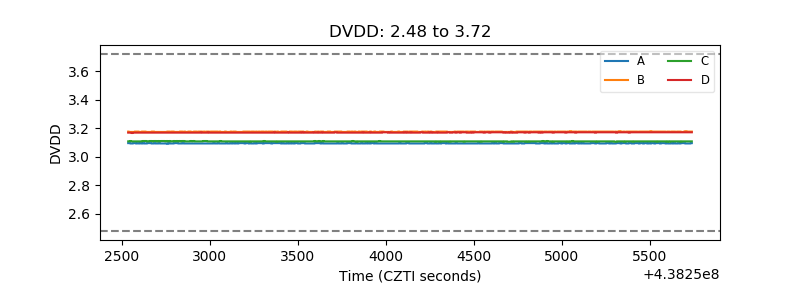 |
| Temperature 1 | 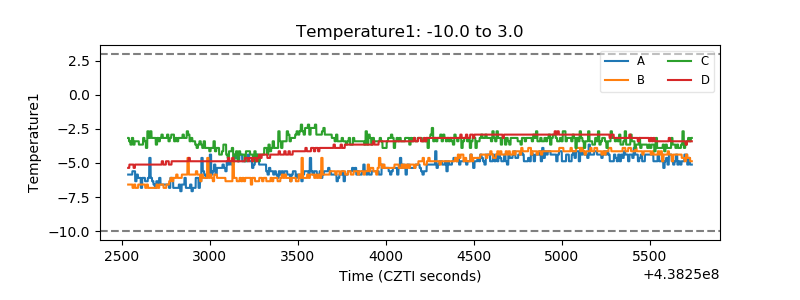 |
| Veto HV Monitor | 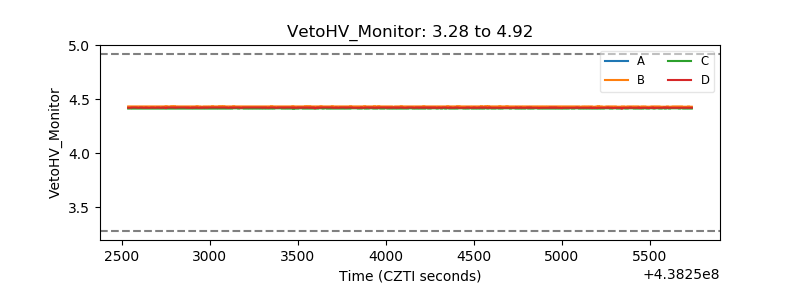 |
| Veto LLD | 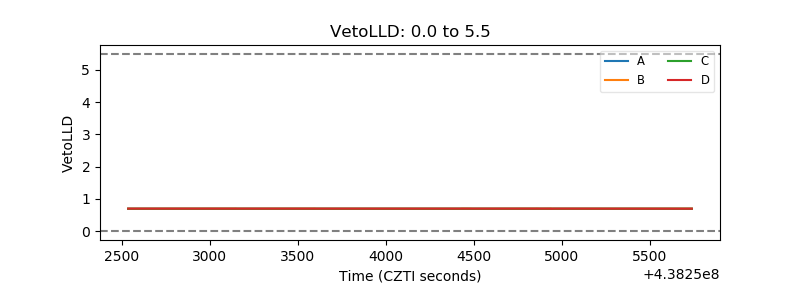 |
| Alpha Counter | 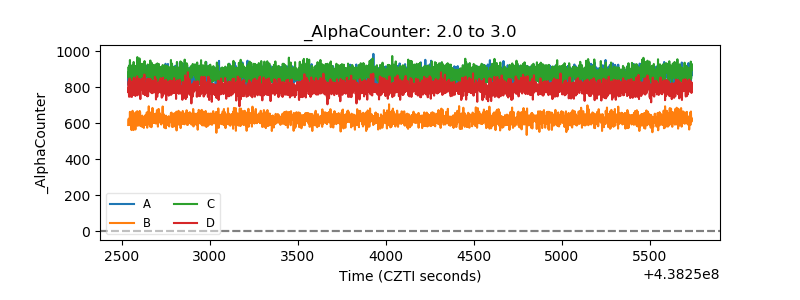 |
| _CPM_Rate | 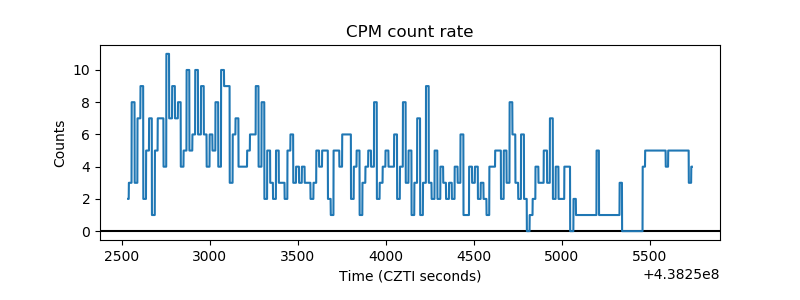 |
| CZT Counter | 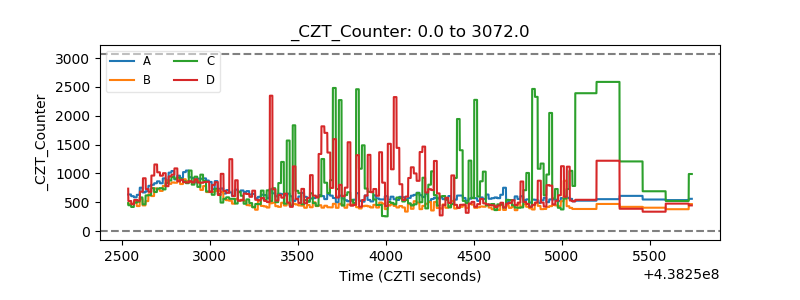 |
| +2.5 Volts monitor | 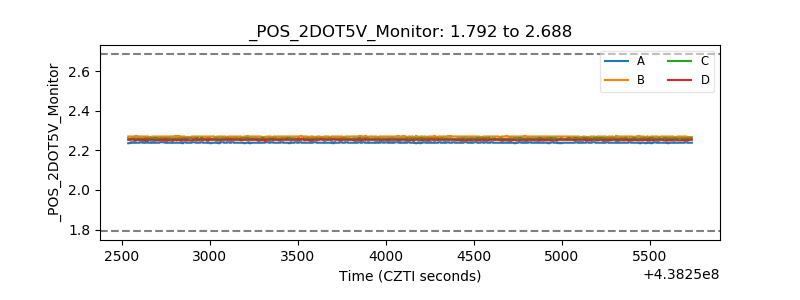 |
| +5 Volts monitor | 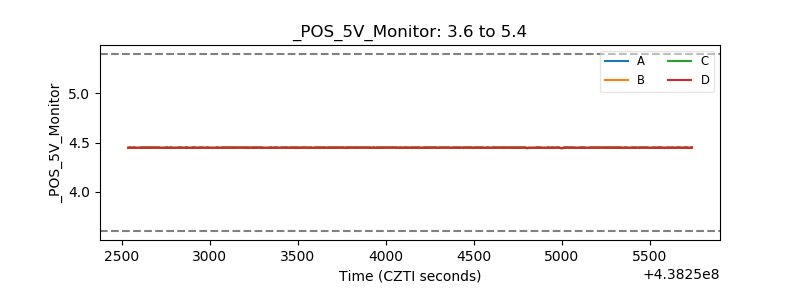 |
| _ROLL_ROT | 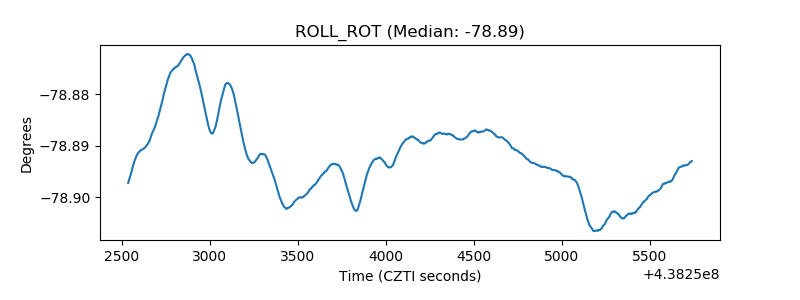 |
| _Roll_DEC | 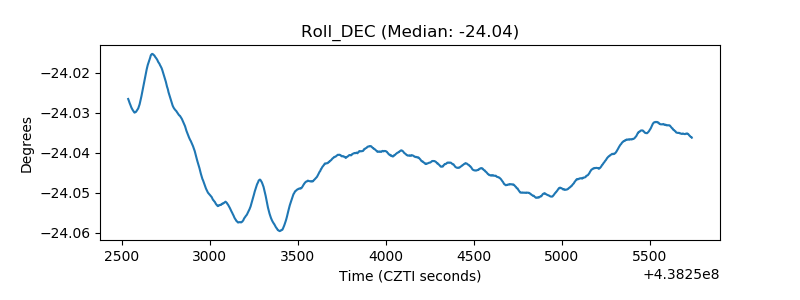 |
| _Roll_RA | 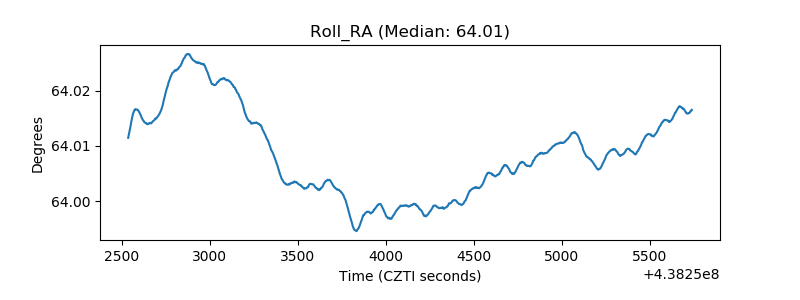 |
| Veto Counter | 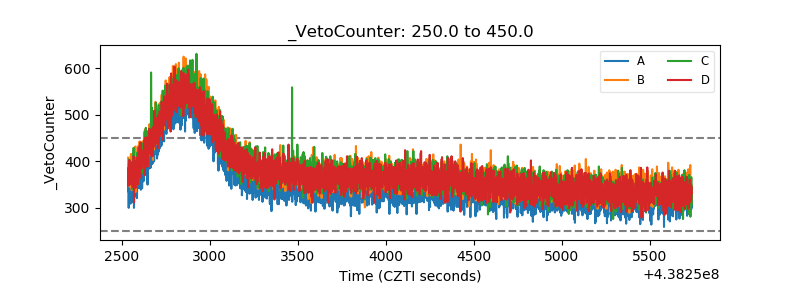 |