| Param | Original file | Final file |
|---|---|---|
| Filename | modeM0/AS1A13_029T01_9000005940_44065cztM0_level2.fits | modeM0/AS1A13_029T01_9000005940_44065cztM0_level2_quad_clean.evt |
| Size (bytes) | 1,379,664,000 | 345,640,320 |
| Size | 1.3 GB | 329.6 MB |
| Events in quadrant A | 14,513,800 | 2,308,789 |
| Events in quadrant B | 9,497,066 | 2,419,962 |
| Events in quadrant C | 11,737,486 | 2,235,944 |
| Events in quadrant D | 13,667,792 | 2,028,875 |
| Mode SS | |||
|---|---|---|---|
| Quadrant | BADHDUFLAG | Total packets | Discarded packets |
| A | 0 | 434 | 0 |
| B | 0 | 434 | 0 |
| C | 0 | 434 | 0 |
| D | 0 | 434 | 0 |
| Mode M0 | |||
|---|---|---|---|
| Quadrant | BADHDUFLAG | Total packets | Discarded packets |
| A | 0 | 57426 | 4 |
| B | 0 | 43491 | 4 |
| C | 0 | 50227 | 4 |
| D | 0 | 56045 | 7 |
| Mode M9 | |||
|---|---|---|---|
| Quadrant | BADHDUFLAG | Total packets | Discarded packets |
| A | 0 | 32 | 0 |
| B | 0 | 32 | 0 |
| C | 0 | 32 | 0 |
| D | 0 | 32 | 0 |
| Quadrant | Total seconds | Saturated seconds | Saturation percentage |
|---|---|---|---|
| A | 21381 | 558 | 2.609794% |
| B | 21381 | 195 | 0.912025% |
| C | 21381 | 533 | 2.492867% |
| D | 21380 | 1149 | 5.374181% |
Noise dominated data is calculated using 1-second bins in cleaned event files. If a bin has >2000 counts, and if more than 50% of those come from <1% of pixels, then it is considered to be noise-dominated and hence unusable.
| Quadrant | # 1 sec bins | Bins with >0 counts | Bins with >2000 counts | High rate bins dominated by noise | Noise dominated (total time) | Noise dominated (detector-on time) | Marked lightcurve |
|---|---|---|---|---|---|---|---|
| A | 24566 | 21385 | 213 | 213 | 0.87% | 1.00% | 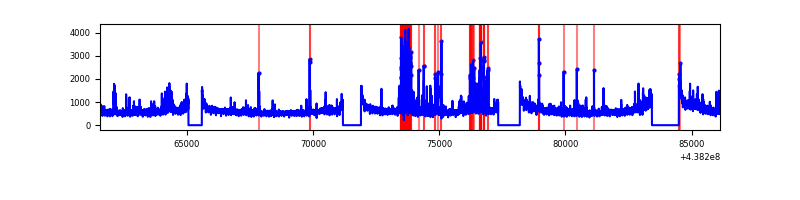 |
| B | 24566 | 21385 | 0 | 0 | 0.00% | 0.00% | 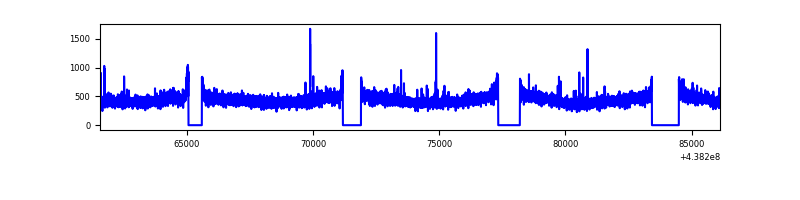 |
| C | 24566 | 21385 | 350 | 350 | 1.42% | 1.64% | 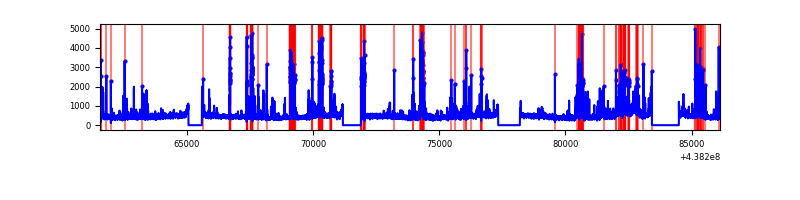 |
| D | 24565 | 21384 | 880 | 880 | 3.58% | 4.12% | 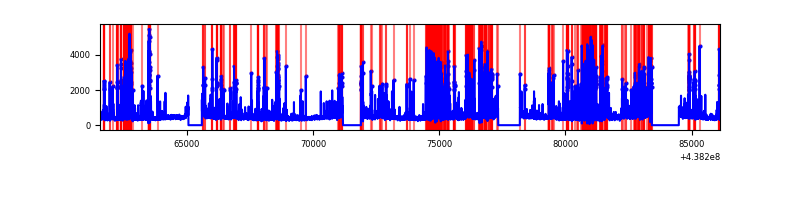 |
Top three noisy pixels from each quadrant. If the there are fewer than three noisy pixels in the level2.evt file, extra rows are filled as -1
| Pixel properties | Quadrant properties | ||||||
|---|---|---|---|---|---|---|---|
| Quadrant | DetID | PixID | Counts | Sigma | Mean | Median | Sigma |
| A | 10 | 83 | 3479732 | 7107.77 | 2390 | 2349 | 489.2 |
| A | 12 | 227 | 1228840 | 2506.95 | 2390 | 2349 | 489.2 |
| A | 15 | 222 | 348896 | 708.34 | 2390 | 2349 | 489.2 |
| B | 12 | 111 | 62569 | 127.33 | 2399 | 2320 | 473.2 |
| B | 11 | 111 | 57630 | 116.89 | 2399 | 2320 | 473.2 |
| B | 14 | 111 | 56969 | 115.5 | 2399 | 2320 | 473.2 |
| C | 1 | 241 | 2024610 | 3641.88 | 2336 | 2351 | 555.3 |
| C | 14 | 254 | 463195 | 829.93 | 2336 | 2351 | 555.3 |
| C | 14 | 96 | 61492 | 106.51 | 2336 | 2351 | 555.3 |
| D | 13 | 249 | 2353787 | 4111.25 | 2291 | 2227 | 572.0 |
| D | 1 | 52 | 805948 | 1405.15 | 2291 | 2227 | 572.0 |
| D | 5 | 235 | 531820 | 925.89 | 2291 | 2227 | 572.0 |
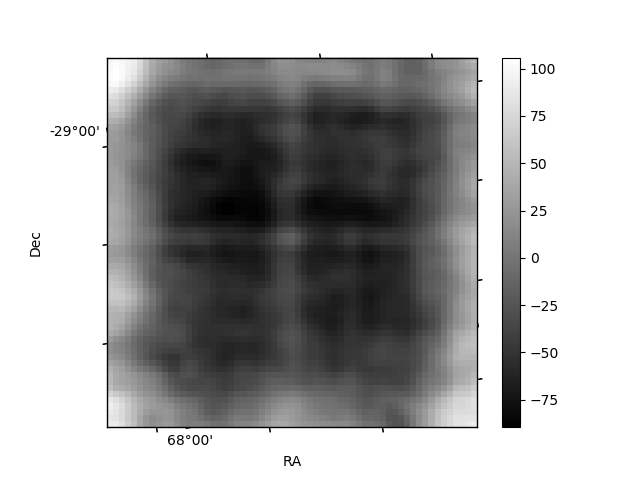
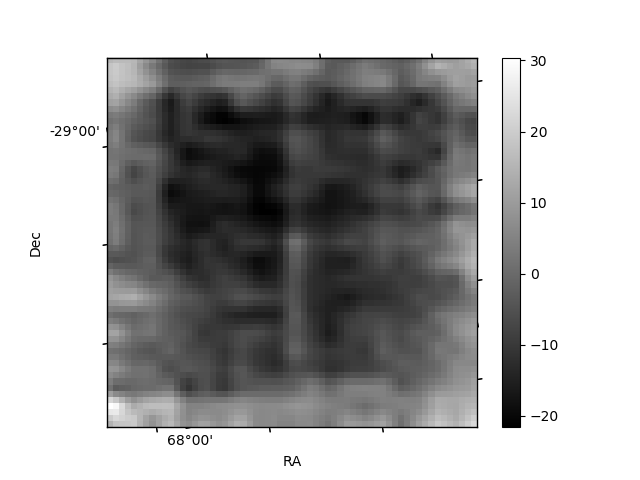
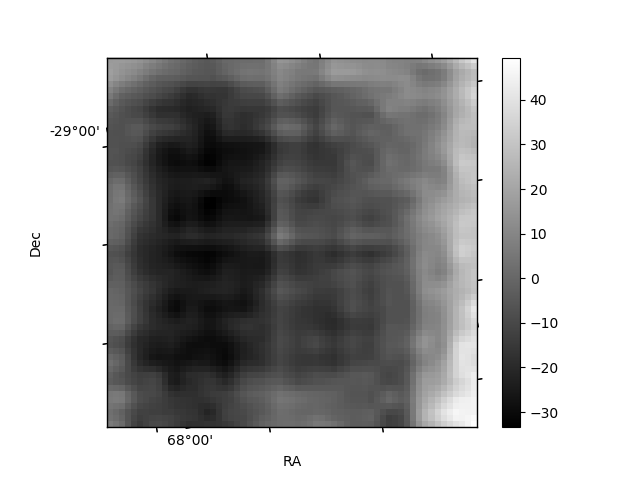
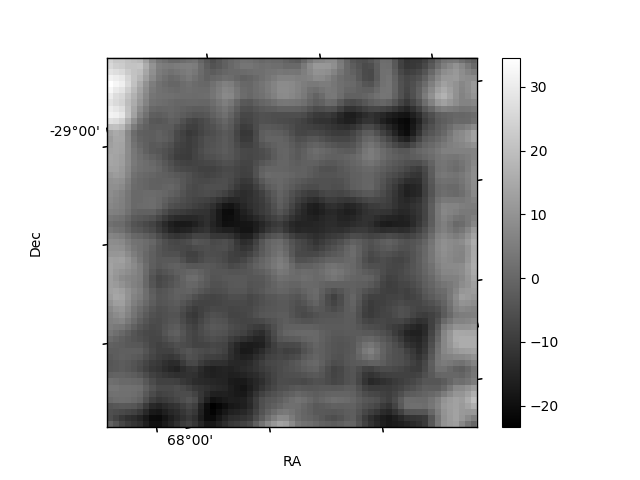
Histogram calculated using DETX and DETY for each event in the final _common_clean file
| Quadrant A | 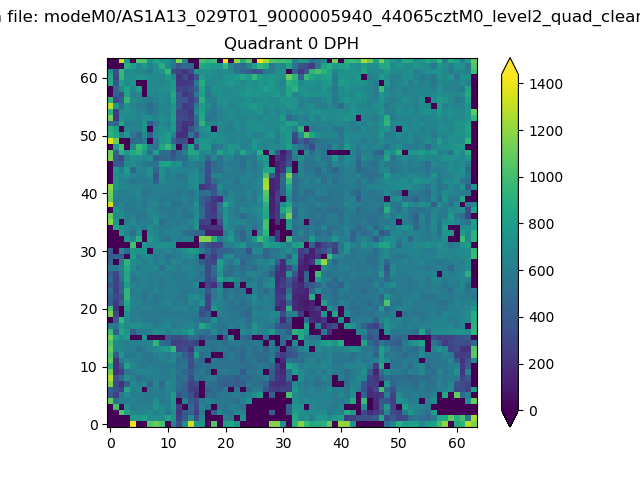 |
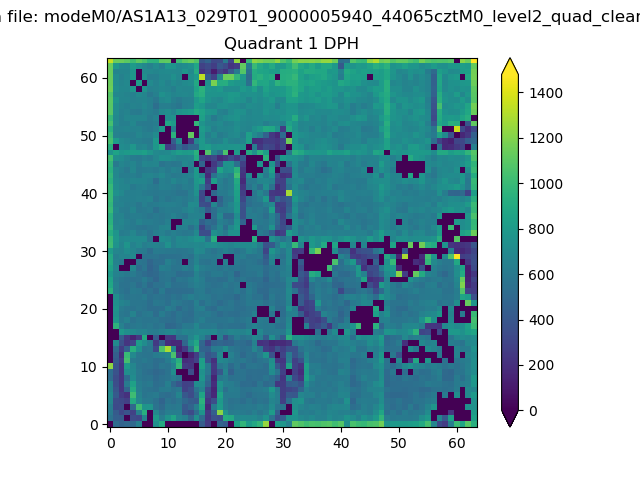 |
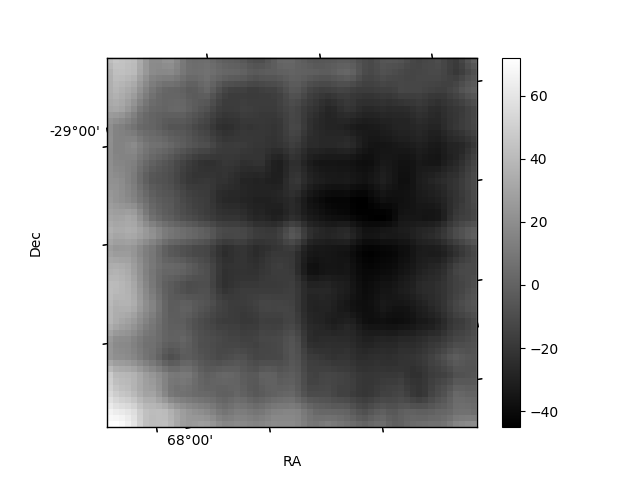
Quadrant B |
|---|---|---|---|
| Quadrant D | 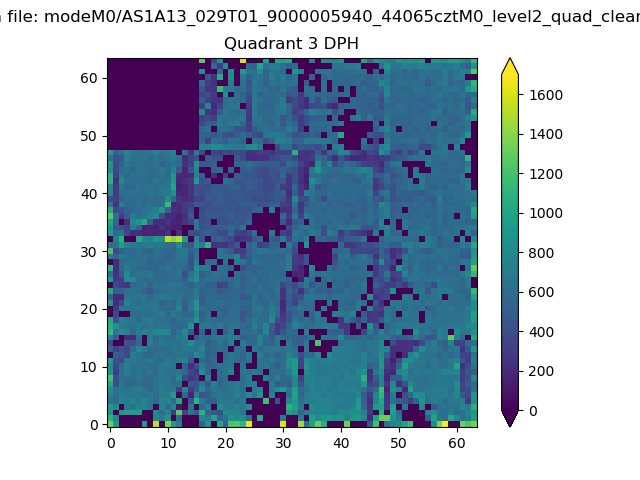 |
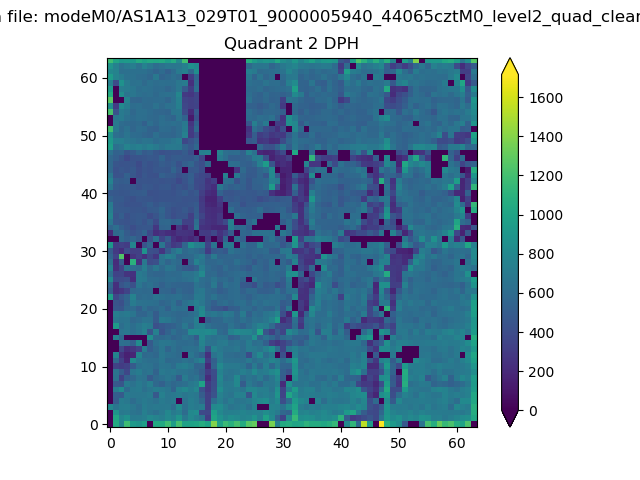 |
Quadrant C |
| Plot type | Count rate plots | Images |
|---|---|---|
| Comparison with Poisson distribution Blue bars denote a histogram of data divided into 1 sec bins. Red curve is a Poisson curve with rate = median count rate of data. |
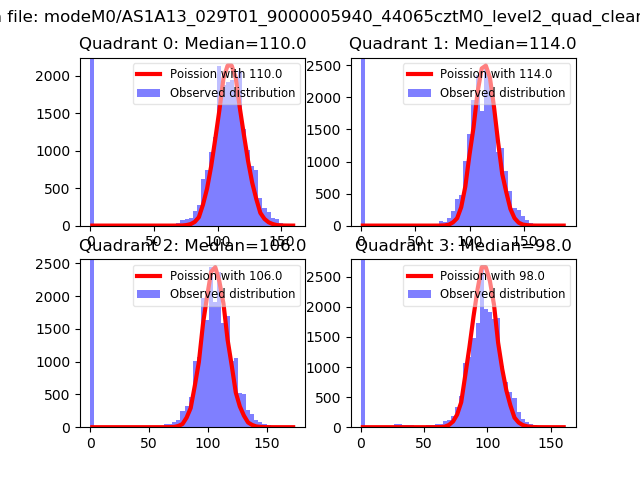 |
 |
| Quadrant-wise count rates Data is divided into 100 sec bins |
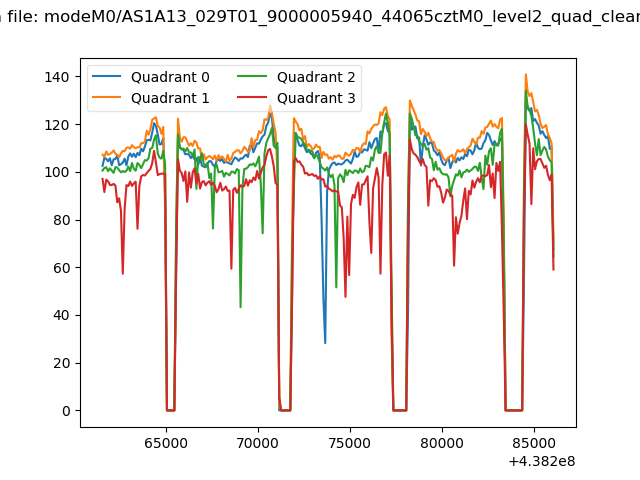 |
|
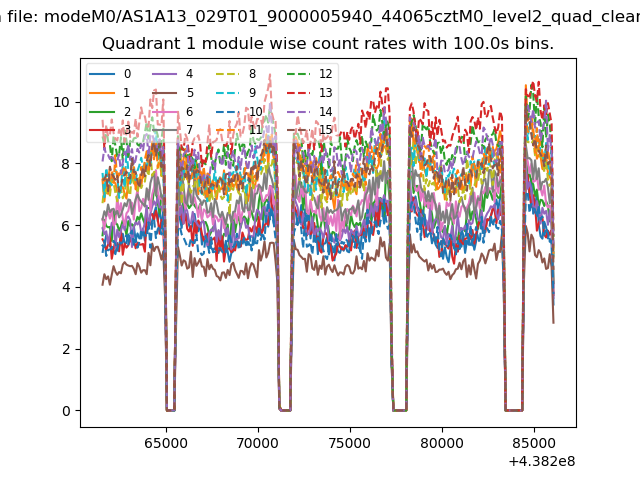
| Module-wise count rates for Quadrant A Data is divided into 100 sec bins |
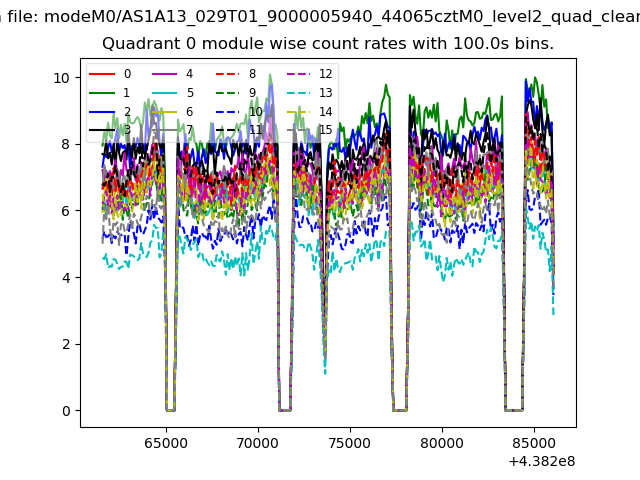 |
 |
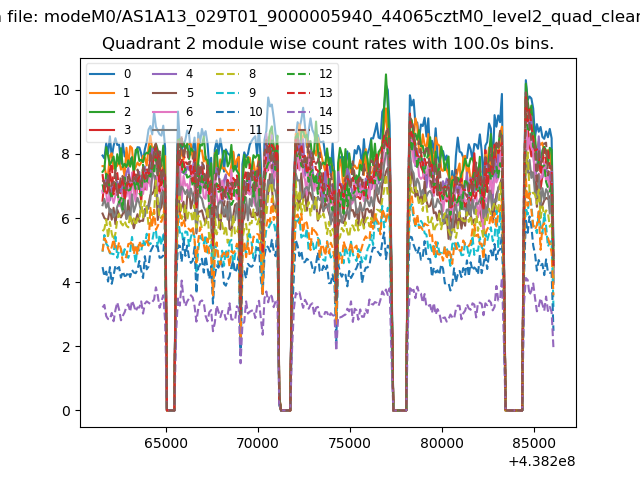
| Module-wise count rates for Quadrant B Data is divided into 100 sec bins |
 |
 |
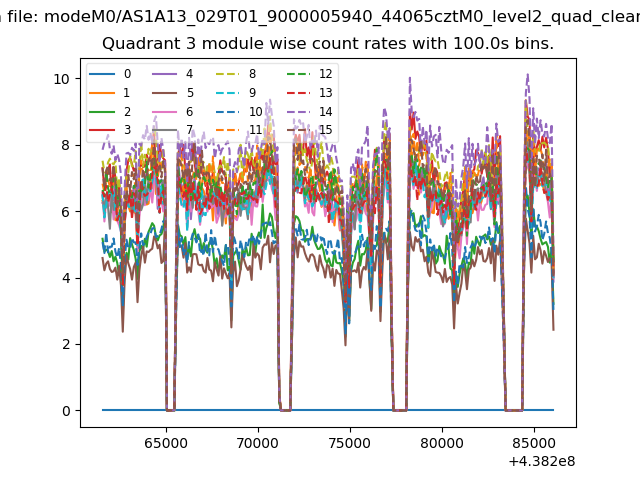
| Module-wise count rates for Quadrant C Data is divided into 100 sec bins |
 |
 |
| Module-wise count rates for Quadrant D Data is divided into 100 sec bins |
 |
 |
| Parameter | Plot |
|---|---|
| CZT HV Monitor | 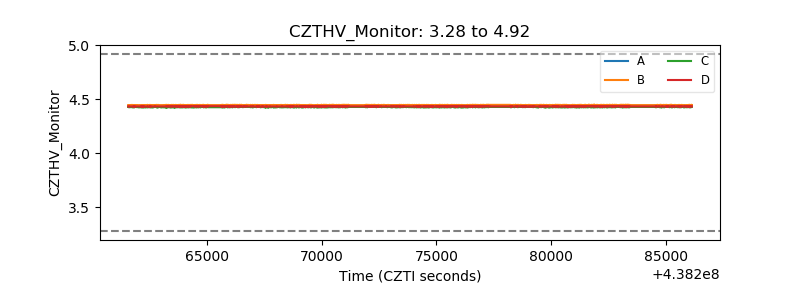 |
| D_VDD | 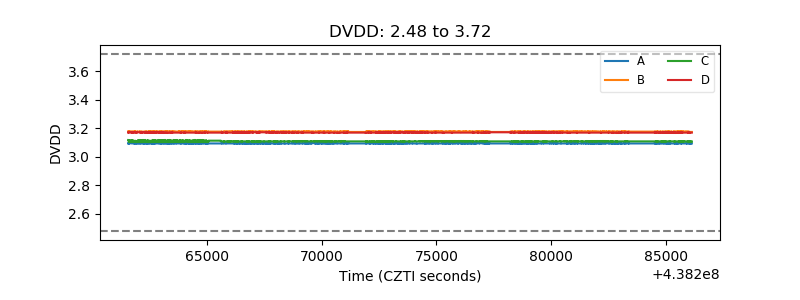 |
| Temperature 1 | 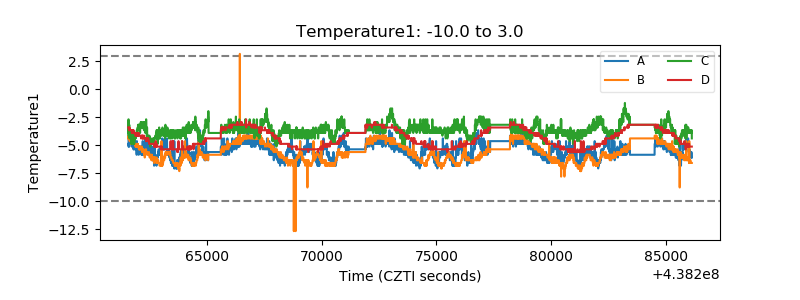 |
| Veto HV Monitor | 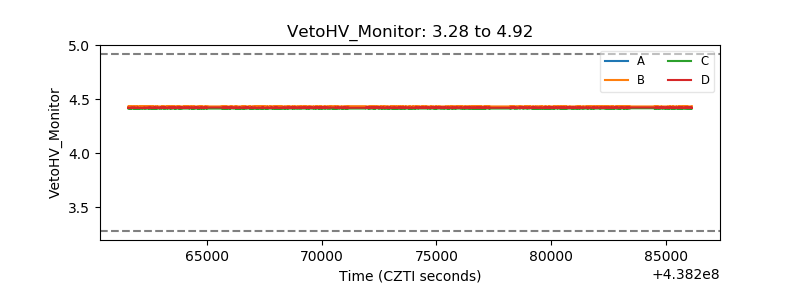 |
| Veto LLD | 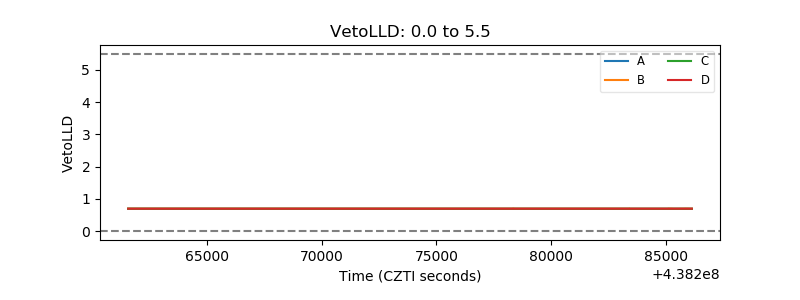 |
| Alpha Counter |  |
| _CPM_Rate | 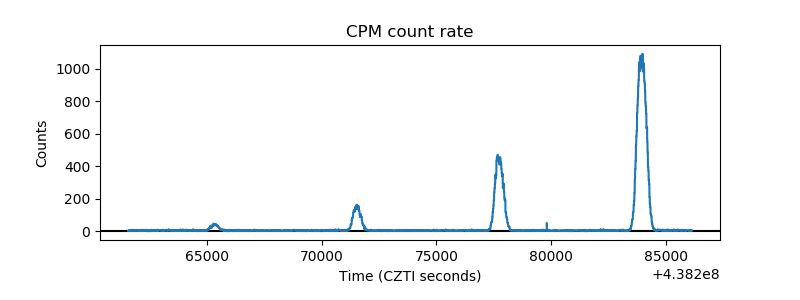 |
| CZT Counter | 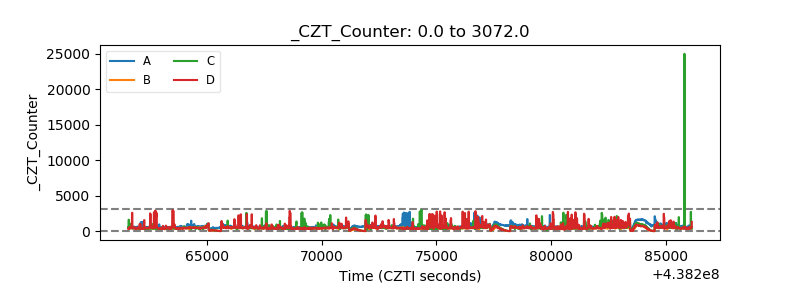 |
| +2.5 Volts monitor | 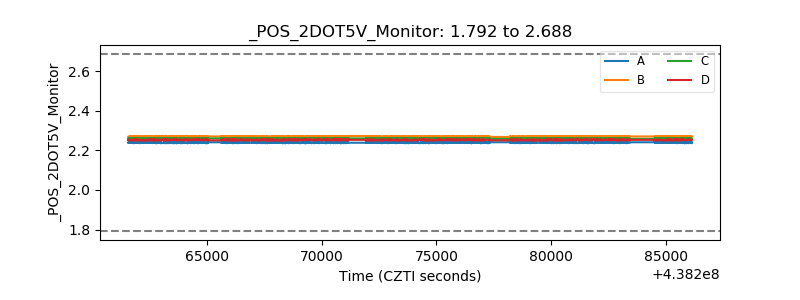 |
| +5 Volts monitor | 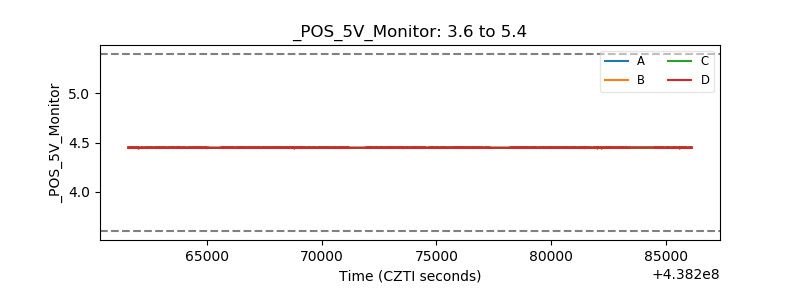 |
| _ROLL_ROT | 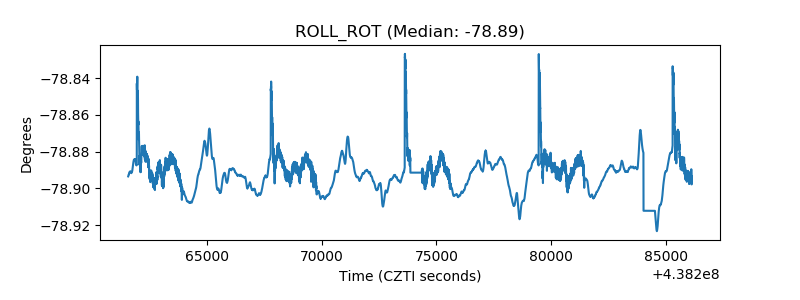 |
| _Roll_DEC | 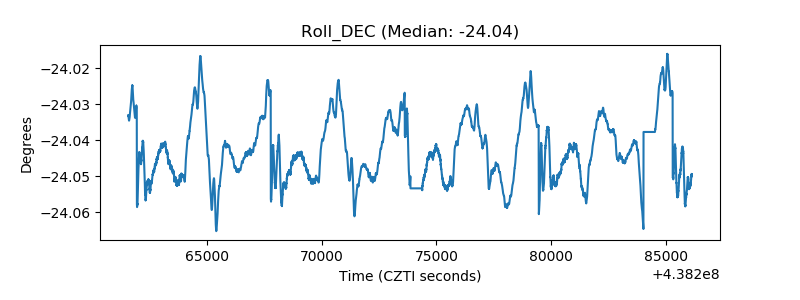 |
| _Roll_RA | 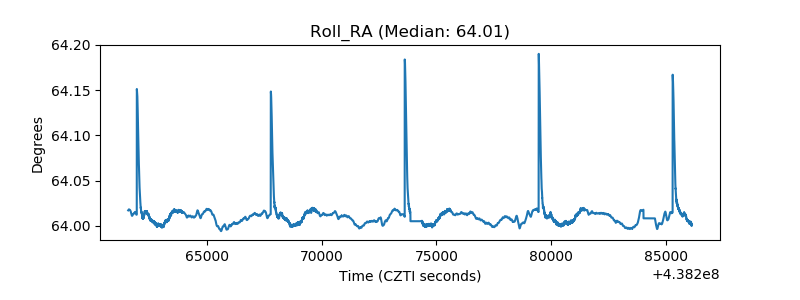 |
| Veto Counter | 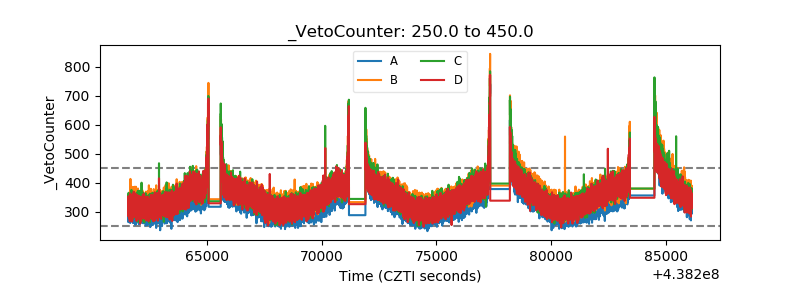 |