| Param | Original file | Final file |
|---|---|---|
| Filename | modeM0/AS1A13_029T01_9000005940_44066cztM0_level2.fits | modeM0/AS1A13_029T01_9000005940_44066cztM0_level2_quad_clean.evt |
| Size (bytes) | 509,307,840 | 110,525,760 |
| Size | 485.7 MB | 105.4 MB |
| Events in quadrant A | 4,642,595 | 771,030 |
| Events in quadrant B | 3,075,317 | 808,388 |
| Events in quadrant C | 3,490,974 | 743,814 |
| Events in quadrant D | 7,125,668 | 558,201 |
| Mode SS | |||
|---|---|---|---|
| Quadrant | BADHDUFLAG | Total packets | Discarded packets |
| A | 0 | 136 | 0 |
| B | 0 | 136 | 0 |
| C | 0 | 136 | 0 |
| D | 0 | 136 | 0 |
| Mode M0 | |||
|---|---|---|---|
| Quadrant | BADHDUFLAG | Total packets | Discarded packets |
| A | 0 | 18422 | 2 |
| B | 0 | 13756 | 2 |
| C | 0 | 15130 | 2 |
| D | 0 | 25799 | 2 |
| Mode M9 | |||
|---|---|---|---|
| Quadrant | BADHDUFLAG | Total packets | Discarded packets |
| A | 0 | 11 | 0 |
| B | 0 | 11 | 0 |
| C | 0 | 11 | 0 |
| D | 0 | 11 | 0 |
| Quadrant | Total seconds | Saturated seconds | Saturation percentage |
|---|---|---|---|
| A | 6673 | 122 | 1.828263% |
| B | 6673 | 56 | 0.839203% |
| C | 6673 | 98 | 1.468605% |
| D | 6674 | 1371 | 20.542403% |
Noise dominated data is calculated using 1-second bins in cleaned event files. If a bin has >2000 counts, and if more than 50% of those come from <1% of pixels, then it is considered to be noise-dominated and hence unusable.
| Quadrant | # 1 sec bins | Bins with >0 counts | Bins with >2000 counts | High rate bins dominated by noise | Noise dominated (total time) | Noise dominated (detector-on time) | Marked lightcurve |
|---|---|---|---|---|---|---|---|
| A | 7798 | 6674 | 20 | 20 | 0.26% | 0.30% | 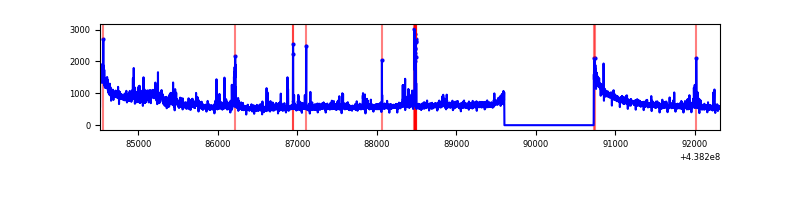 |
| B | 7798 | 6674 | 5 | 5 | 0.06% | 0.07% | 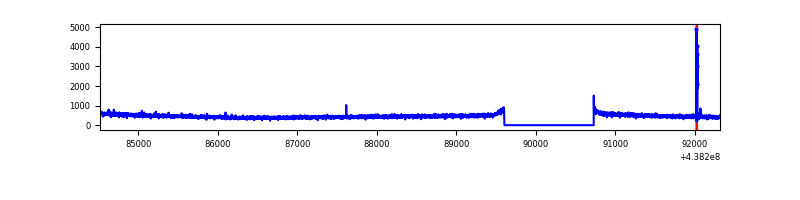 |
| C | 7798 | 6674 | 68 | 68 | 0.87% | 1.02% | 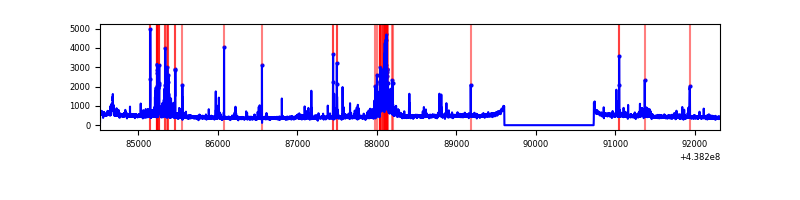 |
| D | 7799 | 6674 | 1172 | 1172 | 15.03% | 17.56% | 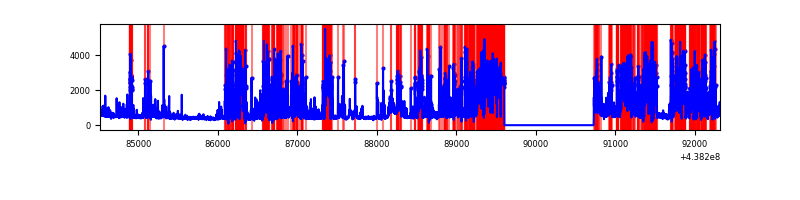 |
Top three noisy pixels from each quadrant. If the there are fewer than three noisy pixels in the level2.evt file, extra rows are filled as -1
| Pixel properties | Quadrant properties | ||||||
|---|---|---|---|---|---|---|---|
| Quadrant | DetID | PixID | Counts | Sigma | Mean | Median | Sigma |
| A | 10 | 83 | 1219093 | 7680.19 | 771 | 755 | 158.6 |
| A | 15 | 222 | 238149 | 1496.49 | 771 | 755 | 158.6 |
| A | 12 | 227 | 149185 | 935.68 | 771 | 755 | 158.6 |
| B | 4 | 216 | 24653 | 156.2 | 773 | 750 | 153.0 |
| B | 12 | 111 | 19601 | 123.18 | 773 | 750 | 153.0 |
| B | 11 | 111 | 18241 | 114.3 | 773 | 750 | 153.0 |
| C | 1 | 241 | 410294 | 2307.6 | 747 | 754 | 177.5 |
| C | 14 | 254 | 124968 | 699.9 | 747 | 754 | 177.5 |
| C | 14 | 96 | 14107 | 75.24 | 747 | 754 | 177.5 |
| D | 13 | 249 | 2712899 | 16396.76 | 655 | 635 | 165.4 |
| D | 5 | 235 | 1017876 | 6149.64 | 655 | 635 | 165.4 |
| D | 1 | 52 | 592051 | 3575.35 | 655 | 635 | 165.4 |
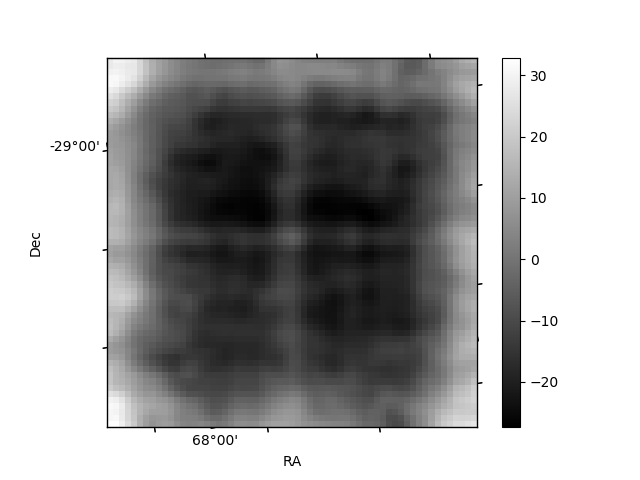
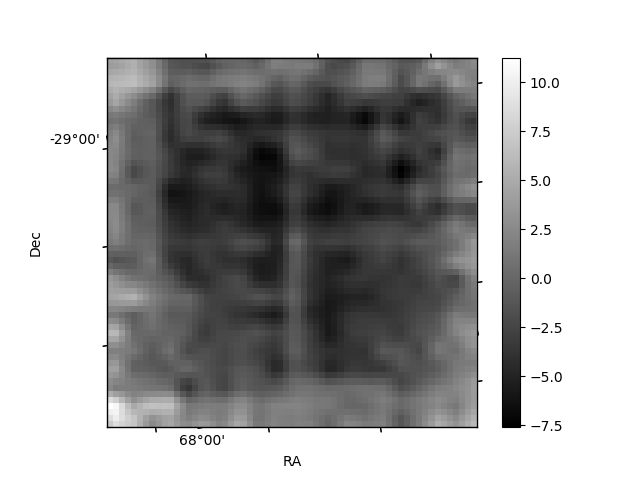
Histogram calculated using DETX and DETY for each event in the final _common_clean file
| Quadrant A | 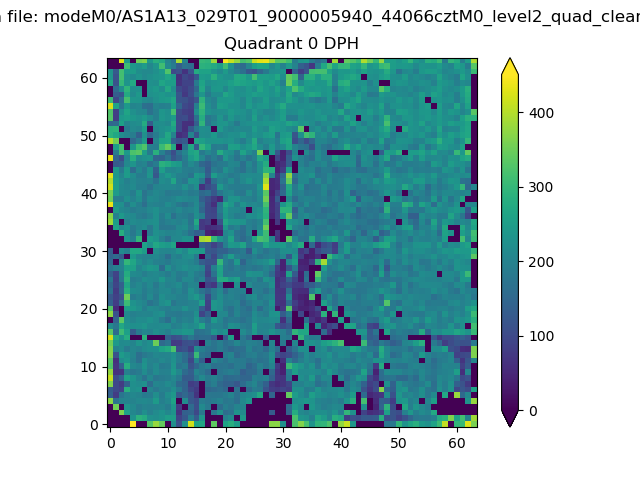 |
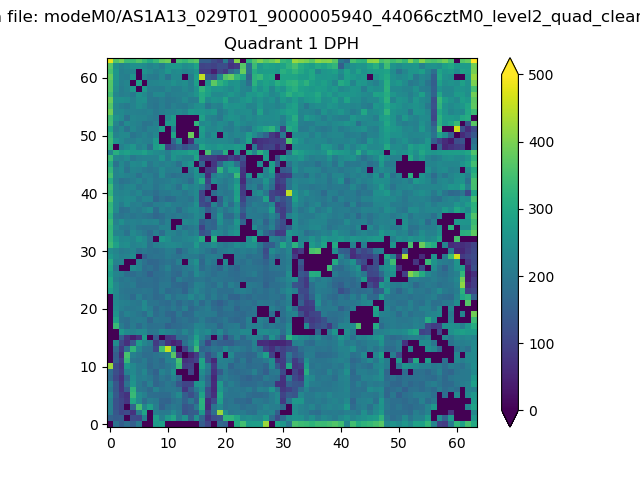 |
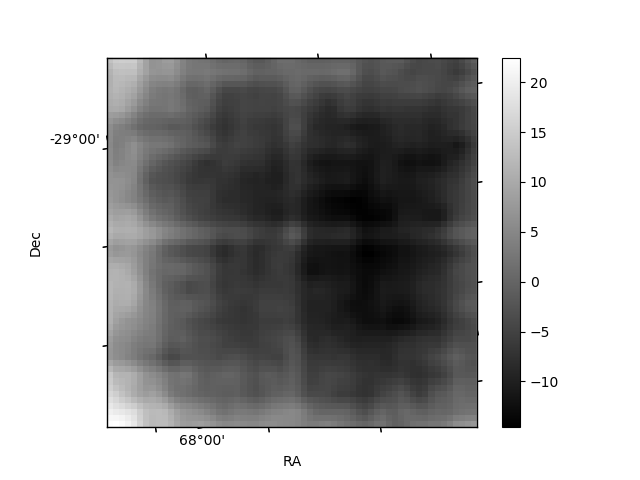
Quadrant B |
|---|---|---|---|
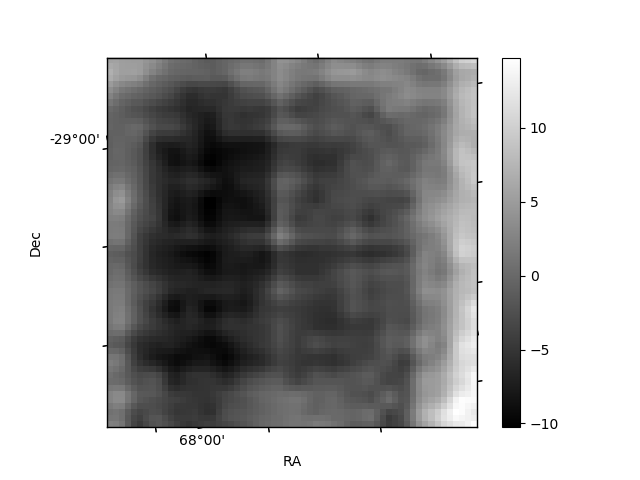
| Quadrant D | 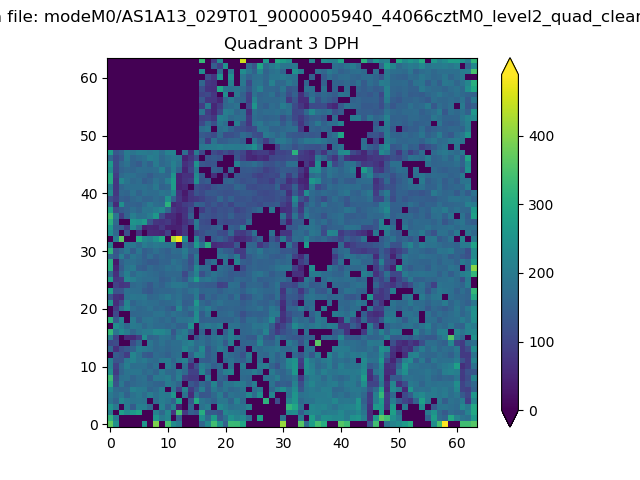 |
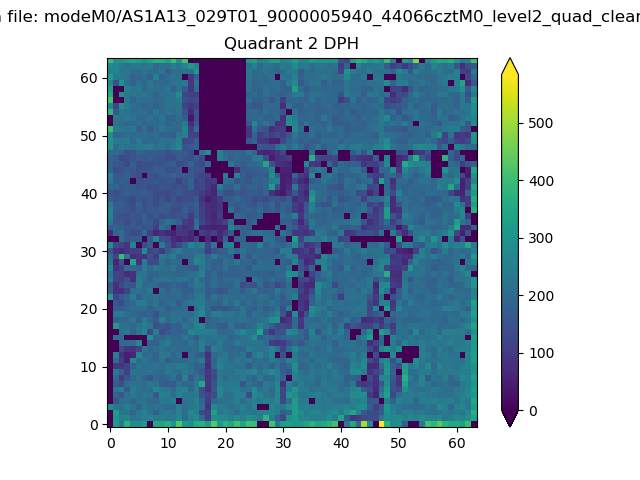 |
Quadrant C |
| Plot type | Count rate plots | Images |
|---|---|---|
| Comparison with Poisson distribution Blue bars denote a histogram of data divided into 1 sec bins. Red curve is a Poisson curve with rate = median count rate of data. |
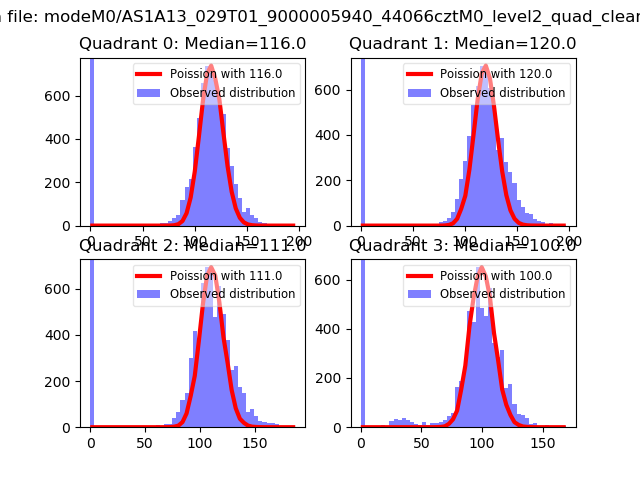 |
 |
| Quadrant-wise count rates Data is divided into 100 sec bins |
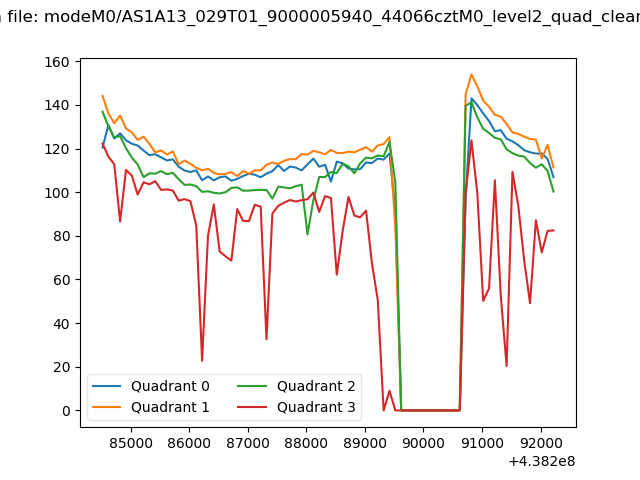 |
|
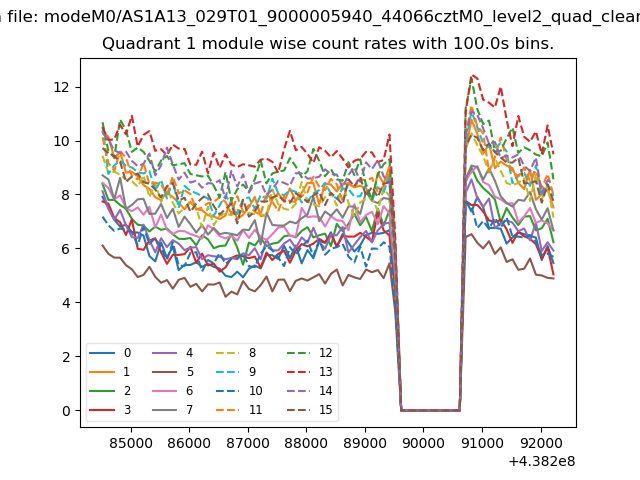
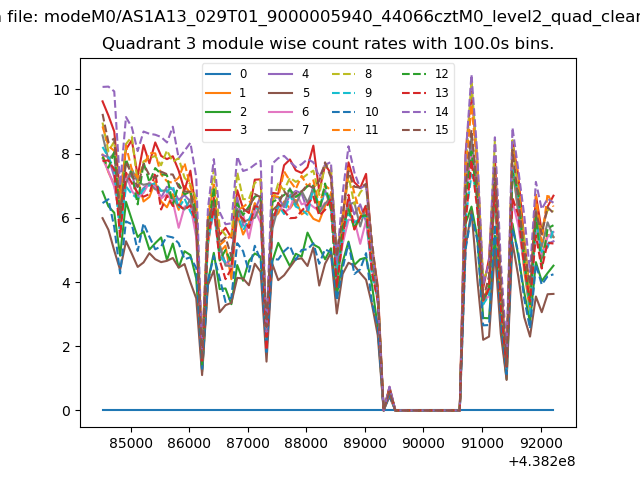
| Module-wise count rates for Quadrant A Data is divided into 100 sec bins |
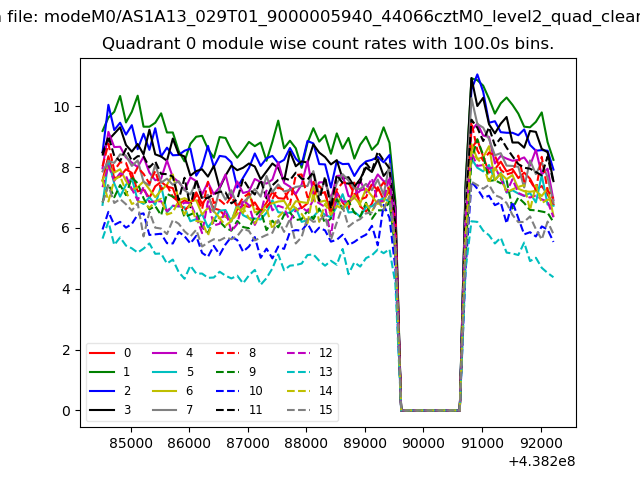 |
 |
| Module-wise count rates for Quadrant B Data is divided into 100 sec bins |
 |
 |
| Module-wise count rates for Quadrant C Data is divided into 100 sec bins |
 |
 |
| Module-wise count rates for Quadrant D Data is divided into 100 sec bins |
 |
 |
| Parameter | Plot |
|---|---|
| CZT HV Monitor | 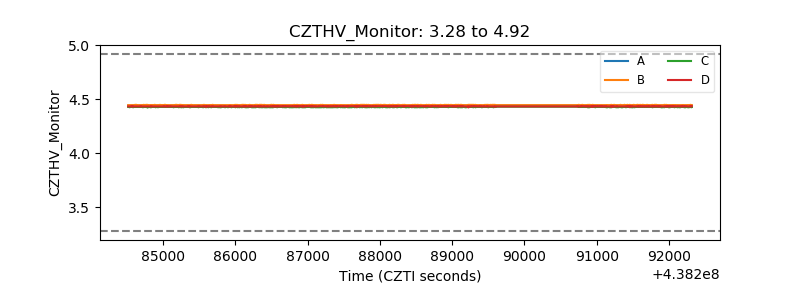 |
| D_VDD | 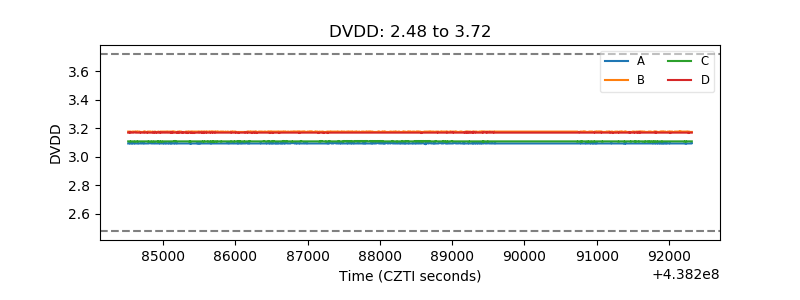 |
| Temperature 1 | 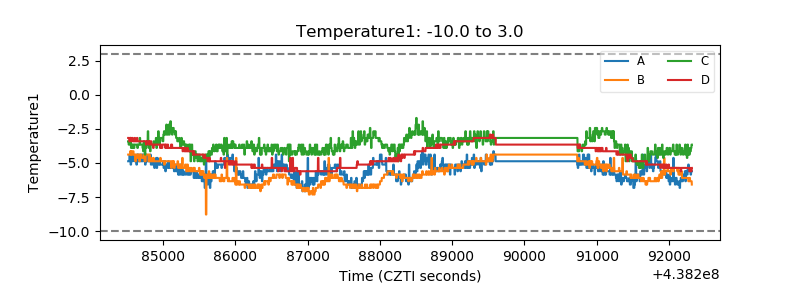 |
| Veto HV Monitor | 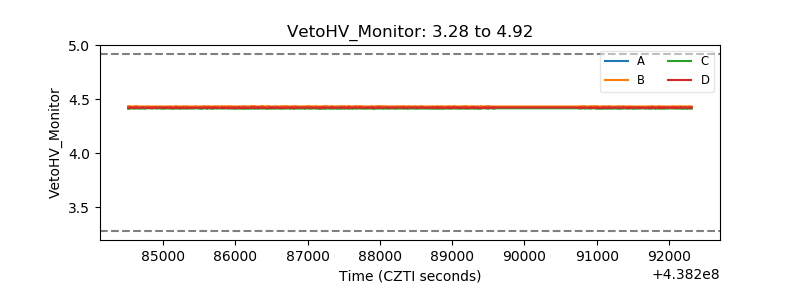 |
| Veto LLD | 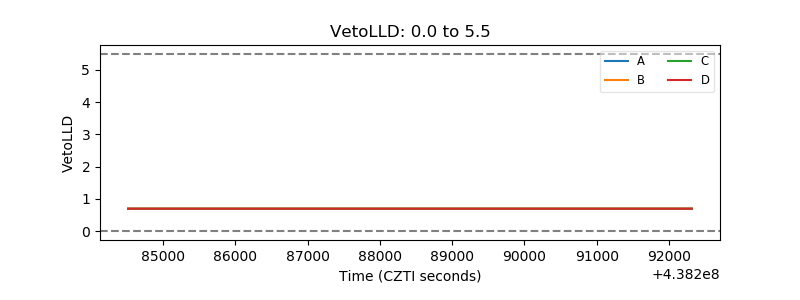 |
| Alpha Counter | 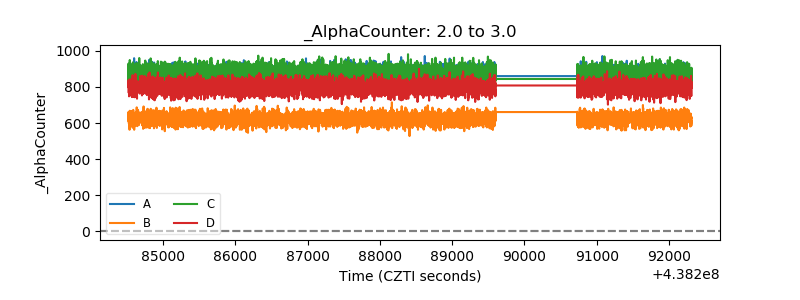 |
| _CPM_Rate | 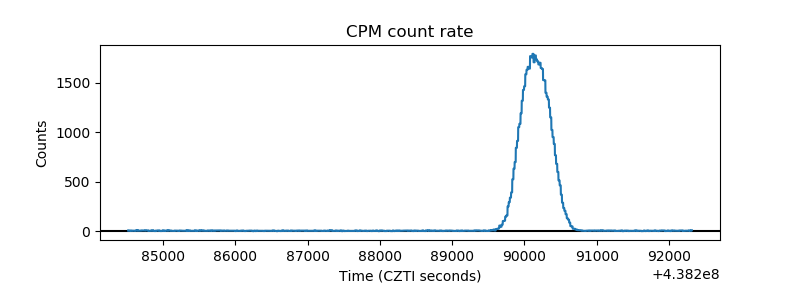 |
| CZT Counter | 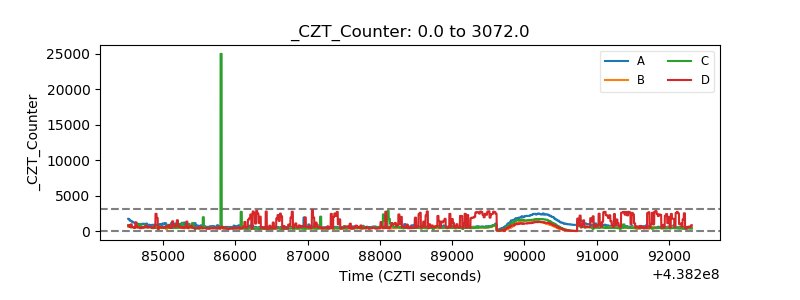 |
| +2.5 Volts monitor | 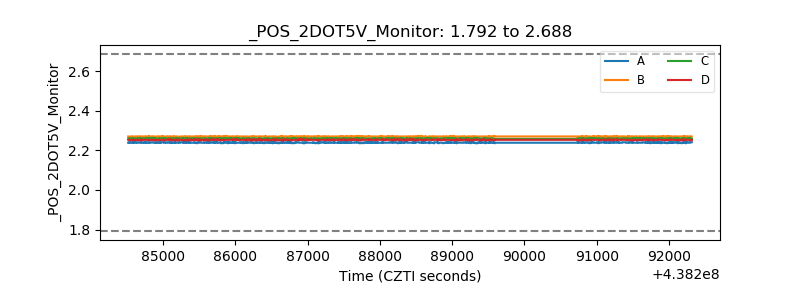 |
| +5 Volts monitor | 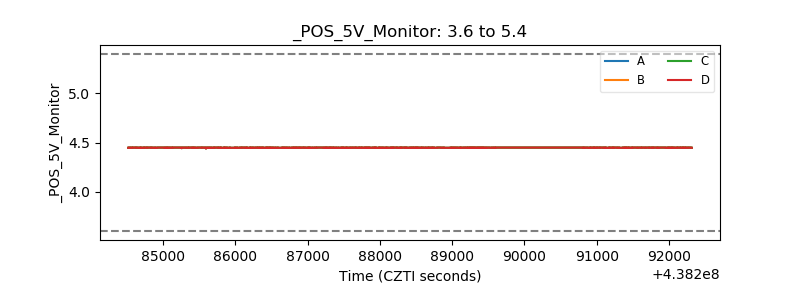 |
| _ROLL_ROT | 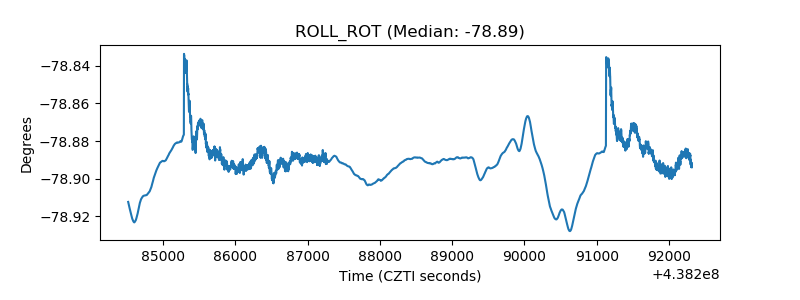 |
| _Roll_DEC | 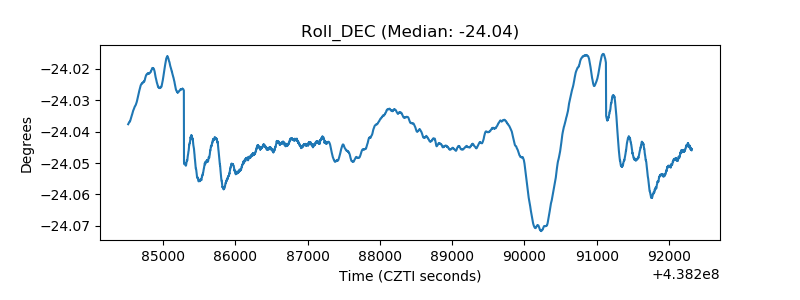 |
| _Roll_RA | 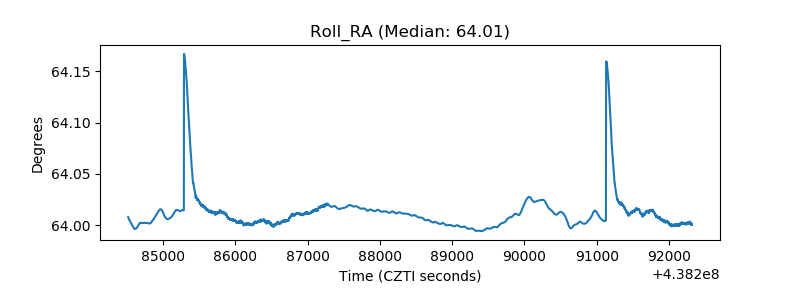 |
| Veto Counter | 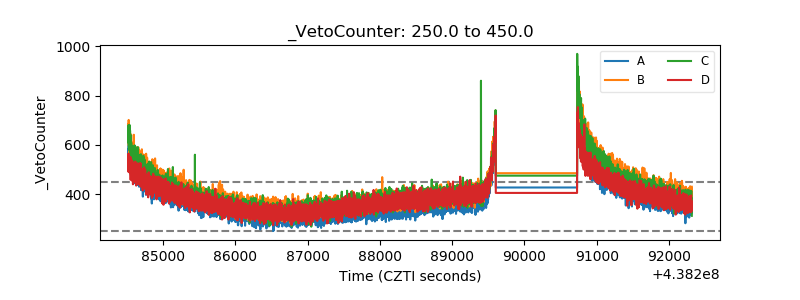 |