| Param | Original file | Final file |
|---|---|---|
| Filename | modeM0/AS1A13_029T01_9000005940_44067cztM0_level2.fits | modeM0/AS1A13_029T01_9000005940_44067cztM0_level2_quad_clean.evt |
| Size (bytes) | 531,434,880 | 111,778,560 |
| Size | 506.8 MB | 106.6 MB |
| Events in quadrant A | 4,408,918 | 786,761 |
| Events in quadrant B | 3,158,731 | 831,813 |
| Events in quadrant C | 3,335,448 | 766,794 |
| Events in quadrant D | 8,254,659 | 537,587 |
| Mode SS | |||
|---|---|---|---|
| Quadrant | BADHDUFLAG | Total packets | Discarded packets |
| A | 0 | 138 | 0 |
| B | 0 | 138 | 0 |
| C | 0 | 138 | 0 |
| D | 0 | 138 | 0 |
| Mode M0 | |||
|---|---|---|---|
| Quadrant | BADHDUFLAG | Total packets | Discarded packets |
| A | 0 | 17528 | 2 |
| B | 0 | 13840 | 2 |
| C | 0 | 14526 | 2 |
| D | 0 | 29176 | 3 |
| Mode M9 | |||
|---|---|---|---|
| Quadrant | BADHDUFLAG | Total packets | Discarded packets |
| A | 0 | 23 | 0 |
| B | 0 | 23 | 0 |
| C | 0 | 23 | 0 |
| D | 0 | 23 | 0 |
| Quadrant | Total seconds | Saturated seconds | Saturation percentage |
|---|---|---|---|
| A | 6618 | 175 | 2.644303% |
| B | 6619 | 104 | 1.571234% |
| C | 6619 | 96 | 1.450370% |
| D | 6618 | 1791 | 27.062557% |
Noise dominated data is calculated using 1-second bins in cleaned event files. If a bin has >2000 counts, and if more than 50% of those come from <1% of pixels, then it is considered to be noise-dominated and hence unusable.
| Quadrant | # 1 sec bins | Bins with >0 counts | Bins with >2000 counts | High rate bins dominated by noise | Noise dominated (total time) | Noise dominated (detector-on time) | Marked lightcurve |
|---|---|---|---|---|---|---|---|
| A | 8933 | 6620 | 8 | 8 | 0.09% | 0.12% | 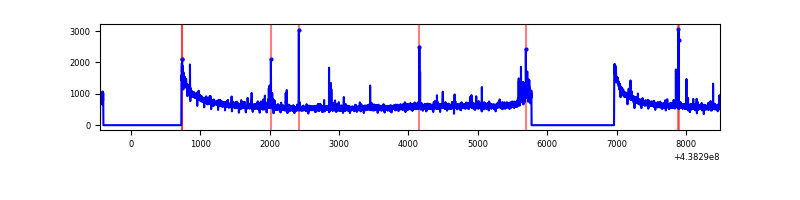 |
| B | 8934 | 6621 | 8 | 8 | 0.09% | 0.12% | 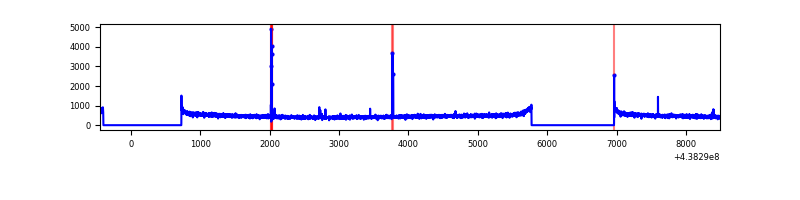 |
| C | 8934 | 6621 | 43 | 43 | 0.48% | 0.65% | 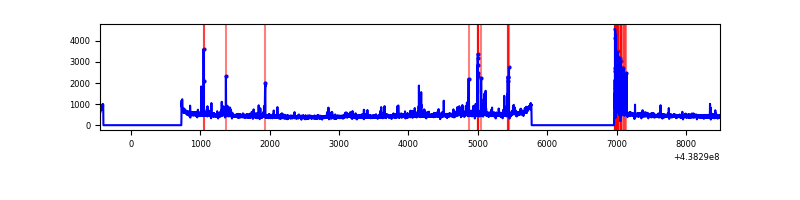 |
| D | 8933 | 6619 | 1384 | 1384 | 15.49% | 20.91% | 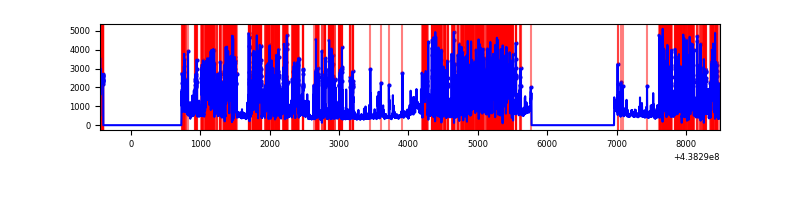 |
Top three noisy pixels from each quadrant. If the there are fewer than three noisy pixels in the level2.evt file, extra rows are filled as -1
| Pixel properties | Quadrant properties | ||||||
|---|---|---|---|---|---|---|---|
| Quadrant | DetID | PixID | Counts | Sigma | Mean | Median | Sigma |
| A | 10 | 83 | 1221439 | 7568.25 | 784 | 769 | 161.3 |
| A | 12 | 227 | 92054 | 565.97 | 784 | 769 | 161.3 |
| A | 7 | 3 | 31395 | 189.88 | 784 | 769 | 161.3 |
| B | 4 | 216 | 37581 | 238.78 | 790 | 765 | 154.2 |
| B | 12 | 111 | 19892 | 124.05 | 790 | 765 | 154.2 |
| B | 14 | 111 | 18357 | 114.1 | 790 | 765 | 154.2 |
| C | 1 | 241 | 179446 | 988.39 | 765 | 771 | 180.8 |
| C | 14 | 254 | 100984 | 554.36 | 765 | 771 | 180.8 |
| C | 14 | 96 | 29887 | 161.06 | 765 | 771 | 180.8 |
| D | 13 | 249 | 3061159 | 18965.9 | 647 | 631 | 161.4 |
| D | 1 | 52 | 1509924 | 9353.0 | 647 | 631 | 161.4 |
| D | 5 | 235 | 1029947 | 6378.61 | 647 | 631 | 161.4 |
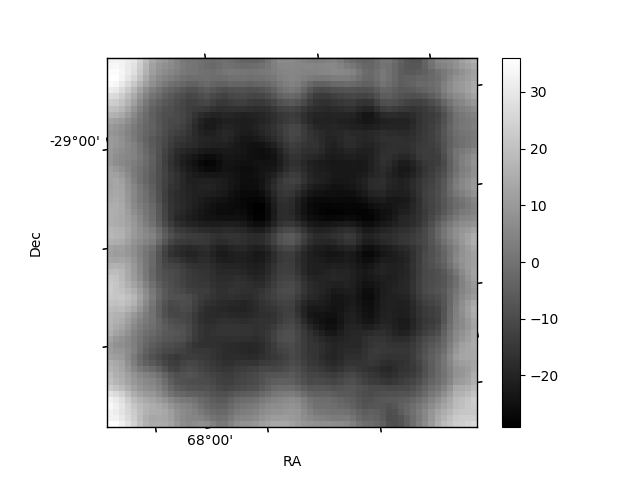
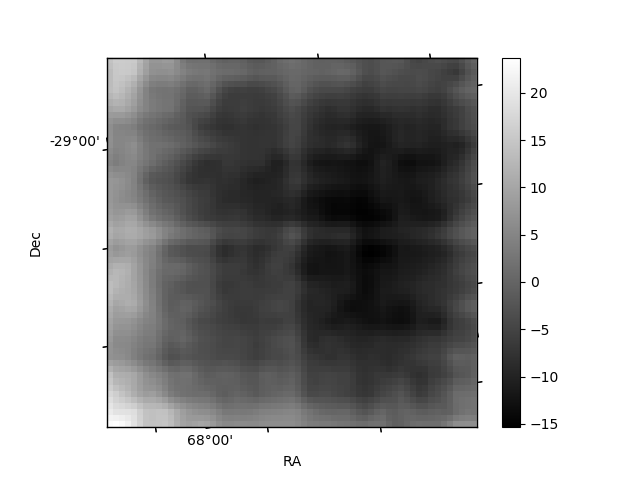
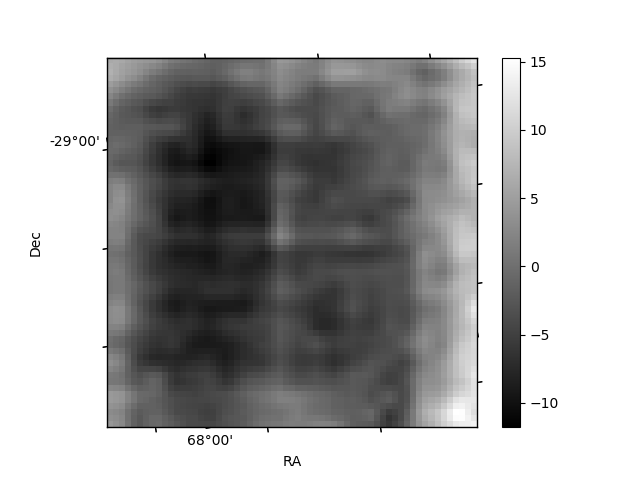
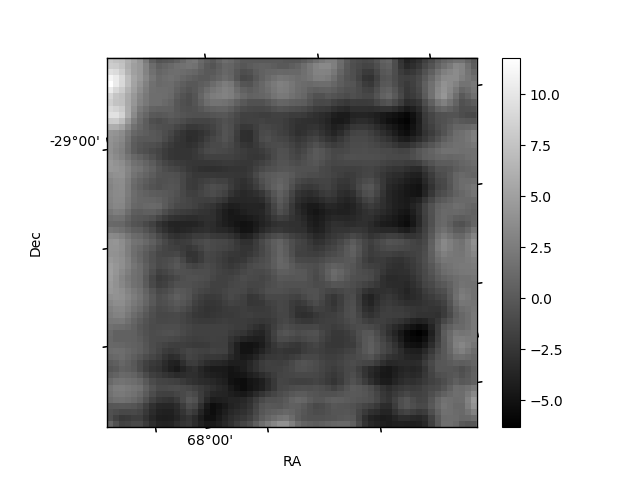
Histogram calculated using DETX and DETY for each event in the final _common_clean file
| Quadrant A | 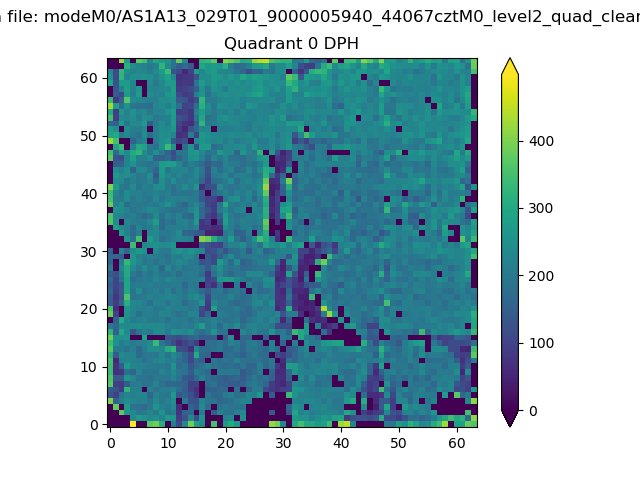 |
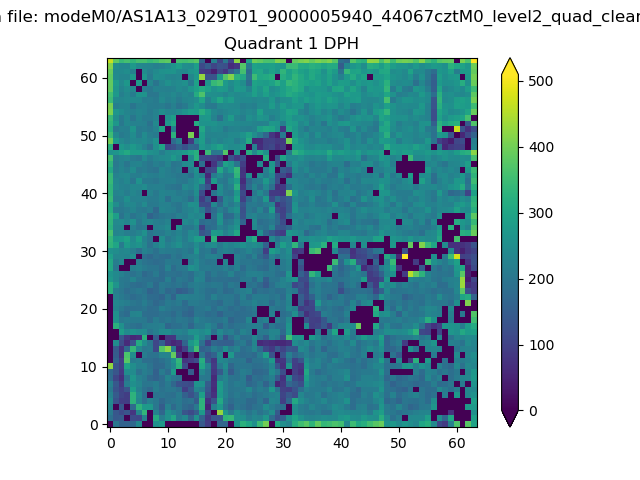 |
Quadrant B |
|---|---|---|---|
| Quadrant D | 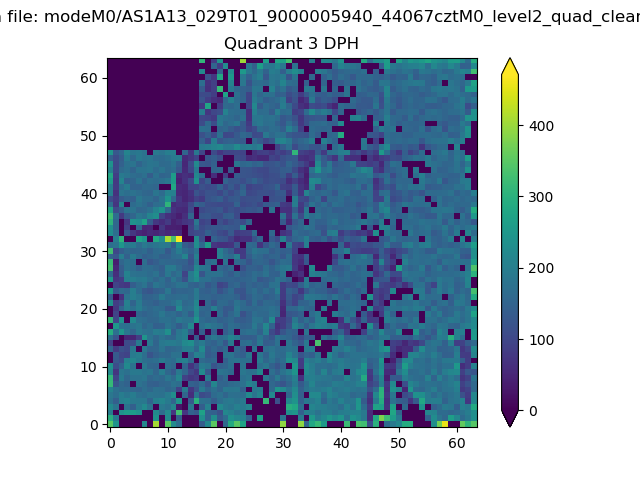 |
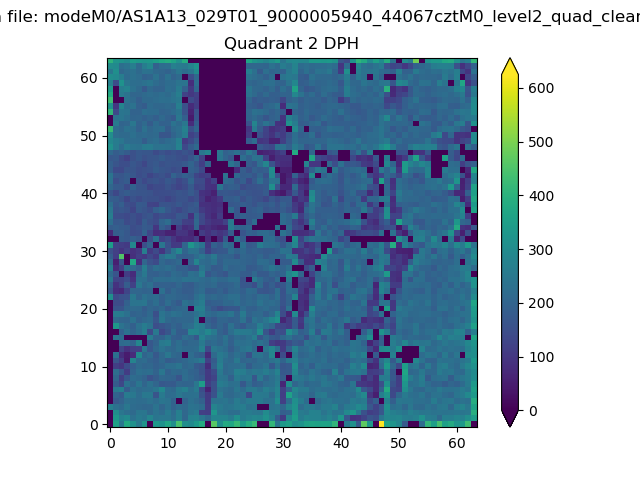 |
Quadrant C |
| Plot type | Count rate plots | Images |
|---|---|---|
| Comparison with Poisson distribution Blue bars denote a histogram of data divided into 1 sec bins. Red curve is a Poisson curve with rate = median count rate of data. |
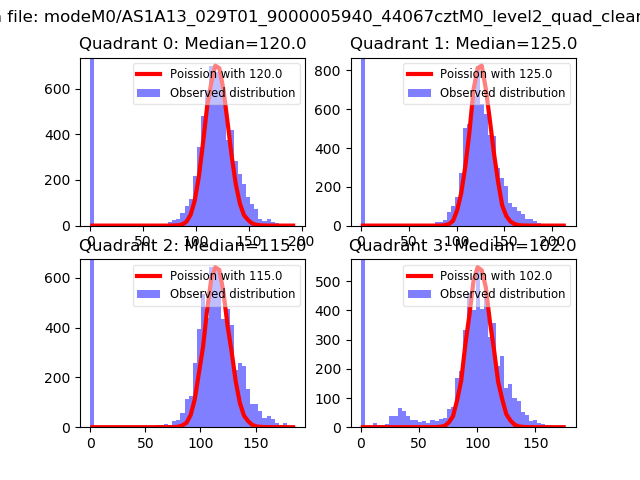 |
 |
| Quadrant-wise count rates Data is divided into 100 sec bins |
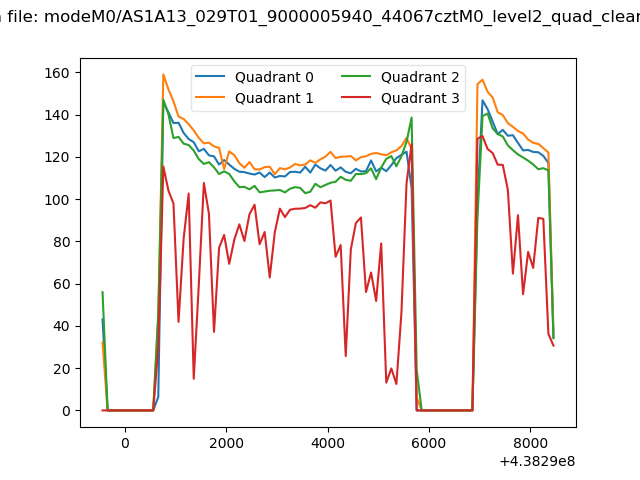 |
|
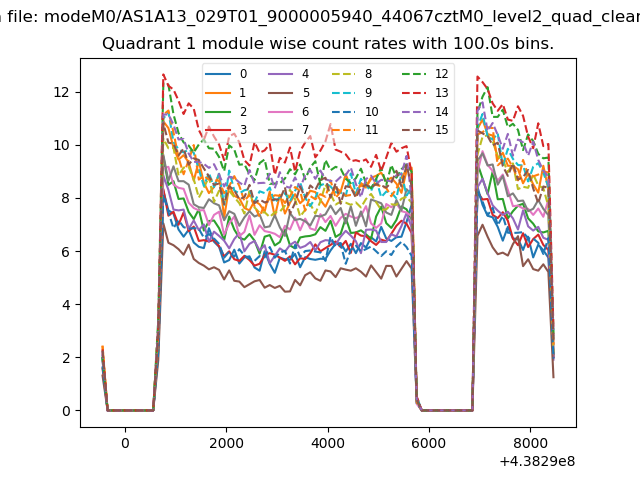
| Module-wise count rates for Quadrant A Data is divided into 100 sec bins |
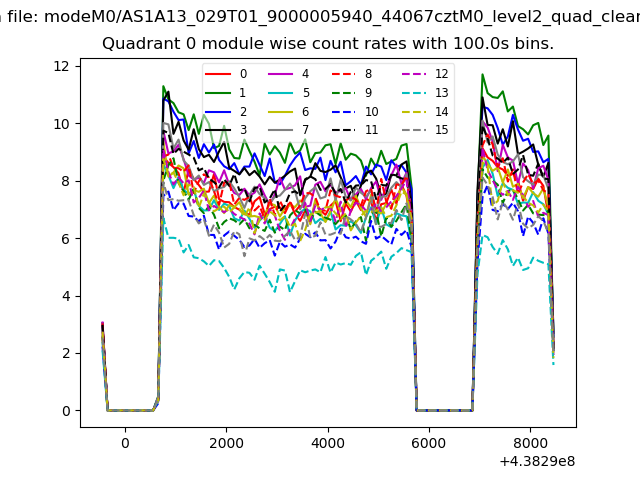 |
 |
| Module-wise count rates for Quadrant B Data is divided into 100 sec bins |
 |
 |
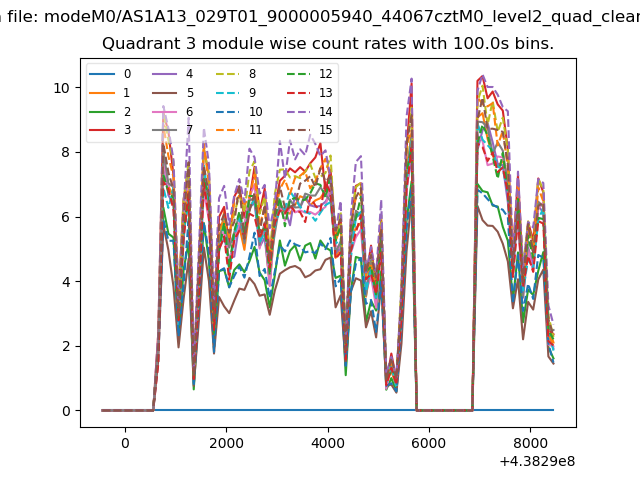
| Module-wise count rates for Quadrant C Data is divided into 100 sec bins |
 |
 |
| Module-wise count rates for Quadrant D Data is divided into 100 sec bins |
 |
 |
| Parameter | Plot |
|---|---|
| CZT HV Monitor | 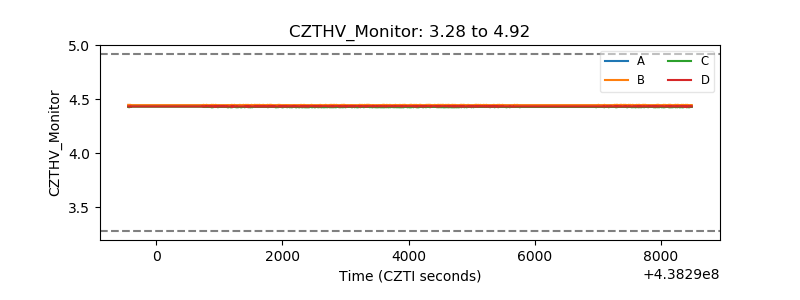 |
| D_VDD | 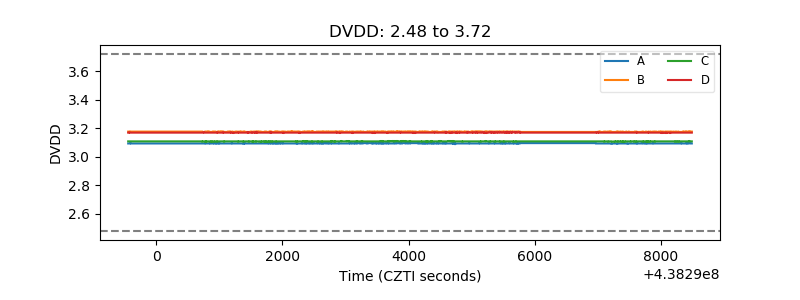 |
| Temperature 1 | 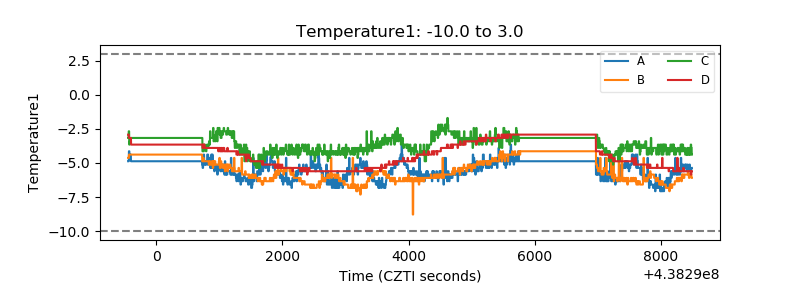 |
| Veto HV Monitor | 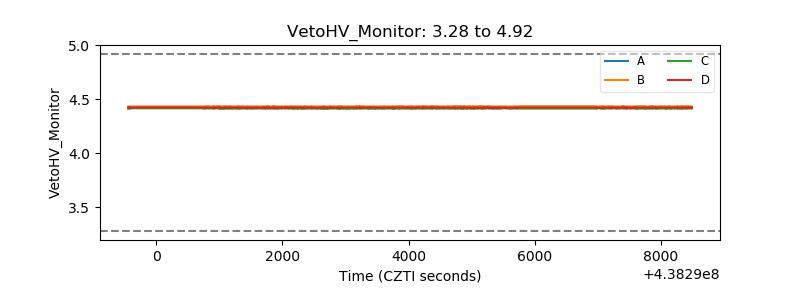 |
| Veto LLD | 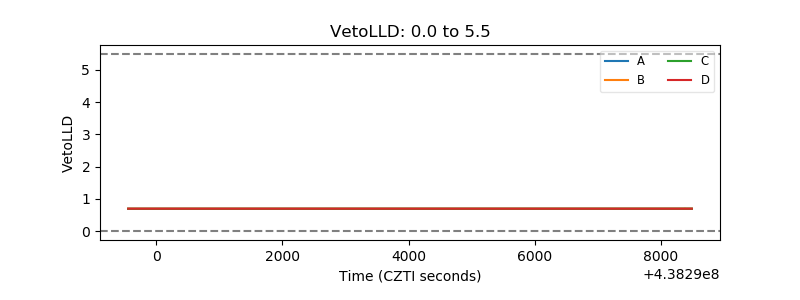 |
| Alpha Counter | 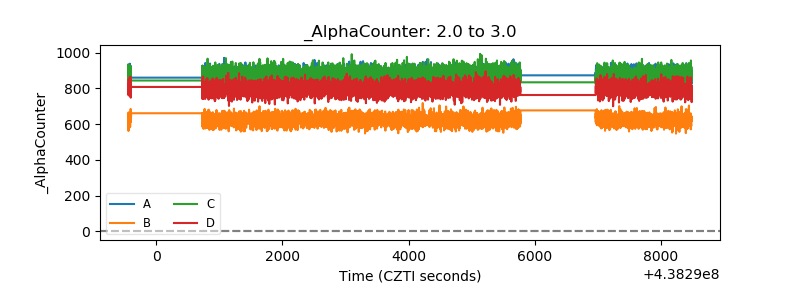 |
| _CPM_Rate | 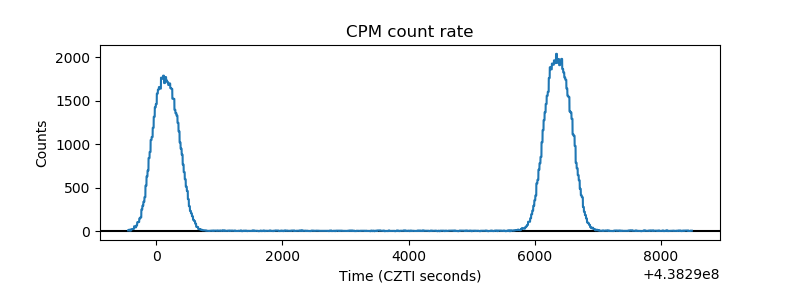 |
| CZT Counter | 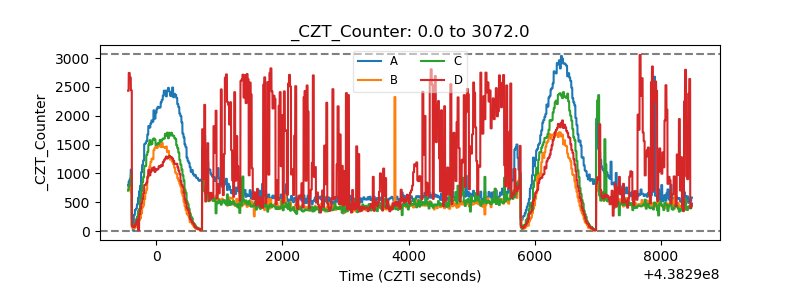 |
| +2.5 Volts monitor | 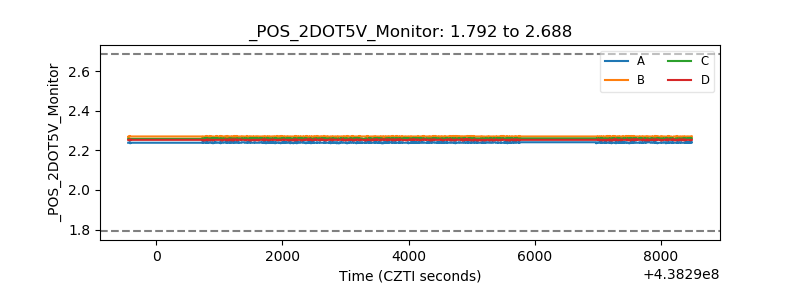 |
| +5 Volts monitor | 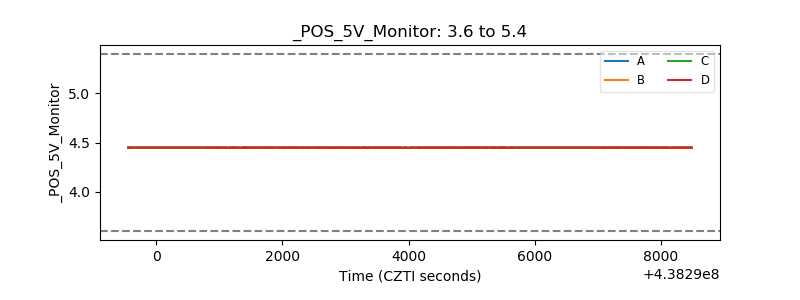 |
| _ROLL_ROT | 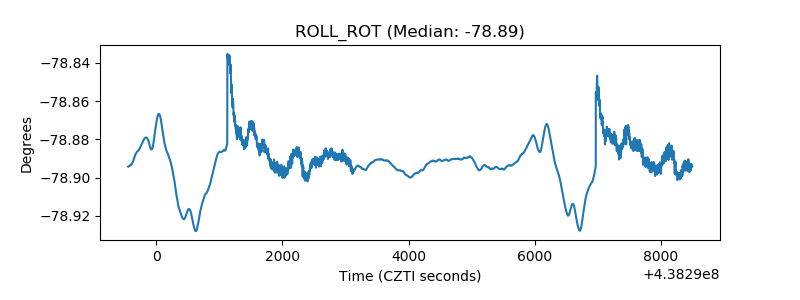 |
| _Roll_DEC | 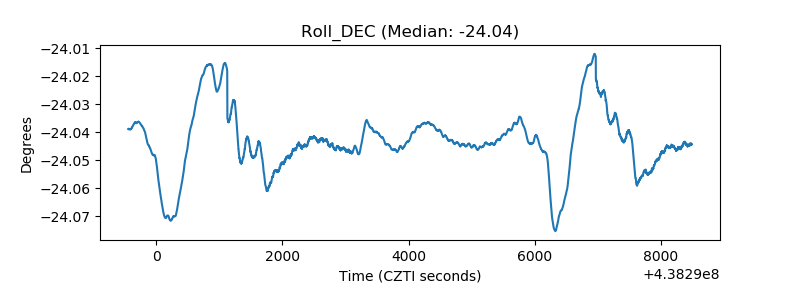 |
| _Roll_RA | 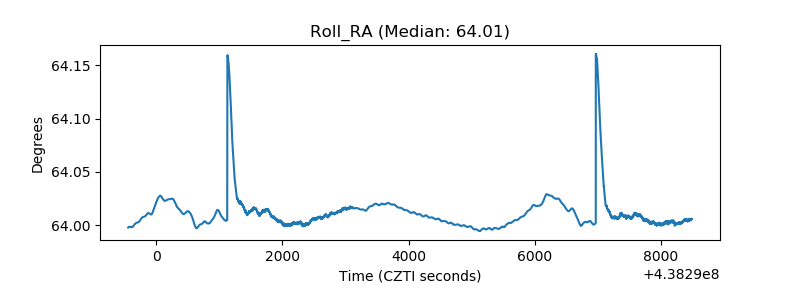 |
| Veto Counter | 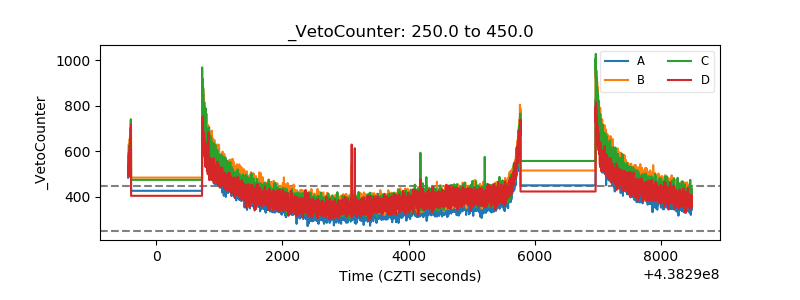 |