| Param | Original file | Final file |
|---|---|---|
| Filename | modeM0/AS1A13_029T01_9000005940_44068cztM0_level2.fits | modeM0/AS1A13_029T01_9000005940_44068cztM0_level2_quad_clean.evt |
| Size (bytes) | 473,273,280 | 115,467,840 |
| Size | 451.3 MB | 110.1 MB |
| Events in quadrant A | 4,548,913 | 790,876 |
| Events in quadrant B | 3,141,086 | 838,294 |
| Events in quadrant C | 3,170,070 | 770,722 |
| Events in quadrant D | 6,150,795 | 641,051 |
| Mode SS | |||
|---|---|---|---|
| Quadrant | BADHDUFLAG | Total packets | Discarded packets |
| A | 0 | 130 | 0 |
| B | 0 | 130 | 0 |
| C | 0 | 130 | 0 |
| D | 0 | 130 | 0 |
| Mode M0 | |||
|---|---|---|---|
| Quadrant | BADHDUFLAG | Total packets | Discarded packets |
| A | 0 | 18198 | 2 |
| B | 0 | 13598 | 2 |
| C | 0 | 13889 | 2 |
| D | 0 | 22776 | 4 |
| Mode M9 | |||
|---|---|---|---|
| Quadrant | BADHDUFLAG | Total packets | Discarded packets |
| A | 0 | 17 | 0 |
| B | 0 | 18 | 0 |
| C | 0 | 18 | 0 |
| D | 0 | 18 | 0 |
| Quadrant | Total seconds | Saturated seconds | Saturation percentage |
|---|---|---|---|
| A | 6542 | 125 | 1.910731% |
| B | 6542 | 46 | 0.703149% |
| C | 6542 | 56 | 0.856007% |
| D | 6541 | 791 | 12.092952% |
Noise dominated data is calculated using 1-second bins in cleaned event files. If a bin has >2000 counts, and if more than 50% of those come from <1% of pixels, then it is considered to be noise-dominated and hence unusable.
| Quadrant | # 1 sec bins | Bins with >0 counts | Bins with >2000 counts | High rate bins dominated by noise | Noise dominated (total time) | Noise dominated (detector-on time) | Marked lightcurve |
|---|---|---|---|---|---|---|---|
| A | 7782 | 6543 | 27 | 27 | 0.35% | 0.41% | 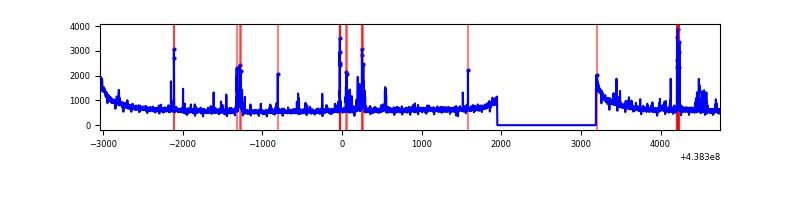 |
| B | 7782 | 6543 | 6 | 6 | 0.08% | 0.09% | 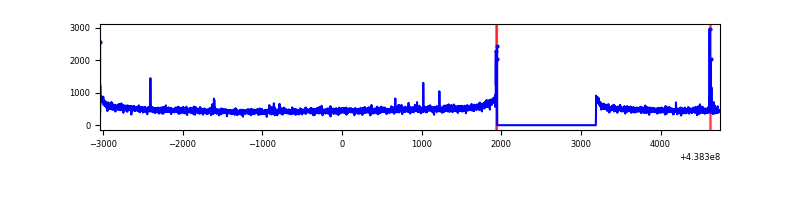 |
| C | 7782 | 6543 | 29 | 29 | 0.37% | 0.44% | 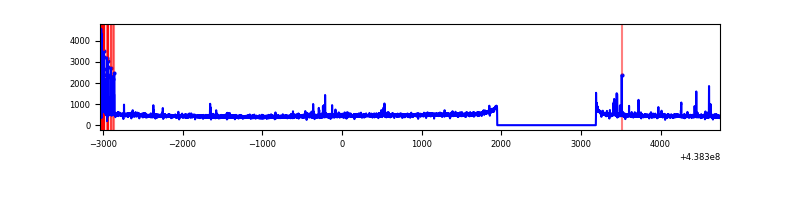 |
| D | 7781 | 6542 | 614 | 614 | 7.89% | 9.39% | 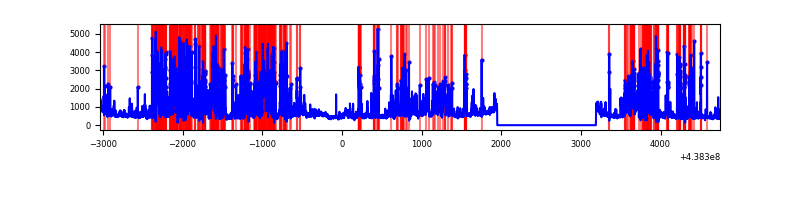 |
Top three noisy pixels from each quadrant. If the there are fewer than three noisy pixels in the level2.evt file, extra rows are filled as -1
| Pixel properties | Quadrant properties | ||||||
|---|---|---|---|---|---|---|---|
| Quadrant | DetID | PixID | Counts | Sigma | Mean | Median | Sigma |
| A | 10 | 83 | 1213123 | 7599.93 | 775 | 761 | 159.5 |
| A | 12 | 227 | 171419 | 1069.8 | 775 | 761 | 159.5 |
| A | 7 | 3 | 80641 | 500.74 | 775 | 761 | 159.5 |
| B | 4 | 173 | 27171 | 173.48 | 782 | 758 | 152.3 |
| B | 12 | 111 | 19304 | 121.81 | 782 | 758 | 152.3 |
| B | 14 | 111 | 18079 | 113.76 | 782 | 758 | 152.3 |
| C | 1 | 241 | 127123 | 704.77 | 761 | 768 | 179.3 |
| C | 14 | 254 | 25722 | 139.19 | 761 | 768 | 179.3 |
| C | 14 | 96 | 25497 | 137.93 | 761 | 768 | 179.3 |
| D | 13 | 249 | 2520914 | 13876.57 | 718 | 697 | 181.6 |
| D | 1 | 52 | 275392 | 1512.5 | 718 | 697 | 181.6 |
| D | 5 | 222 | 230730 | 1266.58 | 718 | 697 | 181.6 |
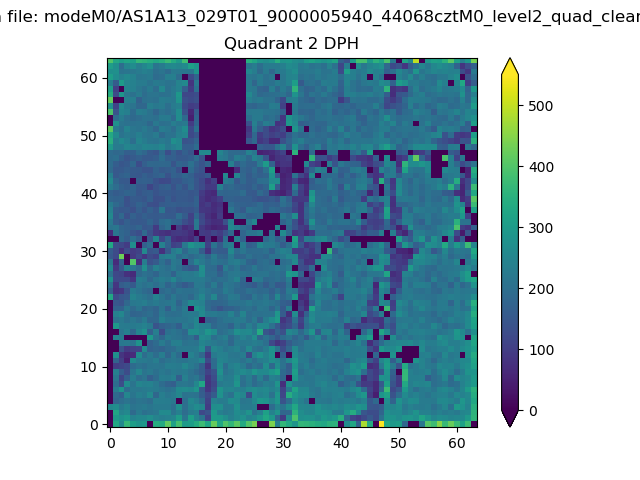
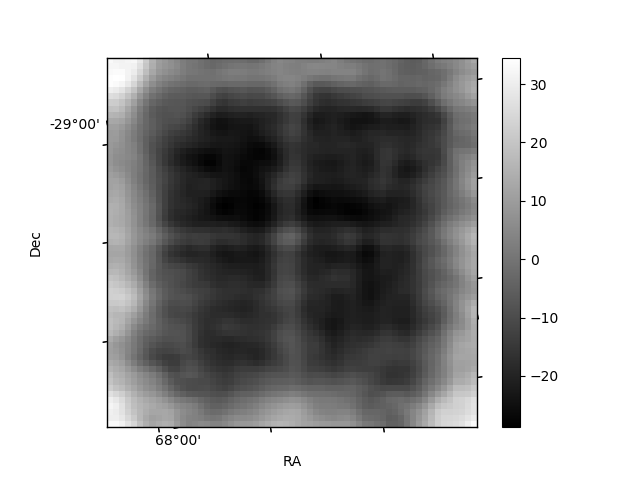
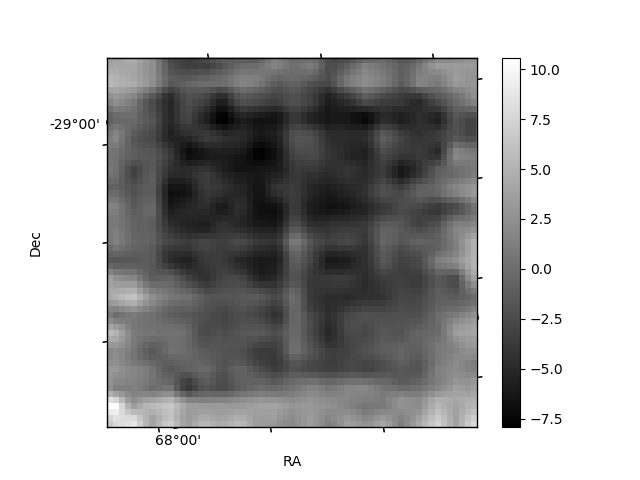
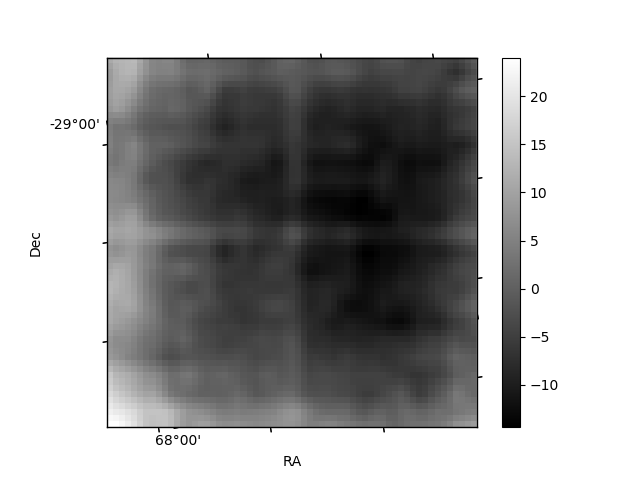
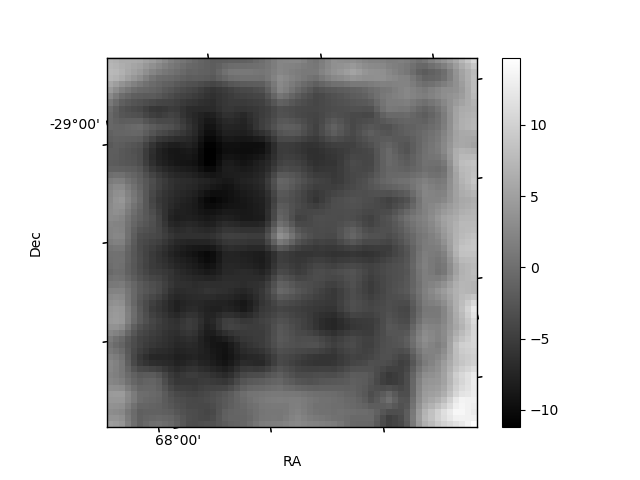
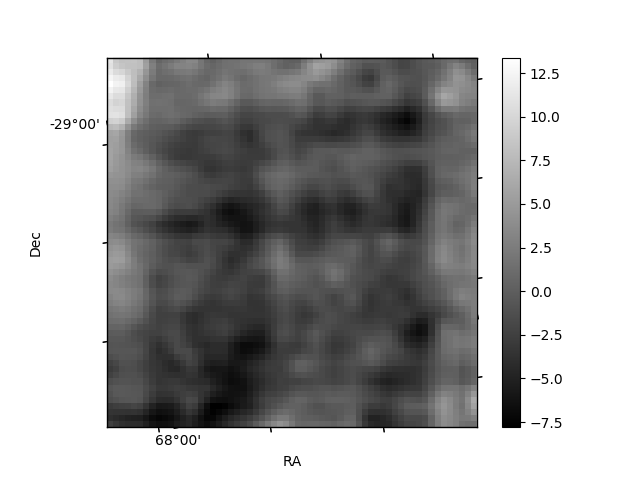
Histogram calculated using DETX and DETY for each event in the final _common_clean file
| Quadrant A | 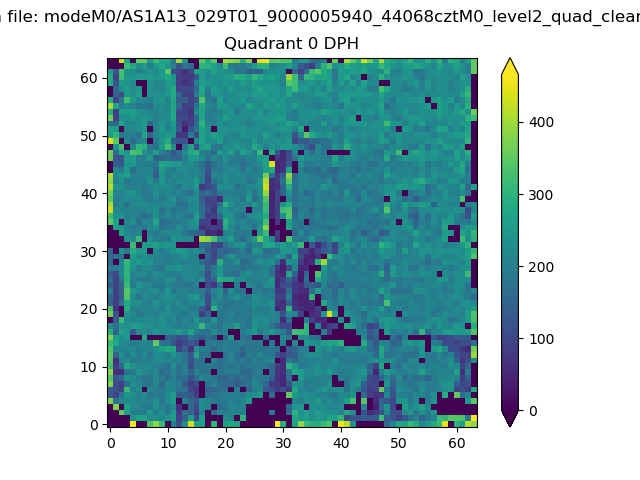 |
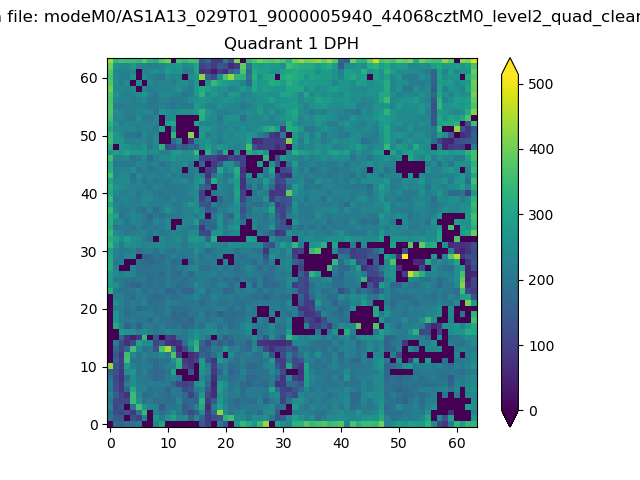 |
Quadrant B |
|---|---|---|---|
| Quadrant D | 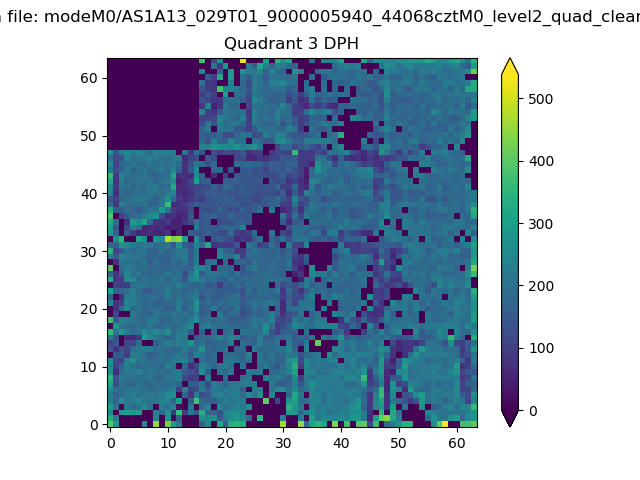 |
 |
Quadrant C |
| Plot type | Count rate plots | Images |
|---|---|---|
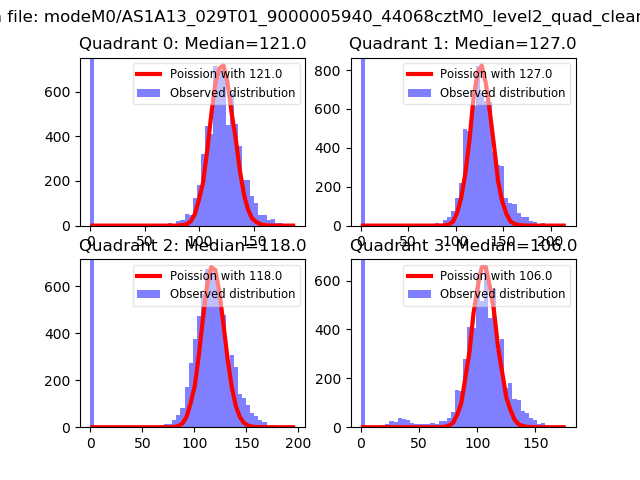
| Comparison with Poisson distribution Blue bars denote a histogram of data divided into 1 sec bins. Red curve is a Poisson curve with rate = median count rate of data. |
 |
 |
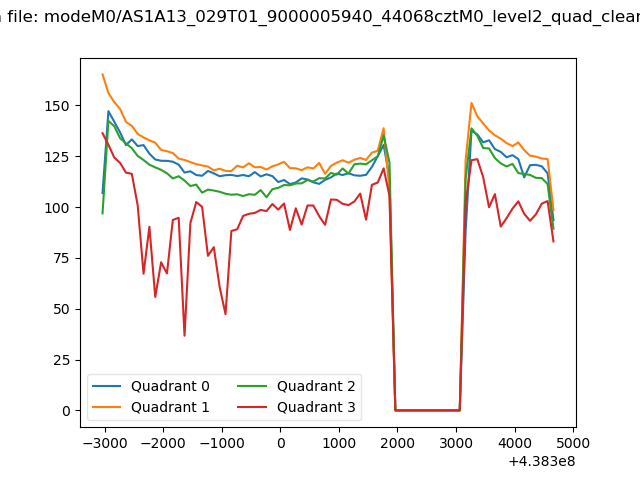
| Quadrant-wise count rates Data is divided into 100 sec bins |
 |
|
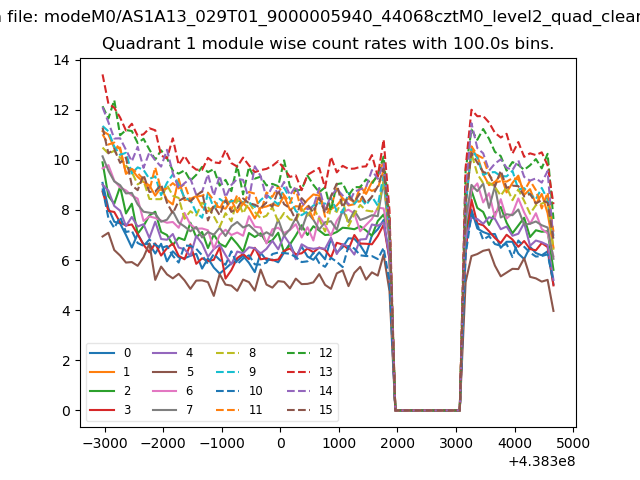
| Module-wise count rates for Quadrant A Data is divided into 100 sec bins |
 |
 |
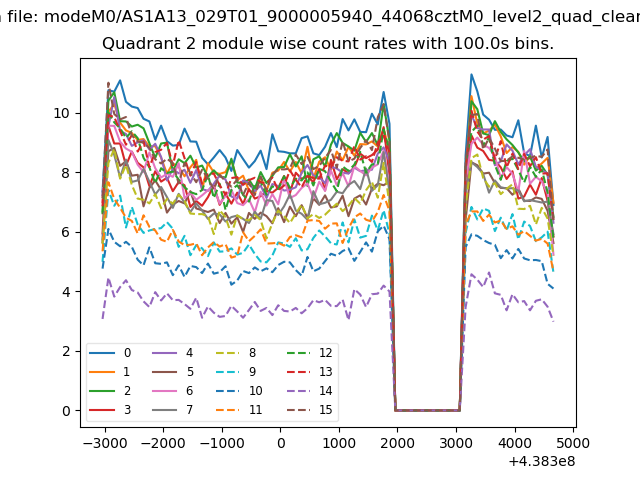
| Module-wise count rates for Quadrant B Data is divided into 100 sec bins |
 |
 |
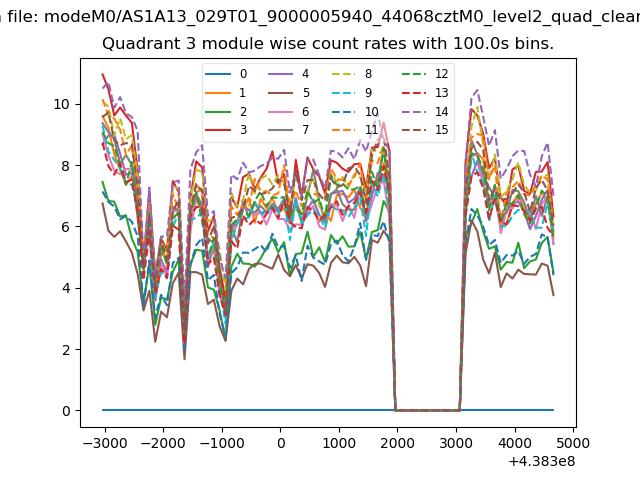
| Module-wise count rates for Quadrant C Data is divided into 100 sec bins |
 |
 |
| Module-wise count rates for Quadrant D Data is divided into 100 sec bins |
 |
 |
| Parameter | Plot |
|---|---|
| CZT HV Monitor | 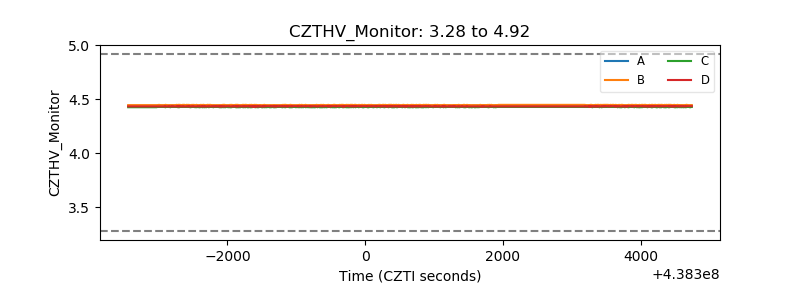 |
| D_VDD | 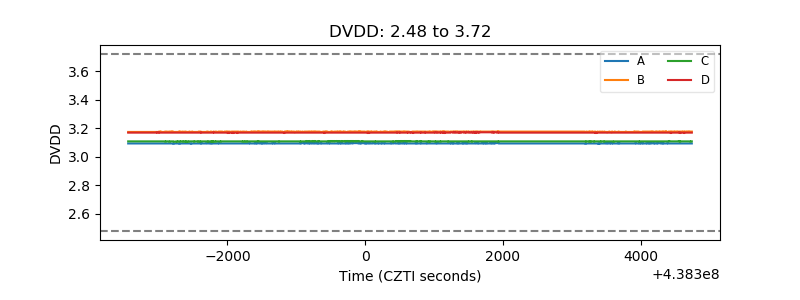 |
| Temperature 1 | 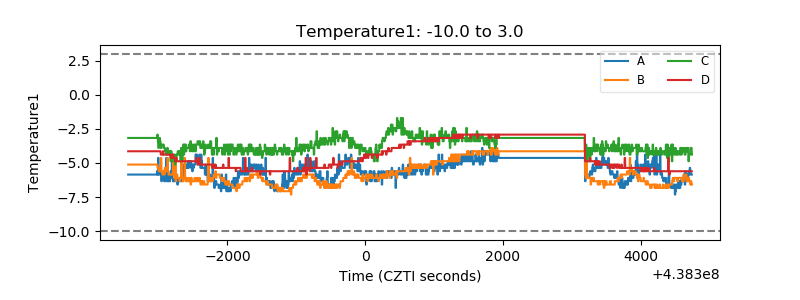 |
| Veto HV Monitor | 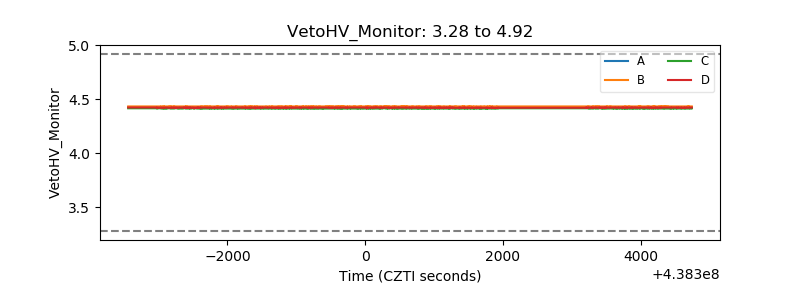 |
| Veto LLD | 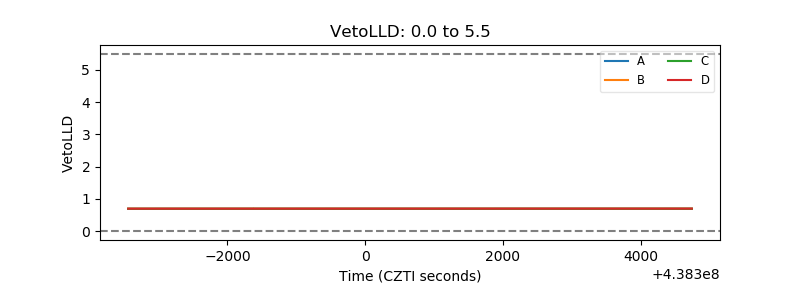 |
| Alpha Counter | 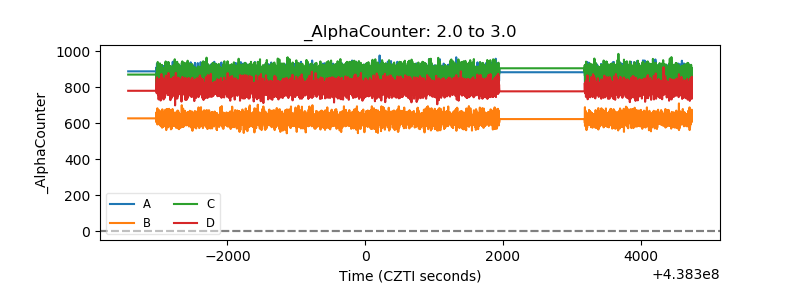 |
| _CPM_Rate | 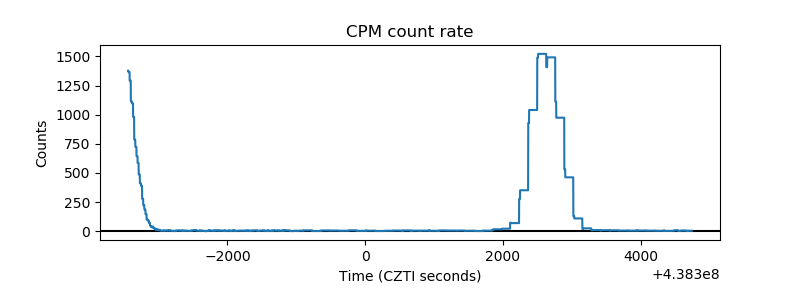 |
| CZT Counter | 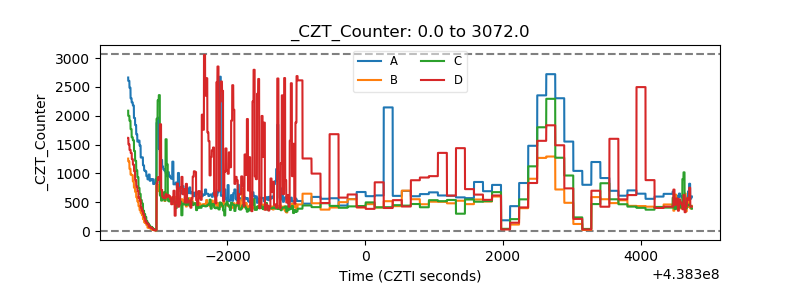 |
| +2.5 Volts monitor | 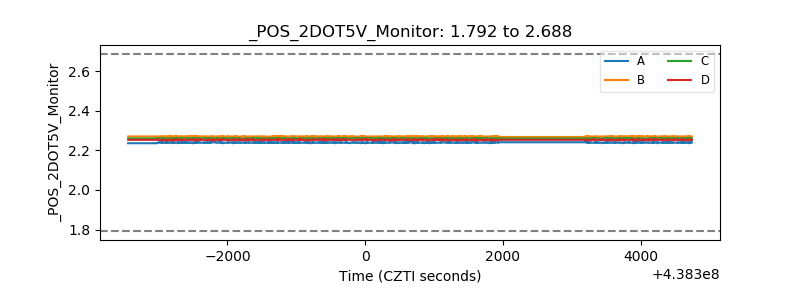 |
| +5 Volts monitor | 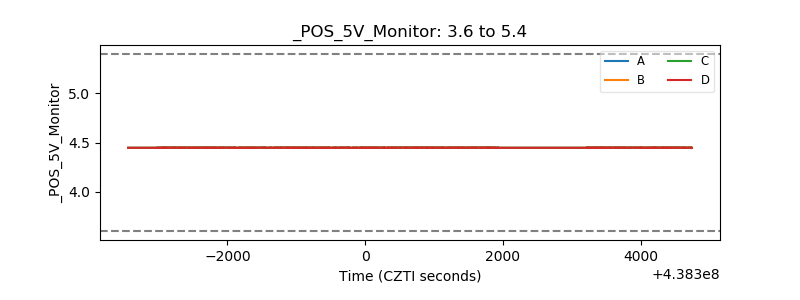 |
| _ROLL_ROT | 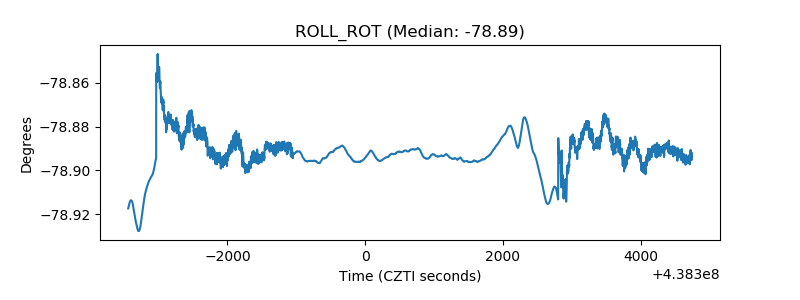 |
| _Roll_DEC | 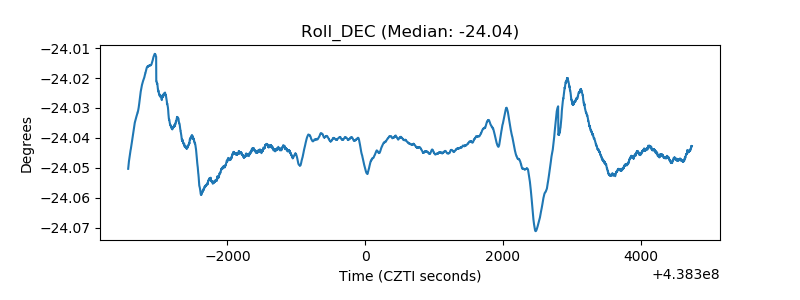 |
| _Roll_RA | 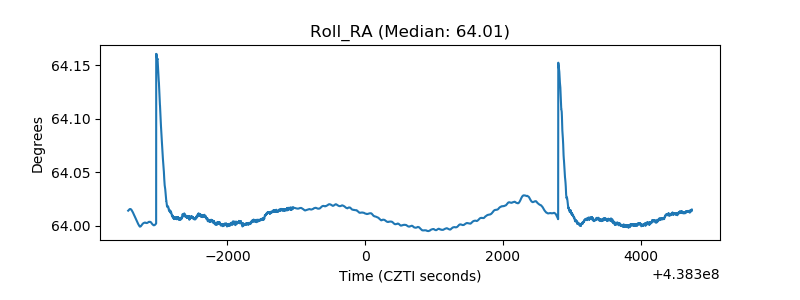 |
| Veto Counter | 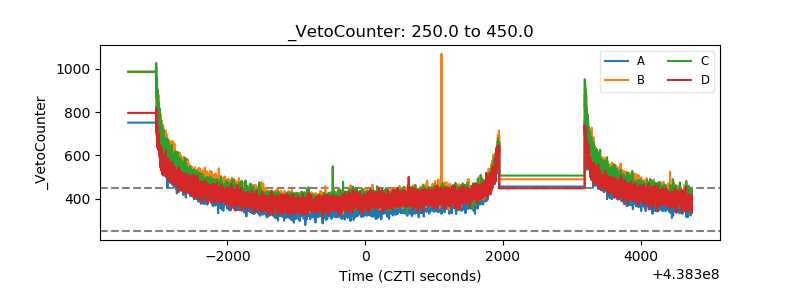 |