| Param | Original file | Final file |
|---|---|---|
| Filename | modeM0/AS1A13_029T01_9000005940_44069cztM0_level2.fits | modeM0/AS1A13_029T01_9000005940_44069cztM0_level2_quad_clean.evt |
| Size (bytes) | 420,537,600 | 109,751,040 |
| Size | 401.1 MB | 104.7 MB |
| Events in quadrant A | 4,248,611 | 739,497 |
| Events in quadrant B | 2,968,960 | 781,812 |
| Events in quadrant C | 3,038,791 | 726,578 |
| Events in quadrant D | 4,821,628 | 636,329 |
| Mode SS | |||
|---|---|---|---|
| Quadrant | BADHDUFLAG | Total packets | Discarded packets |
| A | 0 | 128 | 0 |
| B | 0 | 128 | 0 |
| C | 0 | 128 | 0 |
| D | 0 | 128 | 0 |
| Mode M0 | |||
|---|---|---|---|
| Quadrant | BADHDUFLAG | Total packets | Discarded packets |
| A | 0 | 17097 | 1 |
| B | 0 | 12972 | 1 |
| C | 0 | 13343 | 1 |
| D | 0 | 18573 | 1 |
| Mode M9 | |||
|---|---|---|---|
| Quadrant | BADHDUFLAG | Total packets | Discarded packets |
| A | 0 | 12 | 0 |
| B | 0 | 12 | 0 |
| C | 0 | 12 | 0 |
| D | 0 | 12 | 0 |
| Quadrant | Total seconds | Saturated seconds | Saturation percentage |
|---|---|---|---|
| A | 6293 | 104 | 1.652630% |
| B | 6293 | 39 | 0.619736% |
| C | 6293 | 28 | 0.444939% |
| D | 6294 | 355 | 5.640292% |
Noise dominated data is calculated using 1-second bins in cleaned event files. If a bin has >2000 counts, and if more than 50% of those come from <1% of pixels, then it is considered to be noise-dominated and hence unusable.
| Quadrant | # 1 sec bins | Bins with >0 counts | Bins with >2000 counts | High rate bins dominated by noise | Noise dominated (total time) | Noise dominated (detector-on time) | Marked lightcurve |
|---|---|---|---|---|---|---|---|
| A | 7483 | 6294 | 28 | 28 | 0.37% | 0.44% | 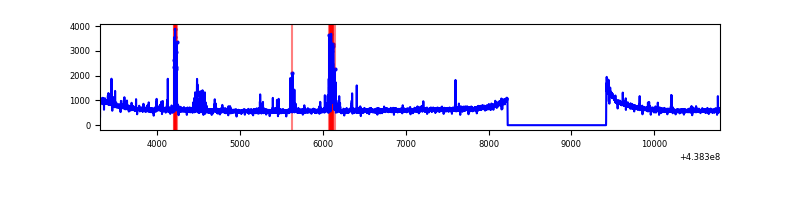 |
| B | 7483 | 6294 | 2 | 2 | 0.03% | 0.03% | 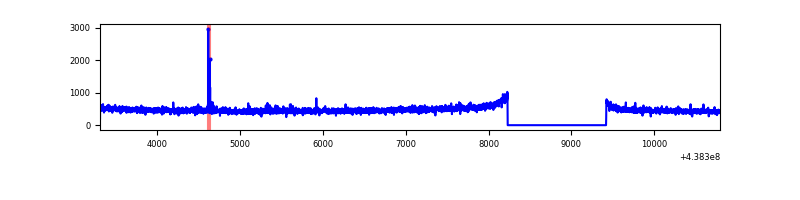 |
| C | 7483 | 6294 | 12 | 12 | 0.16% | 0.19% | 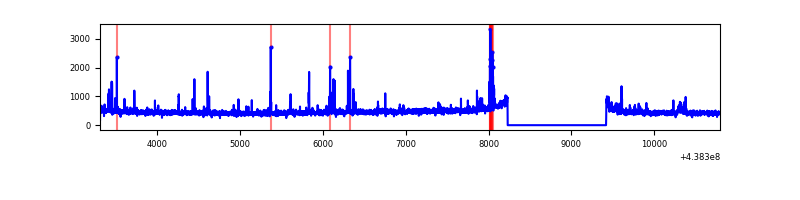 |
| D | 7484 | 6295 | 298 | 298 | 3.98% | 4.73% | 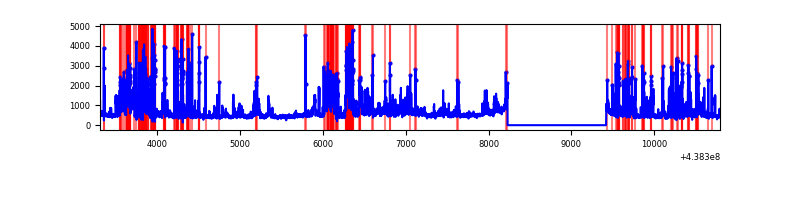 |
Top three noisy pixels from each quadrant. If the there are fewer than three noisy pixels in the level2.evt file, extra rows are filled as -1
| Pixel properties | Quadrant properties | ||||||
|---|---|---|---|---|---|---|---|
| Quadrant | DetID | PixID | Counts | Sigma | Mean | Median | Sigma |
| A | 10 | 83 | 1141408 | 7578.28 | 734 | 720 | 150.5 |
| A | 12 | 227 | 166501 | 1101.38 | 734 | 720 | 150.5 |
| A | 10 | 248 | 57125 | 374.73 | 734 | 720 | 150.5 |
| B | 4 | 173 | 35411 | 238.21 | 739 | 715 | 145.7 |
| B | 12 | 111 | 18815 | 124.27 | 739 | 715 | 145.7 |
| B | 14 | 111 | 17171 | 112.98 | 739 | 715 | 145.7 |
| C | 14 | 254 | 79680 | 455.95 | 728 | 733 | 173.1 |
| C | 14 | 96 | 53656 | 305.65 | 728 | 733 | 173.1 |
| C | 1 | 241 | 35104 | 198.51 | 728 | 733 | 173.1 |
| D | 13 | 249 | 1107490 | 6366.22 | 702 | 683 | 173.9 |
| D | 5 | 222 | 356213 | 2044.97 | 702 | 683 | 173.9 |
| D | 1 | 52 | 290390 | 1666.36 | 702 | 683 | 173.9 |
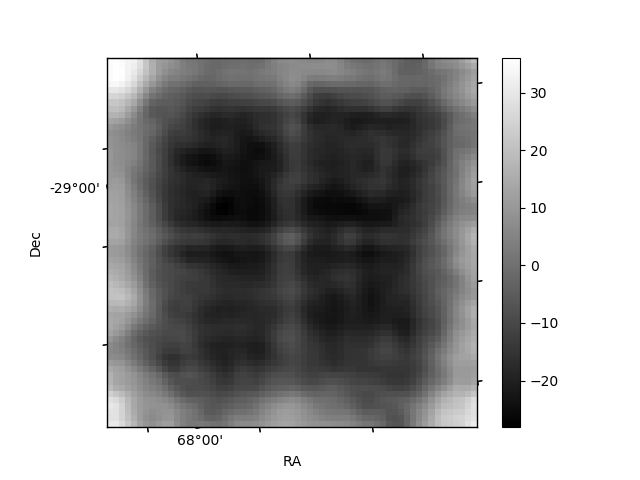
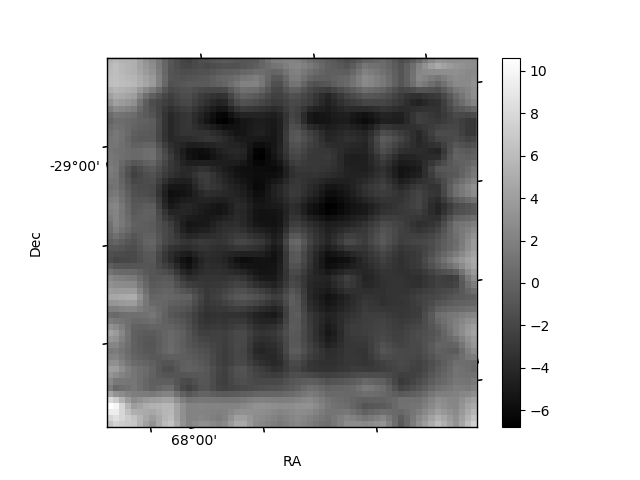
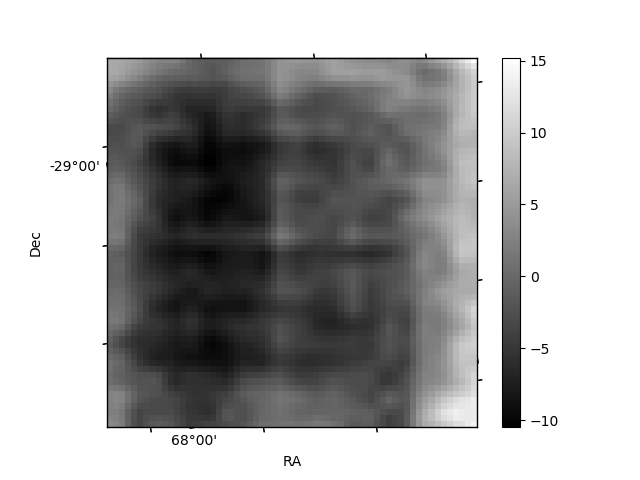
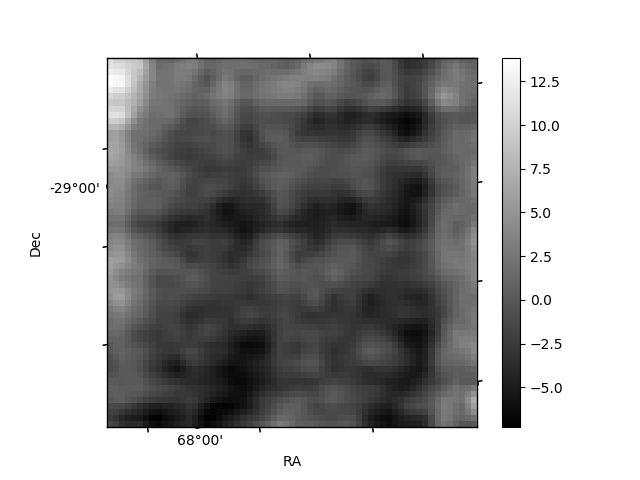
Histogram calculated using DETX and DETY for each event in the final _common_clean file
| Quadrant A | 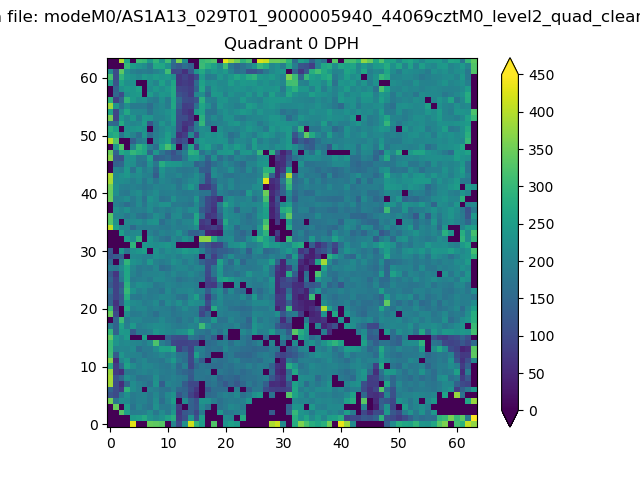 |
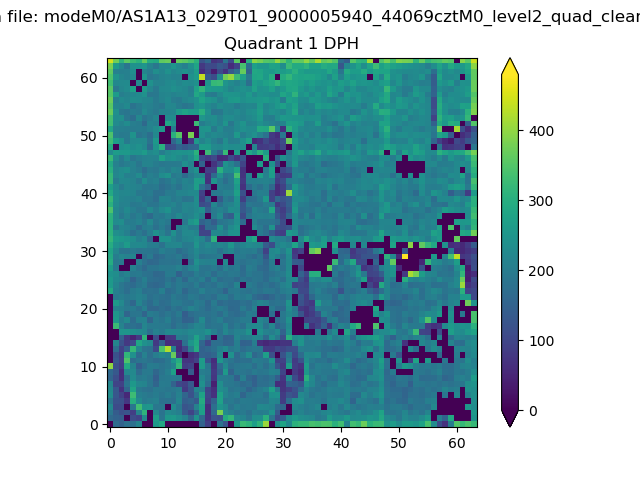 |
Quadrant B |
|---|---|---|---|
| Quadrant D | 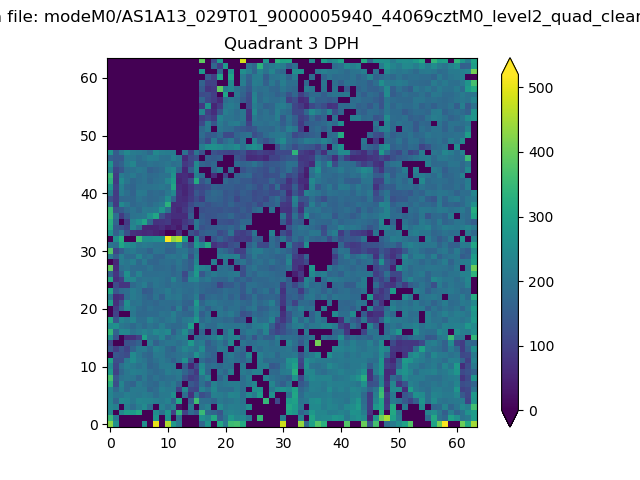 |
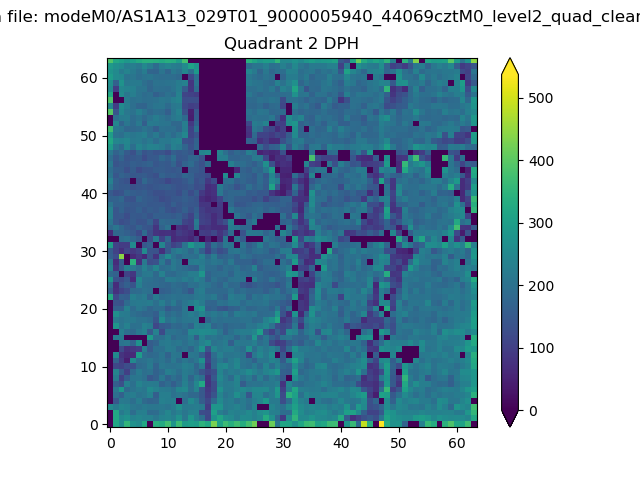 |
Quadrant C |
| Plot type | Count rate plots | Images |
|---|---|---|
| Comparison with Poisson distribution Blue bars denote a histogram of data divided into 1 sec bins. Red curve is a Poisson curve with rate = median count rate of data. |
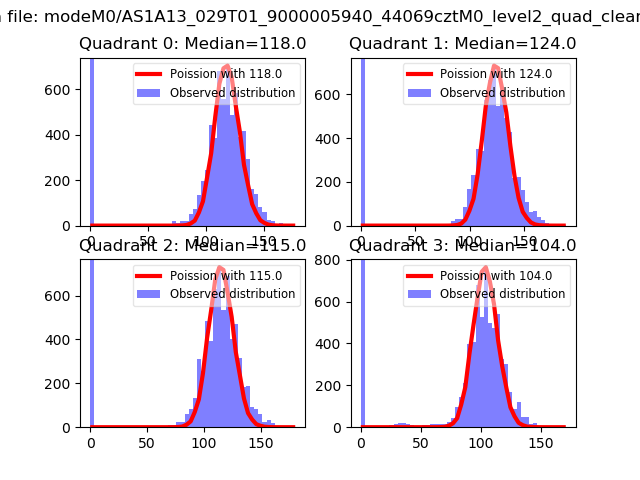 |
 |
| Quadrant-wise count rates Data is divided into 100 sec bins |
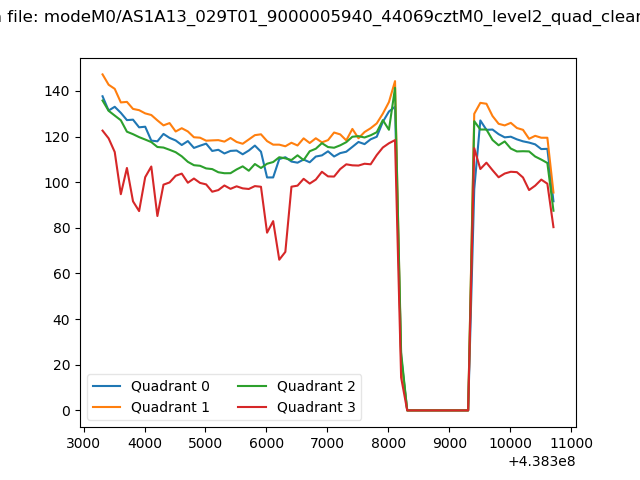 |
|
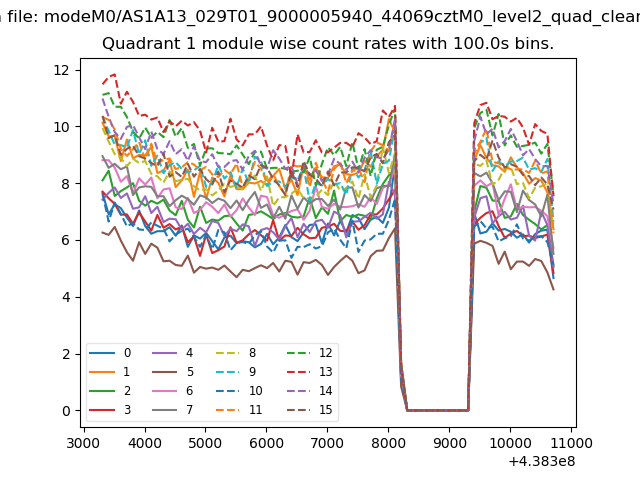
| Module-wise count rates for Quadrant A Data is divided into 100 sec bins |
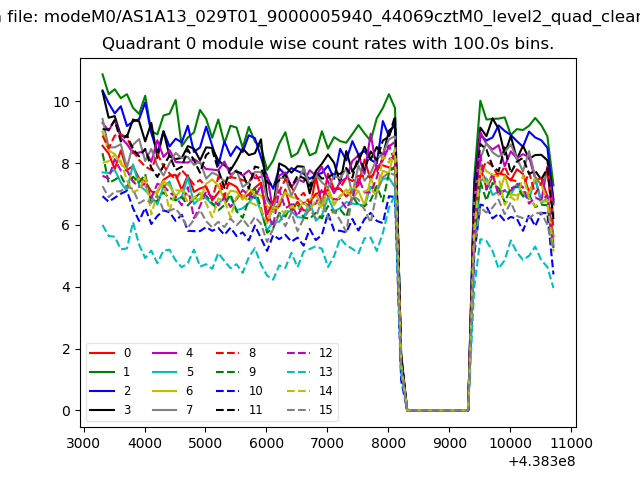 |
 |
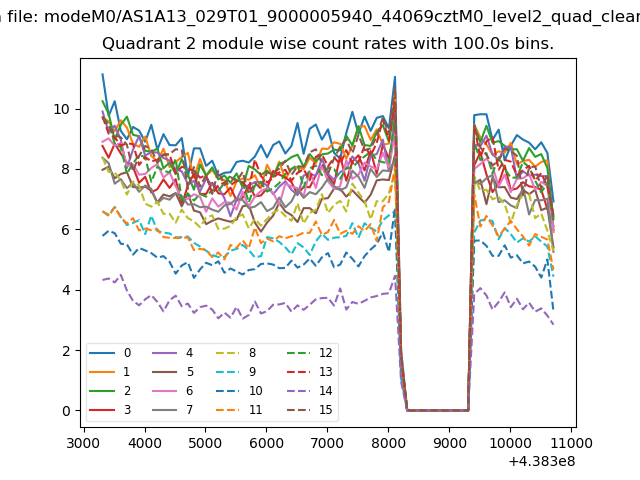
| Module-wise count rates for Quadrant B Data is divided into 100 sec bins |
 |
 |
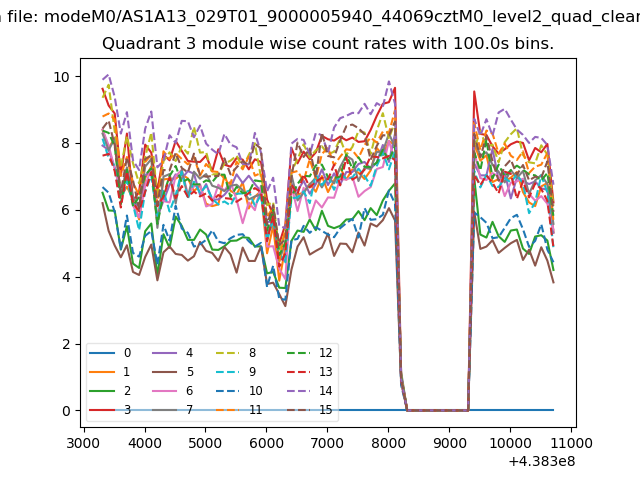
| Module-wise count rates for Quadrant C Data is divided into 100 sec bins |
 |
 |
| Module-wise count rates for Quadrant D Data is divided into 100 sec bins |
 |
 |
| Parameter | Plot |
|---|---|
| CZT HV Monitor | 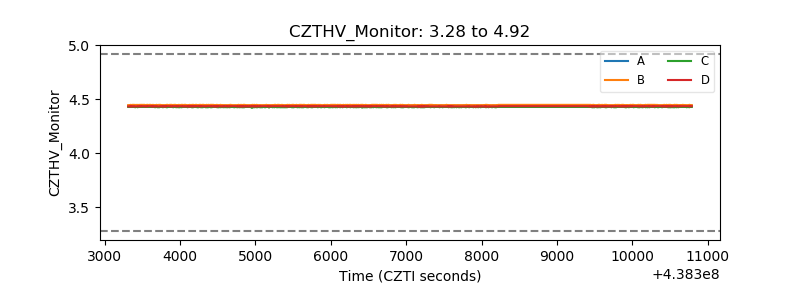 |
| D_VDD | 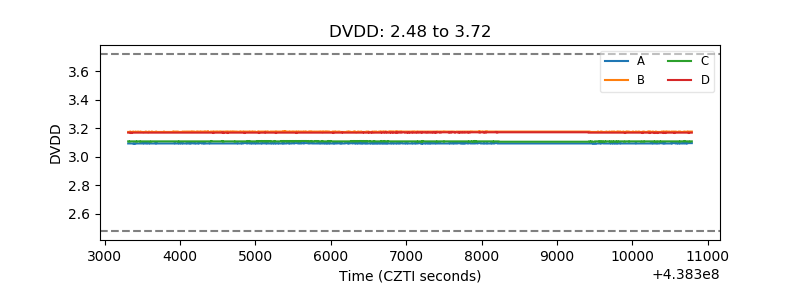 |
| Temperature 1 | 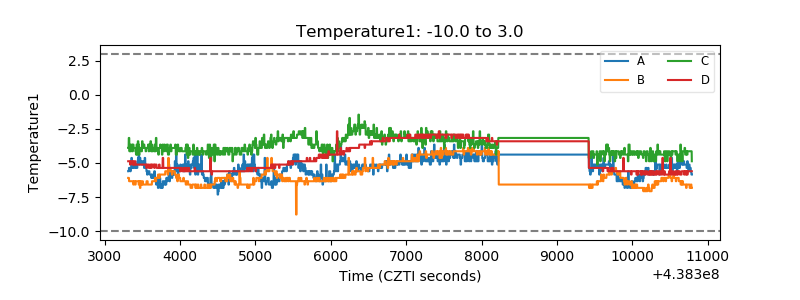 |
| Veto HV Monitor | 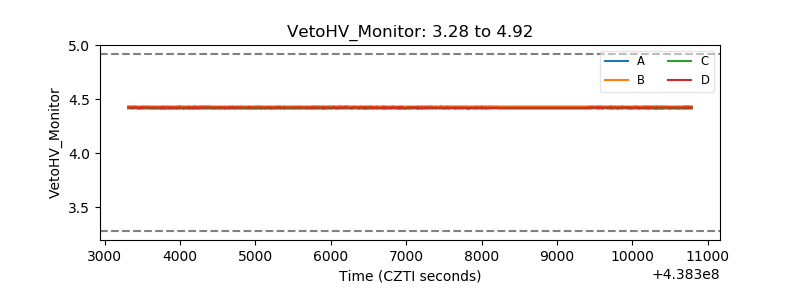 |
| Veto LLD | 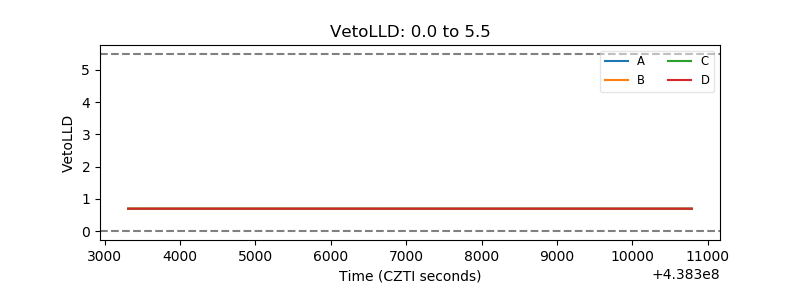 |
| Alpha Counter | 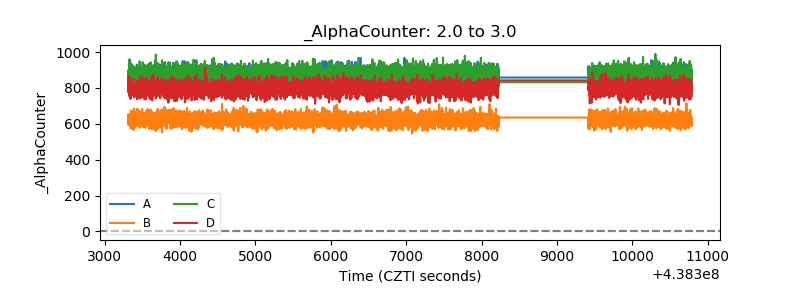 |
| _CPM_Rate | 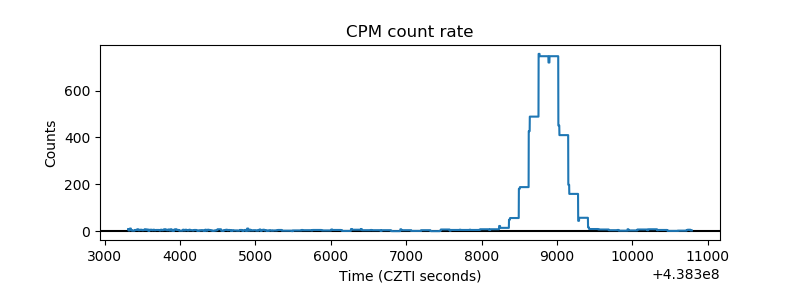 |
| CZT Counter | 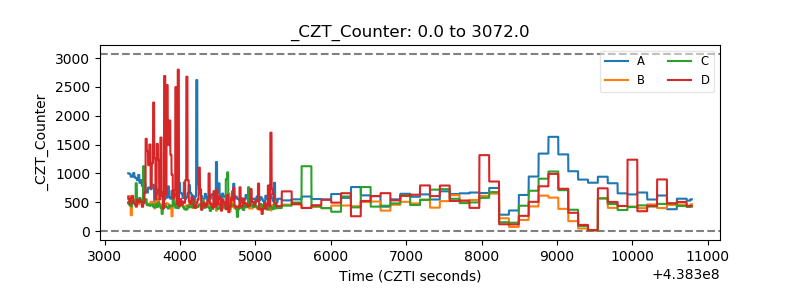 |
| +2.5 Volts monitor | 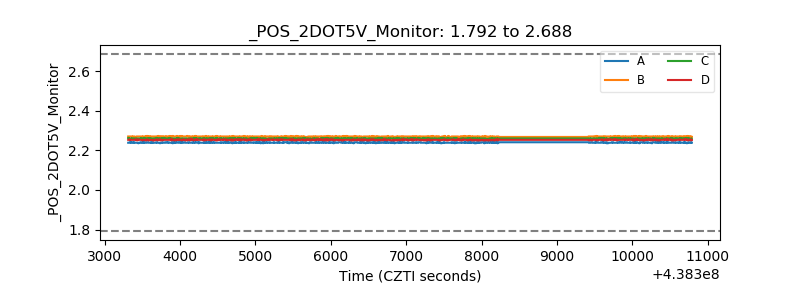 |
| +5 Volts monitor | 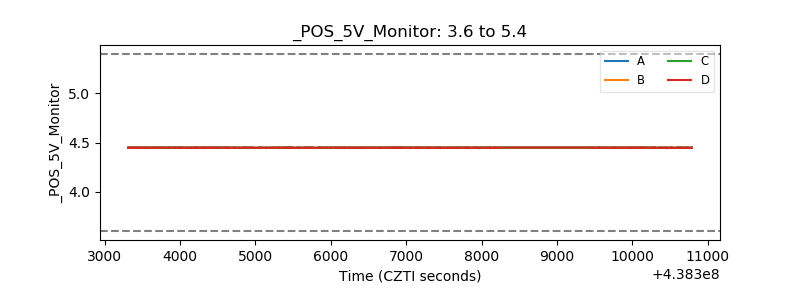 |
| _ROLL_ROT | 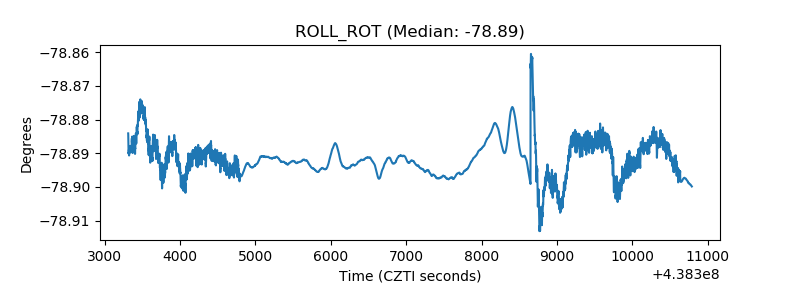 |
| _Roll_DEC | 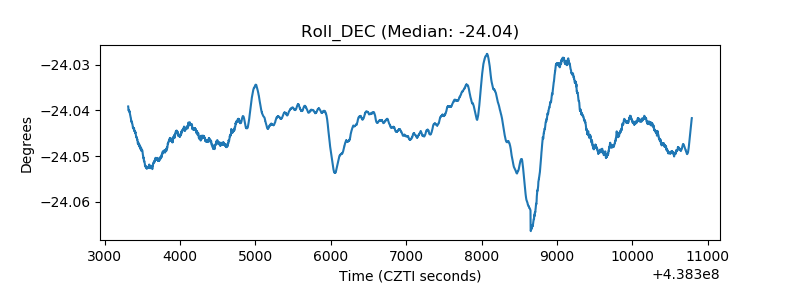 |
| _Roll_RA | 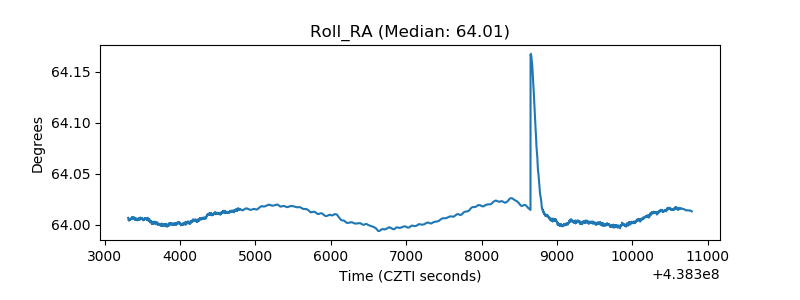 |
| Veto Counter | 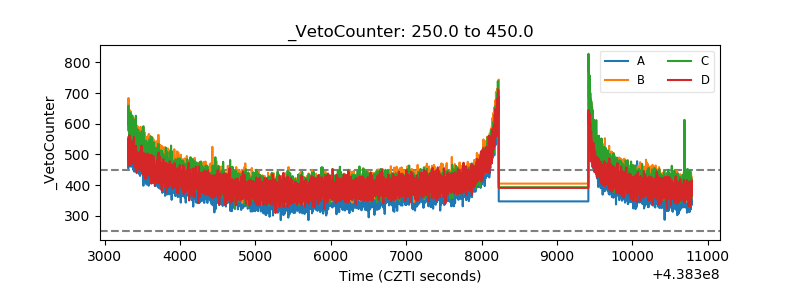 |